

Control of Line Tension at Phase-Separated Lipid Domain Boundaries: Monounsaturated Fatty Acids with Different Chain Lengths and Osmotic Pressure
- PMID: 36005696
- PMCID: PMC9415386
- DOI: 10.3390/membranes12080781
Control of Line Tension at Phase-Separated Lipid Domain Boundaries: Monounsaturated Fatty Acids with Different Chain Lengths and Osmotic Pressure
Abstract
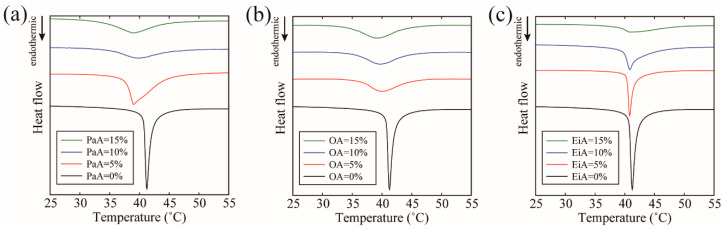
Line tension at phase-separated lipid domain boundaries is an important factor that governs the stability of the phase separation. We studied the control of the line tension in lipid membranes composed of dioleoylphosphocholine (DOPC), dipalmitoylphosphocholine (DPPC), and cholesterol (Chol) by the addition of the following three monounsaturated fatty acids (MUFAs) with different chain lengths: palmitoleic acid (PaA), oleic acid (OA), and eicosenoic acid (EiA). In addition, we attempted to alter the line tension by applying osmotic pressure. The phase behavior of the MUFA-containing lipid membranes in the presence and absence of osmotic stress was observed by fluorescence and confocal laser scanning microscopy. The line tension was quantitatively measured from the domain boundary fluctuation by flicker spectroscopy, and the interactions between the lipids and MUFAs were examined by differential scanning calorimetry. PaA and OA, which are shorter MUFAs, decreased the line tension, whereas EiA changed the liquid domain to a solid domain. The osmotic pressure increased the line tension, even in the presence of MUFAs. It may be possible to control the line tension by combining the chemical approach of MUFA addition and the physical approach of applying osmotic pressure.
Keywords: line tension; lipid membrane; monounsaturated fatty acid; osmotic pressure; phase separation.
Conflict of interest statement
The authors declare no conflict of interest.
Figures


Similar articles
-
Osmotic-Tension-Induced Membrane Lateral Organization.Langmuir. 2020 Mar 24;36(11):2937-2945. doi: 10.1021/acs.langmuir.9b03893. Epub 2020 Mar 16. Langmuir. 2020. PMID: 32175748
-
Formation of modulated phases and domain rigidification in fatty acid-containing lipid membranes.Phys Chem Chem Phys. 2017 May 24;19(20):13252-13263. doi: 10.1039/c7cp01201b. Phys Chem Chem Phys. 2017. PMID: 28492655
-
Thermal Stability of Phase-Separated Domains in Multicomponent Lipid Membranes with Local Anesthetics.Membranes (Basel). 2017 Jun 29;7(3):33. doi: 10.3390/membranes7030033. Membranes (Basel). 2017. PMID: 28661445 Free PMC article.
-
Oleic and docosahexaenoic acid differentially phase separate from lipid raft molecules: a comparative NMR, DSC, AFM, and detergent extraction study.Biophys J. 2004 Sep;87(3):1752-66. doi: 10.1529/biophysj.104.044552. Biophys J. 2004. PMID: 15345554 Free PMC article.
-
Monounsaturated Fatty Acid Levels May Not Affect Cardiovascular Events: Results From a Mendelian Randomization Analysis.Front Nutr. 2020 Sep 2;7:123. doi: 10.3389/fnut.2020.00123. eCollection 2020. Front Nutr. 2020. PMID: 32984395 Free PMC article.
Cited by
-
Physical Concept to Explain the Regulation of Lipid Membrane Phase Separation under Isothermal Conditions.Life (Basel). 2023 Apr 28;13(5):1105. doi: 10.3390/life13051105. Life (Basel). 2023. PMID: 37240749 Free PMC article. Review.
-
Osmotic Pressure and Its Biological Implications.Int J Mol Sci. 2024 Mar 14;25(6):3310. doi: 10.3390/ijms25063310. Int J Mol Sci. 2024. PMID: 38542282 Free PMC article. Review.
References
Grants and funding
LinkOut - more resources
Full Text Sources
