. 2022 Jul 28;8(4):57.
doi: 10.3390/ncrna8040057.

SV40 miR-S1 and Cellular miR-1266 Sequester Each Other from Their Targets, Enhancing Telomerase Activity and Viral Replication

Affiliations

SV40 miR-S1 and Cellular miR-1266 Sequester Each Other from Their Targets, Enhancing Telomerase Activity and Viral Replication

Tetsuyuki Takahashi et al. Noncoding RNA. .

Abstract

Virus-encoded microRNAs (miRNAs) target viral and host mRNAs to repress protein production from viral and host genes, and regulate viral persistence, cell transformation, and evasion of the immune system. The present study demonstrated that simian virus 40 (SV40)-encoded miRNA miR-S1 targets a cellular miRNA miR-1266 to derepress their respective target proteins, namely, T antigens (Tags) and telomerase reverse transcriptase (TERT). An in silico search for cellular miRNAs to interact with viral miR-S1 yielded nine potential miRNAs, five of which, including miR-1266, were found to interact with miR-S1 in dual-luciferase tests employing reporter plasmids containing the miRNA sequences with miR-S1. Intracellular bindings of miR-1266 to miR-S1 were also verified by the pull-down assay. These miRNAs were recruited into the Ago2-associated RNA-induced silencing complex. Intracellular coexpression of miR-S1 with miR-1266 abrogated the downregulation of TERT and decrease in telomerase activity induced by miR-1266. These effects of miR-S1 were also observed in miR-1266-expressing A549 cells infected with SV40. Moreover, the infected cells contained more Tag, replicated more viral DNA, and released more viral particles than control A549 cells infected with SV40, indicating that miR-S1-induced Tag downregulation was antagonized by miR-1266. Collectively, the present results revealed an interplay of viral and cellular miRNAs to sequester each other from their respective targets. This is a novel mechanism for viruses to manipulate the expression of viral and cellular proteins, contributing to not only viral lytic and latent replication but also cell transformation observed in viral infectious diseases including oncogenesis.

Keywords: interplay; miR-1266; miR-S1; miRNA; simian virus 40.


Conflict of interest statement

The authors declare that they have no conflict of interest.

Figures
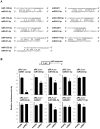
Figure 1
Figure 1
MiR-138-5p, miR-152-3p, miR-337-5p, miR-1266-5p, and miR-6771-5p are targets for SV40-miR-S1. (A) Schematic representation of possible complementary forms between miR-S1-3p and miR-138-5p, miR-152-3p, miR-337-5p, miR-434-5p, miR-532-3p, miR-921, miR-1266-5p, miR-4261, and miR-6771-5p. Seed sequences of each miRNA are underlined. (B) HEK293 cells were cotransfected with an internal pGL control vector, reporter vectors (pRL-Luc-miR-S1 compl., pRL-Luc-miR-138-5p, pRL-Luc-miR-152-3p, pRL-Luc-miR-337-5p, pRL-Luc-miR-434-5p, pRL-Luc-miR-532-3p, pRL-Luc-miR-921, pRL-Luc-miR-1266-5p, pRL-Luc-miR-4261, and pRL-Luc-miR-6771-5p), and mammalian expression vectors encoding pre-miR-S1 (CMV-miR-S1-PGK-puro) at a molar ratio of 1:5:25. pRL-Luc-miR-S1 compl. (described in [16]) was used as a positive control. The relative luciferase activities were calculated by dividing the value of pRL by the value of pGL. All values were normalized by empty vector-transfected cells. All experiments were repeated three times. Columns, mean values (n = 3); bars, standard deviation (SD); * p < 0.05.
Figure 2
Figure 2
Secondary structures of duplexes between miR-S1-3p and miR-138-5p, miR-152-3p, miR-337-5p, miR-434-5p, miR-532-3p, miR-921, miR-1266-5p, miR-4261, and miR-6771-5p. Each duplex was predicted using RNAstructure software (https://rna.urmc.rochester.edu/RNAstructure.html, accessed on 10 July 2022). Before outputting secondary structures, each combination of miRNAs was aligned by the GAAA linker sequence. The Gibbs free energies of predicted duplexes were shown under each secondary structure. Colors of each nucleotide symbol shows the probability that it will form the miR-S1-subjected miRNA-duplex. * Position of GAAA linker sequences.
Figure 3
Figure 3
MiR-S1-3p directly binds to endogenous miR-1266-5p, and trapped miR-1266-5p is sequestered in Ago2-associated RISC. (A) Lysates from biotinylated scramble sequence, miR-S1-3p, 5mt, and 3mt-transfected cells were pulled down with streptavidin-conjugated magnetic beads, and then RNAs were isolated. Using these RNAs, the levels of miR-1266-5p were determined by RT-qPCR. The Sequence of miR-S1-3p, 5mt, and 3mt (underlined) was also shown (right). All experiments were repeated two times. Columns, mean values (n = 3); bars, SD; ** p < 0.01. (B) Total RNAs from control and miR-S1-expressing BxPC-3 were subjected to RT-qPCR for miR-1266-5p and miR-S1-3p, respectively. In parallel, lysates from control and miR-S1-expressing BxPC-3 were treated with anti-Ago2 antibodies, precipitated with protein G-conjugated magnetic beads, and then RNAs were isolated. Using these RNAs, their levels of miR-1266-5p and miR-S1-3p were determined by RT-qPCR. All experiments were repeated two times. Columns, mean values (n = 3); bars, SD; ** p < 0.01.
Figure 4
Figure 4
MiR-S1 upregulates TERT levels through competitive antagonism with miR-1266. (A) HEK293 cells were cotransfected with the internal pGL control vector and pRL-Luc, pRL-Luc-hTERT-3′ UTR, or pRL-Luc-hTERT-3′ UTR mt, and CMV-miR-1266-PGK-puro at a molar ratio of 1:5:25. The relative luciferase activities were calculated by dividing the value of pRL by the value of pGL. All values were normalized by empty CMV-cont-PGK-puro-transfected cells. The sequence of the mutated region of pRL-Luc-hTERT-3′ UTR mt was also shown (underlined). Further, control and miR-1266−expressing cells were further transfected with pZac-hTERT-HA-3′ UTR. The levels of HA in the resultant transfectants were determined by immunoblot analysis. Each experiment was repeated two (immunoblot analysis) or three (reporter assay) times. Columns, mean values (n = 3); bars, SD; * p < 0.05; ** p < 0.01. (B) HEK293 cells were cotransfected with the internal pGL control vector, pRL-Luc-hTERT-3′ UTR, and miRNA expression vectors at a total molar ratio of 1:5:25. The relative luciferase activities were calculated by dividing the value of pRL by the value of pGL. All values were normalized by corresponding empty vector-transfected cells. All experiments were repeated three times. Columns, mean values (n = 3); bars, SD; * p < 0.01. (C) Lysates from control and miR-S1-expressing BxPC-3 were also treated with anti−Ago1, Ago2, Ago3, and Ago4 antibodies before being precipitated with protein G-conjugated magnetic beads, and RNAs were isolated. Using these RNAs, the level of TERT mRNA 3′ UTR was determined by RT-qPCR. Columns, mean values (n = 3); bars, SD; * p < 0.05. The levels of Ago1, Ago2, Ago3, and Ago4 in control and miR-S1-expressing BxPC-3 were also determined by immunoblot analysis. (D) Levels of endogenous TERT protein in BxPC-3- and A549-derived infectants were determined using immunoblot analysis. The levels of TERT protein (TERT/beta-tubulin) were calculated using ImageJ software. All experiments were repeated three times. Columns, mean values (n = 4); bars, SD; ** p < 0.01. (E) Cellular TERT activities in BxPC-3− and A549−derived infectants were measured using the TRAP assay. TRAP reactions were conducted by 50 cells (BxPC-3) or 80 cells (A549) per reaction, respectively. Using ImageJ software, specific activities were calculated by quantifying the intensity of ladder bands at vertical lines (middle−long telomeric repeats). All experiments were repeated two times.
Figure 5
Figure 5
MiR-S1 induced by SV40 infection and miR-1266 mutually interfere with their respective targets, namely, TERT and T antigens. (A,C) Total RNAs were extracted from control and miR-1266 −expressing A549 cells infected with SV40 or SV40/TAD. At 3 dpi, total RNAs were subjected to RT-qPCR for miR-1266-5p and miR-S1-3p. Levels of miR-1266-5p, miR-S1-3p, and LSTag were determined by RT-qPCR. Levels of LTag and STag mRNA were also sorely detected by semiquantitative RT-PCR. All experiments were repeated two times. Columns, mean values (n = 3); bars, SD; ** p < 0.01. (B) Uninfected or SV40-infected control and miR-1266−expressing A549 cells were cotransfected with internal pGL control vector and pRL-Luc, pRL-Luc-miR-S1 compl., pRL-Luc-miR-S1 compl. mt, pRL-Luc-hTERT-3′ UTR, or pRL-Luc-hTERT-3′ UTR mt at a molar ratio of 1:5. The relative luciferase activities were calculated by dividing the value of pRL-Luc by the value of pGL. All experiments were repeated two times. Columns, mean values (n = 3); bars, SD; ** p < 0.01. (D) Total RNAs from control and miR-1266−expressing A549 were infected with SV40 or SV40/TAD. At 3 dpi, total RNAs were subjected to RT-qPCR for TERT mRNA. Columns, mean values (n = 3); bars, SD; * p < 0.05; ** p < 0.01. (E) Levels of LTag, STag, and TERT proteins in uninfected or SV40-infected control and miR-1266−expressing A549 cells were determined using immunoblot analysis. Expression ratios of TERT protein (TERT/beta-tubulin) were calculated using ImageJ software. All experiments were repeated two times.
Figure 6
Figure 6
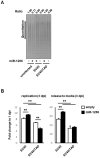
The interplay between miR-S1 and miR-1266 promotes TERT activity and viral replication of SV40. (A) Using the TRAP assay, cellular TERT activities in uninfected, SV40, or SV40/TAD-infected control and miR-1266−expressing A549 cells were determined. TRAP reactions were conducted by 80 cells per reaction. Using ImageJ software, specific activities were calculated by quantifying the intensity of ladder bands at vertical lines (middle−long telomeric repeats). All experiments were repeated two times. (B) Control and miR-S1−expressing A549 were infected with SV40 or SV40/TAD, and then genomic DNA from cells or culture media was subjected to RT-qPCR with the specific primers for LSTag. Fold changes of the SV40 level at 3 dpi were determined by dividing them by 1 at 1 dpi. All experiments were repeated two times. Columns, mean values (n = 3); bars, SD; ** p < 0.01.

Similar articles

Cited by

References

    1. Cheng J., DeCaprio J.A., Fluck M.M., Schaffhausen B.S. Cellular transformation by simian virus 40 and murine polyoma virus T antigens. Semin. Cancer Biol. 2009;19:218–228. doi: 10.1016/j.semcancer.2009.03.002. - DOI - PMC - PubMed
    1. Sullivan C.S., Pipas J.M. T antigens of simian virus 40: Molecular chaperones for viral replication and tumorigenesis. Microbiol. Mol. Biol. Rev. 2002;66:179–202. doi: 10.1128/MMBR.66.2.179-202.2002. - DOI - PMC - PubMed
    1. Pipas J.M. SV40: Cell transformation and tumorigenesis. Virology. 2009;384:294–303. doi: 10.1016/j.virol.2008.11.024. - DOI - PubMed
    1. Yang S.I., Lickteig R.L., Estes R., Rundell K., Walter G., Munby M.C. Control of protein phosphatase 2A by simian virus 40 small-t antigen. Mol. Cell Biol. 1991;11:1988–1995. - PMC - PubMed
    1. Sontag E., Fedorov S., Kamibayashi C., Robbins D., Cobb M., Munby M. The interaction of SV40 small tumor antigen with protein phosphatase 2A stimulates the map kinase pathway and induces cell proliferation. Cell. 1993;75:887–897. doi: 10.1016/0092-8674(93)90533-V. - DOI - PubMed

LinkOut - more resources