Retinal Transcriptome and Cellular Landscape in Relation to the Progression of Diabetic Retinopathy
- PMID: 36006018
- PMCID: PMC9424969
- DOI: 10.1167/iovs.63.9.26
Retinal Transcriptome and Cellular Landscape in Relation to the Progression of Diabetic Retinopathy
Abstract
Purpose: Previous studies that identify putative genes associated with diabetic retinopathy are only focusing on specific clinical stages, thus resulting genes are not necessarily reflective of disease progression. This study identified genes associated with the severity level of diabetic retinopathy using the likelihood-ratio test (LRT) and ordinal logistic regression (OLR) model, as well as to profile immune and retinal cell landscape in progressive diabetic retinopathy using a machine learning deconvolution approach.
Methods: This study used a published transcriptomic dataset (GSE160306) from macular regions of donors with different degrees of diabetic retinopathy (10 healthy controls, 10 cases of diabetes, 9 cases of nonproliferative diabetic retinopathy, and 10 cases of proliferative diabetic retinopathy or combined with diabetic macular edema). LRT and OLR models were applied to identify severity-associated genes. In addition, CIBERSORTx was used to estimate proportional changes of immune and retinal cells in progressive diabetic retinopathy.
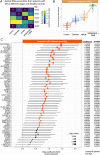
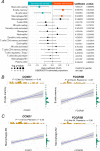
Results: By controlling for gender and age using LRT and OLR, 50 genes were identified to be significantly increased in expression with the severity of diabetic retinopathy. Functional enrichment analyses suggested these severity-associated genes are related to inflammation and immune responses. CCND1 and FCGR2B are further identified as key regulators to interact with many other severity-associated genes and are crucial to inflammation. Deconvolution analyses demonstrated that the proportions of memory B cells, M2 macrophages, and Müller glia were significantly increased with the progression of diabetic retinopathy.
Conclusions: These findings demonstrate that deep analyses of transcriptomic data can advance our understanding of progressive ocular diseases, such as diabetic retinopathy, by applying LRT and OLR models as well as bulk gene expression deconvolution.
Conflict of interest statement
Disclosure:
Figures


Similar articles
-
Bulk Gene Expression Deconvolution Reveals Infiltration of M2 Macrophages in Retinal Neovascularization.Invest Ophthalmol Vis Sci. 2021 Nov 1;62(14):22. doi: 10.1167/iovs.62.14.22. Invest Ophthalmol Vis Sci. 2021. PMID: 34797904 Free PMC article.
-
Gene Biomarkers Related to Th17 Cells in Macular Edema of Diabetic Retinopathy: Cutting-Edge Comprehensive Bioinformatics Analysis and In Vivo Validation.Front Immunol. 2022 May 16;13:858972. doi: 10.3389/fimmu.2022.858972. eCollection 2022. Front Immunol. 2022. PMID: 35651615 Free PMC article.
-
CD8+T Cell-Related Gene Biomarkers in Macular Edema of Diabetic Retinopathy.Front Endocrinol (Lausanne). 2022 Jul 22;13:907396. doi: 10.3389/fendo.2022.907396. eCollection 2022. Front Endocrinol (Lausanne). 2022. PMID: 35937822 Free PMC article.
-
Proposed international clinical diabetic retinopathy and diabetic macular edema disease severity scales.Ophthalmology. 2003 Sep;110(9):1677-82. doi: 10.1016/S0161-6420(03)00475-5. Ophthalmology. 2003. PMID: 13129861 Review.
-
Prognostic factors for the development and progression of proliferative diabetic retinopathy in people with diabetic retinopathy.Cochrane Database Syst Rev. 2023 Feb 22;2(2):CD013775. doi: 10.1002/14651858.CD013775.pub2. Cochrane Database Syst Rev. 2023. PMID: 36815723 Free PMC article. Review.
Cited by
-
Asymptotic Properties for Cumulative Probability Models for Continuous Outcomes.Mathematics (Basel). 2023 Dec 2;11(24):4896. doi: 10.3390/math11244896. Epub 2023 Dec 7. Mathematics (Basel). 2023. PMID: 38374966 Free PMC article.
-
lncRNA HOTAIR promotes ROS generation and NLRP3 inflammasome activation by inhibiting Nrf2 in diabetic retinopathy.Medicine (Baltimore). 2023 Sep 15;102(37):e35155. doi: 10.1097/MD.0000000000035155. Medicine (Baltimore). 2023. PMID: 37713847 Free PMC article.
-
The immune-related plasma protein LAT2 as a protective modulator in diabetic retinopathy: a Mendelian randomization study.Front Endocrinol (Lausanne). 2025 Jul 17;16:1638661. doi: 10.3389/fendo.2025.1638661. eCollection 2025. Front Endocrinol (Lausanne). 2025. PMID: 40747309 Free PMC article.
-
Multi-omics and experimental validation studies reveal key biomarkers of cellular senescence in diabetic retinopathy.Diabetol Metab Syndr. 2025 Aug 12;17(1):326. doi: 10.1186/s13098-025-01899-y. Diabetol Metab Syndr. 2025. PMID: 40790234 Free PMC article.
-
FCGR2B knockdown alleviates diabetes-induced cognitive dysfunction by altering neuronal excitability.Mol Med. 2025 Jun 19;31(1):242. doi: 10.1186/s10020-025-01301-7. Mol Med. 2025. PMID: 40537751 Free PMC article.
References
Publication types
MeSH terms
LinkOut - more resources
Full Text Sources
Medical
Research Materials
Miscellaneous

