. 2022 Aug 4;10(8):450.
doi: 10.3390/toxics10080450.

Tolerance and Heavy Metal Accumulation Characteristics of Sasa argenteostriata (Regel) E.G. Camus under Zinc Single Stress and Combined Lead-Zinc Stress

Affiliations

Tolerance and Heavy Metal Accumulation Characteristics of Sasa argenteostriata (Regel) E.G. Camus under Zinc Single Stress and Combined Lead-Zinc Stress

Jiarong Liao et al. Toxics. .

Abstract

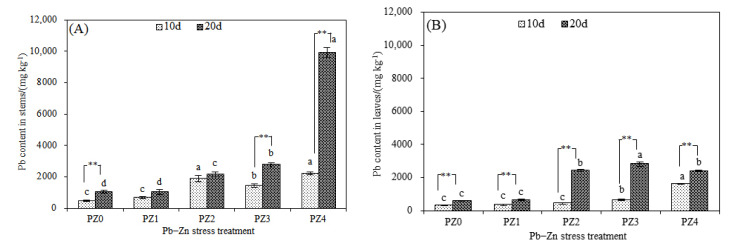
Sasa argenteostriata (Regel) E.G. Camus is a gramineous plant with the potential for phytoremediation. In this study, we aimed to determine its tolerance to zinc stress and combined lead-zinc stress and the effect of zinc on its absorption and accumulation characteristics of lead. The results showed that S. argenteostriata had good tolerance to zinc stress, and S. argenteostriata was not significantly damaged when the zinc stress concentration was 600 mg/L. Under both zinc stress and combined lead-zinc stress, the root was the main organ that accumulated heavy metals in S. argenteostriata. The presence of zinc promoted the absorption of lead by the root of S. argenteostriata, and the lead content in the root under PZ1, PZ2, PZ3 and PZ4 treatments was 2.15, 4.31, 4.47 and 6.01 times that of PZ0 on the 20 days. In the combined lead-zinc stress treatments, the toxicity of heavy metals to S. argenteostriata was mainly caused by lead. Under high concentrations of combined lead-zinc stress (PZ4), the proportion of zinc in the leaf of S. argenteostriata on the 20 days increased, which was used as a tolerance strategy to alleviate the toxicity of lead.

Keywords: Sasa argenteostriata (Regel) E.G. Camus; accumulation characteristics; combined zinc–lead stress.


Conflict of interest statement

The authors report that there are no competing interests to declare.

Figures

Figure 1
Figure 1
Impacts of different Zn treatments on malonaldehyde content in roots (A), malonaldehyde content in leaves (B), free proline content in leaves (C) and soluble sugar content in leaves (D). Along the x-axis of each graph, Z0, Z1, Z2, Z3, Z4 and Z5 indicate that the Zn concentrations are 0 (or control), 75, 150, 300, 600 and 1000 mg/L, respectively. Vertical bars represent the standard errors of the mean (n = 3). Different letters indicate significant differences among treatments with different Zn concentrations (p < 0.05).
Figure 2
Figure 2
Impacts of different treatment times and Zn treatments on Zn content in roots (A), Zn content in rhizomes (B), Zn content in stems (C) and Zn content in leaves (D). Along the x-axis of each graph, Z0, Z1, Z2, Z3, Z4 and Z5 indicate that the Zn concentrations are 0 (or control), 75, 150, 300, 600 and 1000 mg/L, respectively. Vertical bars represent the standard errors of the mean (n = 3). Different letters indicate significant differences among treatments with different Zn concentrations under the same treatment time (p < 0.05). * indicates a significant difference at 0.05 under the same treatment and different time (p < 0.05). ** indicates an extremely significant difference at 0.01 under the same treatment and different time (p < 0.01).
Figure 3
Figure 3
Impacts of different Pb–Zn treatments on malonaldehyde content in roots (A), malonaldehyde content in leaves (B), free proline content in leaves (C) and soluble sugar content in leaves (D). Along the x-axis of each graph, CK indicates that the Pb and Zn concentration is 0 (or control), and PZ0, PZ1, PZ2, PZ3 and PZ4 indicate that the Pb concentration are 300 mg/L and that the Zn concentrations are 0, 75, 150, 300 and 600 mg/L, respectively. Vertical bars represent the standard errors of the mean (n = 3). Different letters indicate significant differences among treatments with different Zn concentrations (p < 0.05).
Figure 4
Figure 4
Impacts of different treatment durations and Pb–Zn treatments on Pb content in roots (A), Pb content in rhizomes (B), Zn content in roots (C), Zn content in rhizomes (D), the total content of Pb and Zn in roots after 20 days of treatment (E) and total content of Pb and Zn in rhizomes after 20 days of treatment (F). Along the x-axis of each graph, PZ0, PZ1, PZ2, PZ3 and PZ4 indicate that the Pb concentration is 300 mg/L and that the Zn concentrations are 0, 75, 150, 300, and 600 mg/L, respectively. Vertical bars represent the standard errors of the mean (n = 3). Different letters indicate significant differences among treatments with different Zn concentrations under the same treatment time (p < 0.05). ** indicates an extremely significant difference at 0.01 under the same treatment and different time (p < 0.01).
Figure 4
Figure 4
Impacts of different treatment durations and Pb–Zn treatments on Pb content in roots (A), Pb content in rhizomes (B), Zn content in roots (C), Zn content in rhizomes (D), the total content of Pb and Zn in roots after 20 days of treatment (E) and total content of Pb and Zn in rhizomes after 20 days of treatment (F). Along the x-axis of each graph, PZ0, PZ1, PZ2, PZ3 and PZ4 indicate that the Pb concentration is 300 mg/L and that the Zn concentrations are 0, 75, 150, 300, and 600 mg/L, respectively. Vertical bars represent the standard errors of the mean (n = 3). Different letters indicate significant differences among treatments with different Zn concentrations under the same treatment time (p < 0.05). ** indicates an extremely significant difference at 0.01 under the same treatment and different time (p < 0.01).
Figure 5
Figure 5
Impacts of different treatment times and Pb–Zn treatments on Pb content in stems (A), Pb content in leaves (B), Zn content in stems (C), Zn content in leaves (D), the total content of Pb and Zn in stems after 20 days of treatment (E) and total content of Pb and Zn in leaves after 20 days of treatment (F). Along the x-axis of each graph, PZ0, PZ1, PZ2, PZ3 and PZ4 indicate that the Pb concentration is 300 mg/L and that the Zn concentrations are 0, 75, 150, 300, and 600 mg/L, respectively. Vertical bars represent the standard errors of the mean (n = 3). Different letters indicate significant differences among treatments with different Zn concentrations under the same treatment time (p < 0.05). ** indicates an extremely significant difference at 0.01 under the same treatment and different time (p < 0.01).
Figure 5
Figure 5
Impacts of different treatment times and Pb–Zn treatments on Pb content in stems (A), Pb content in leaves (B), Zn content in stems (C), Zn content in leaves (D), the total content of Pb and Zn in stems after 20 days of treatment (E) and total content of Pb and Zn in leaves after 20 days of treatment (F). Along the x-axis of each graph, PZ0, PZ1, PZ2, PZ3 and PZ4 indicate that the Pb concentration is 300 mg/L and that the Zn concentrations are 0, 75, 150, 300, and 600 mg/L, respectively. Vertical bars represent the standard errors of the mean (n = 3). Different letters indicate significant differences among treatments with different Zn concentrations under the same treatment time (p < 0.05). ** indicates an extremely significant difference at 0.01 under the same treatment and different time (p < 0.01).

Similar articles

Cited by

References

    1. Dong L.J., Tong X.J., Li X.B., Zhou J., Wang S.F., Liu B. Some developments and new insights of environmental problems and deep mining strategy for cleaner production in mines. J. Clean. Prod. 2019;210:1562–1578. doi: 10.1016/j.jclepro.2018.10.291. - DOI
    1. Obiora S.C., Chukwu A., Toteu S.F., Davies T.C. Assessment of heavy metal contamination in soils around lead (Pb)-zinc (Zn) mining areas in Enyigba, southeastern Nigeria. J. Geol. Soc. India. 2016;87:453–462. doi: 10.1007/s12594-016-0413-x. - DOI
    1. Barac N., Skrivanj S., Mutic J., Manojlovic D., Bukumiric Z., Zivojinovic D., Petrovic R., Corac A. Heavy Metals Fractionation in Agricultural Soils of Pb/Zn Mining Region and Their Transfer to Selected Vegetables. Water Air Soil Pollut. 2016;227:481. doi: 10.1007/s11270-016-3177-4. - DOI
    1. Dong J., Yang Q.W., Sun L.N., Zeng Q., Liu S.J., Pan J., Liu X.L. Assessing the concentration and potential dietary risk of heavy metals in vegetables at a Pb/Zn mine site, China. Environ. Earth Sci. 2011;64:1317–1321. doi: 10.1007/s12665-011-0992-1. - DOI
    1. Kan X.Q., Dong Y.Q., Feng L., Zhou M., Hou H.B. Contamination and health risk assessment of heavy metals in China’s lead-zinc mine tailings: A meta-analysis. Chemosphere. 2021;267:128909. doi: 10.1016/j.chemosphere.2020.128909. - DOI - PubMed

LinkOut - more resources