. 2022 Sep 5;221(9):e202111084.
doi: 10.1083/jcb.202111084. Epub 2022 Aug 25.

Composition and organization of kinetochores show plasticity in apicomplexan chromosome segregation

Affiliations

Composition and organization of kinetochores show plasticity in apicomplexan chromosome segregation

Lorenzo Brusini et al. J Cell Biol. .

Abstract

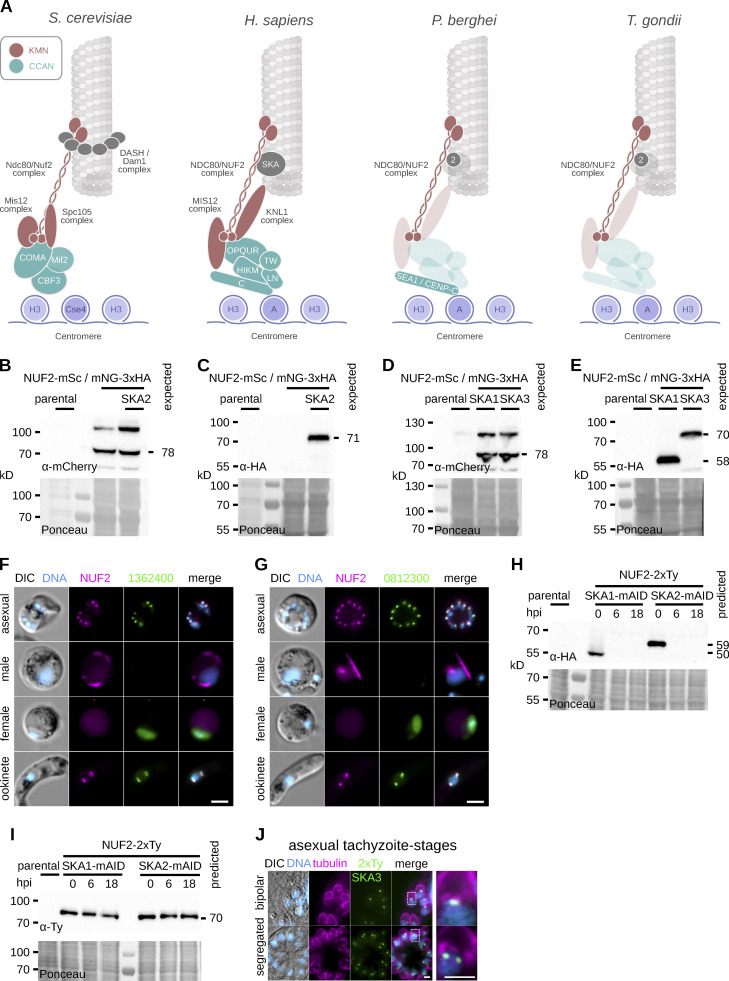
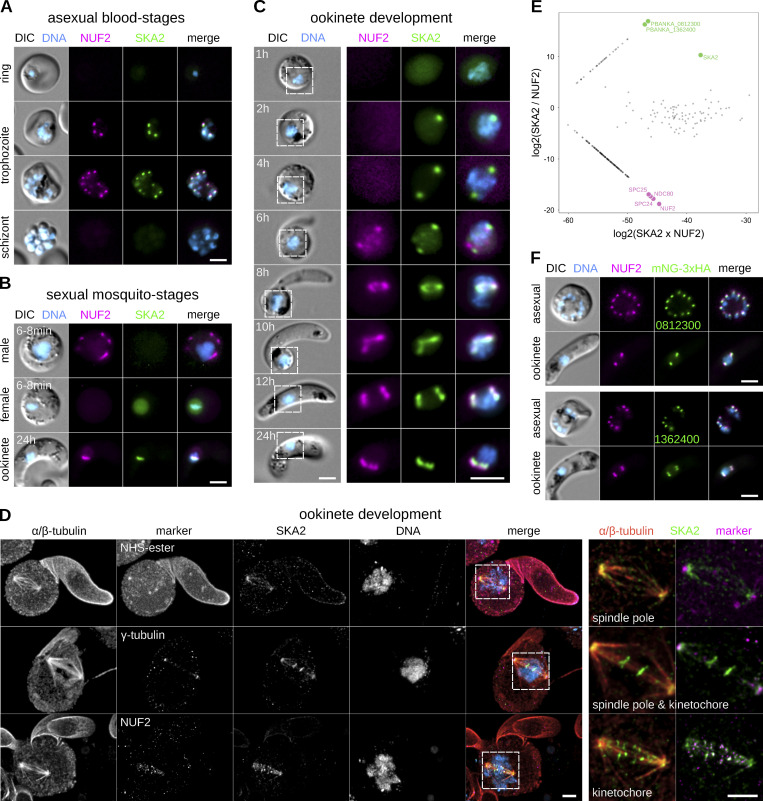
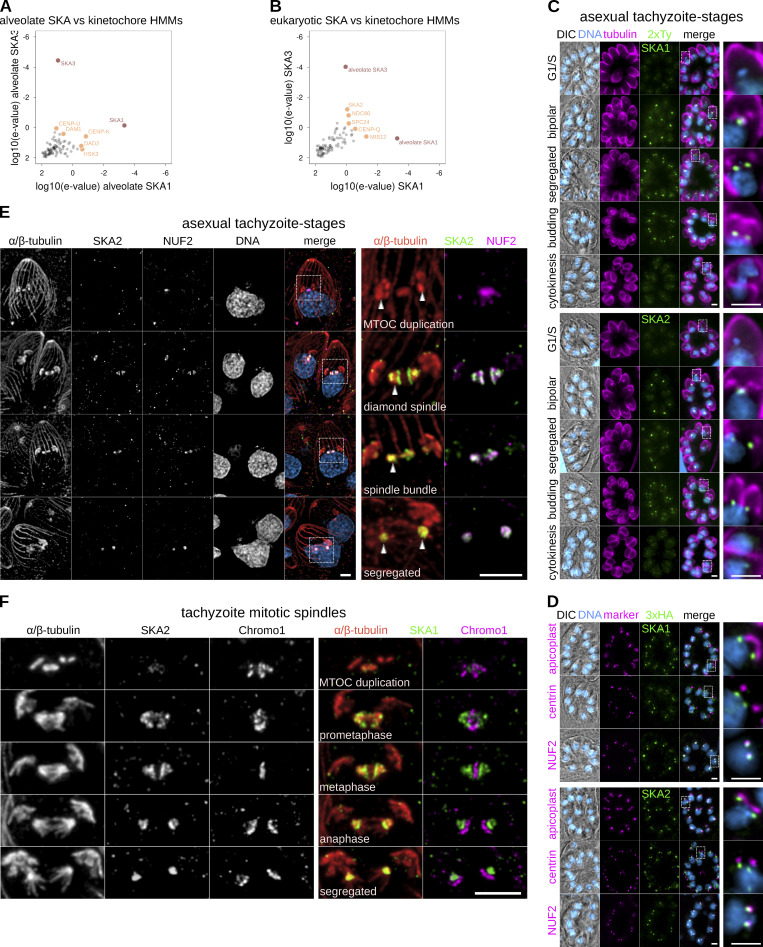
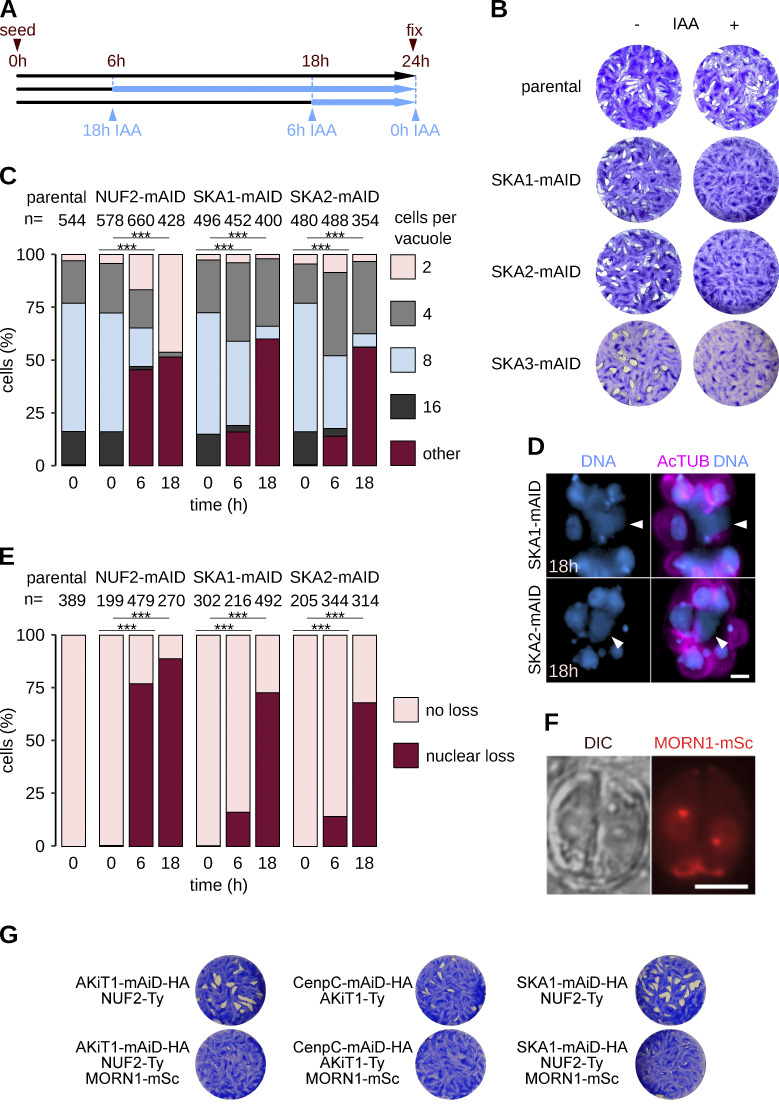
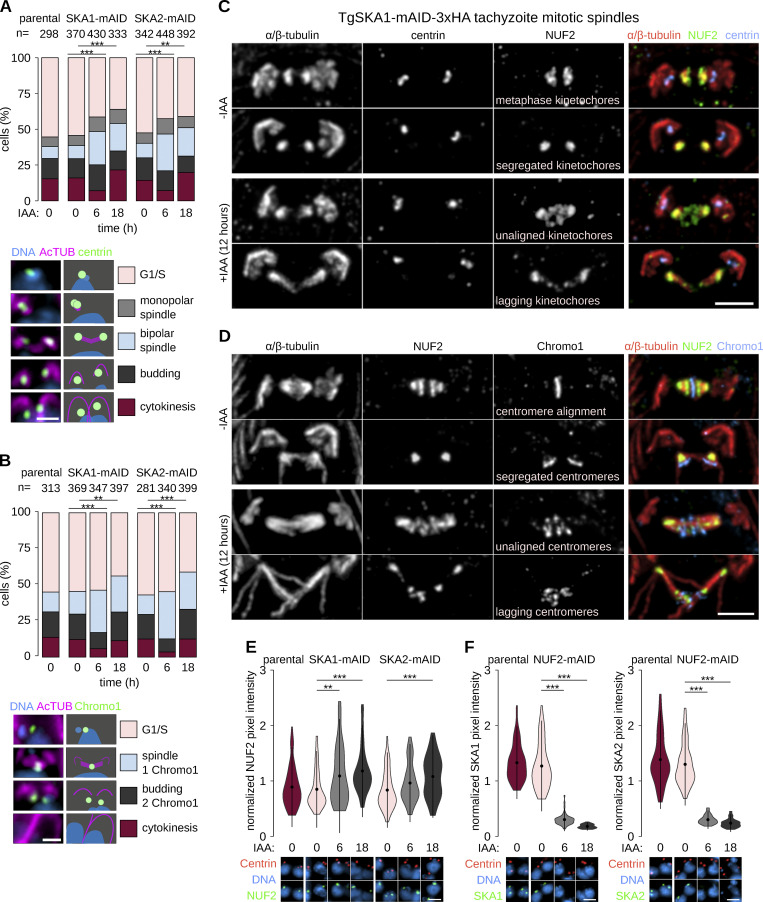
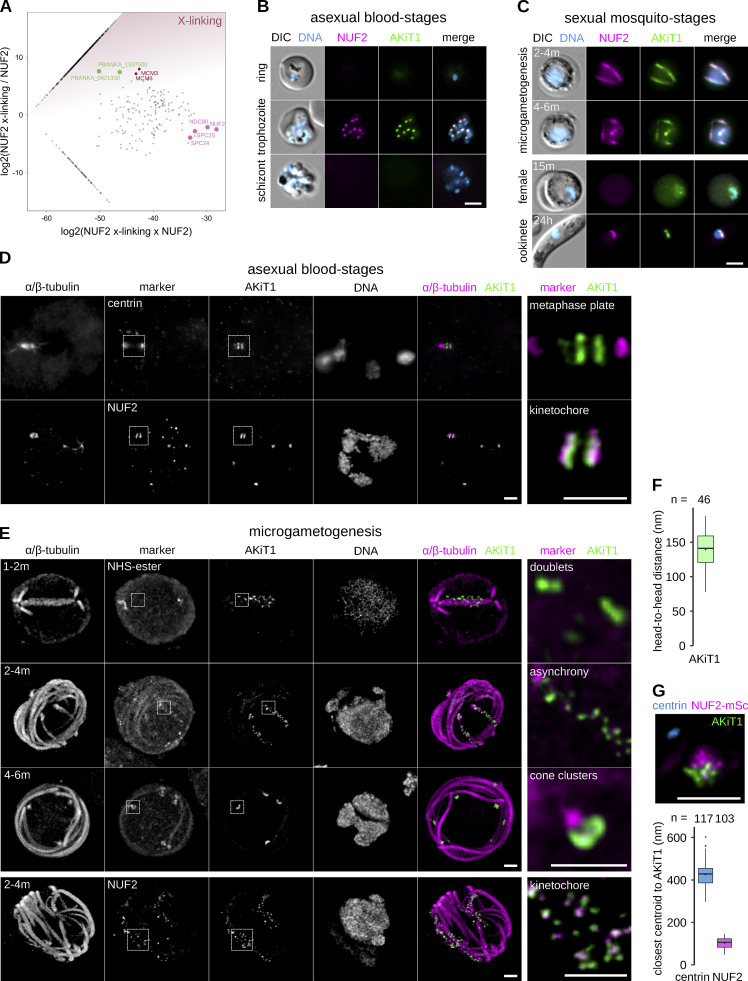
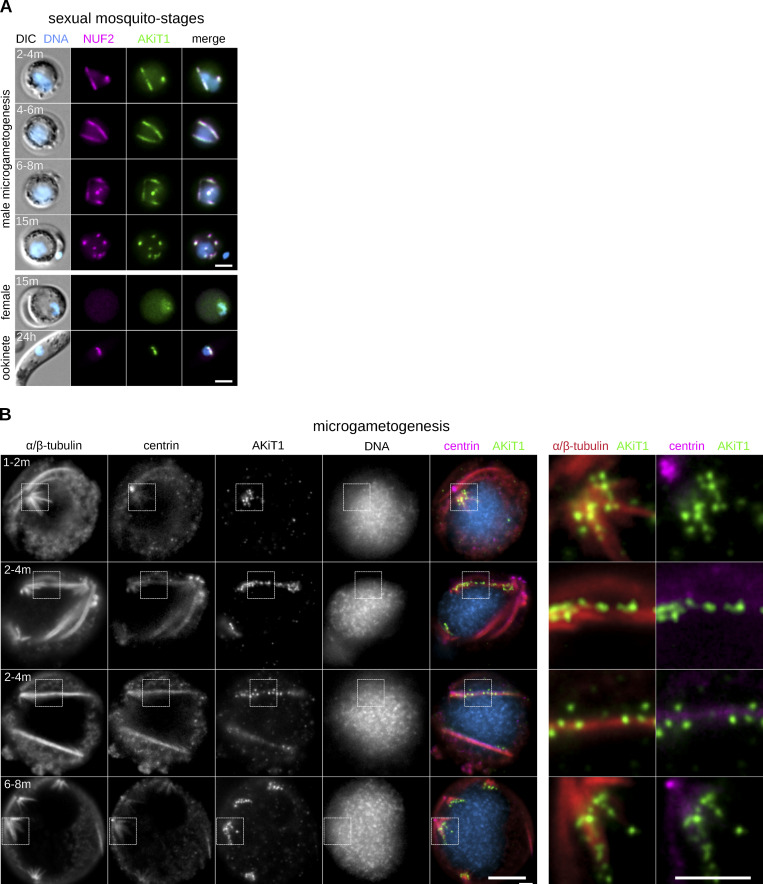
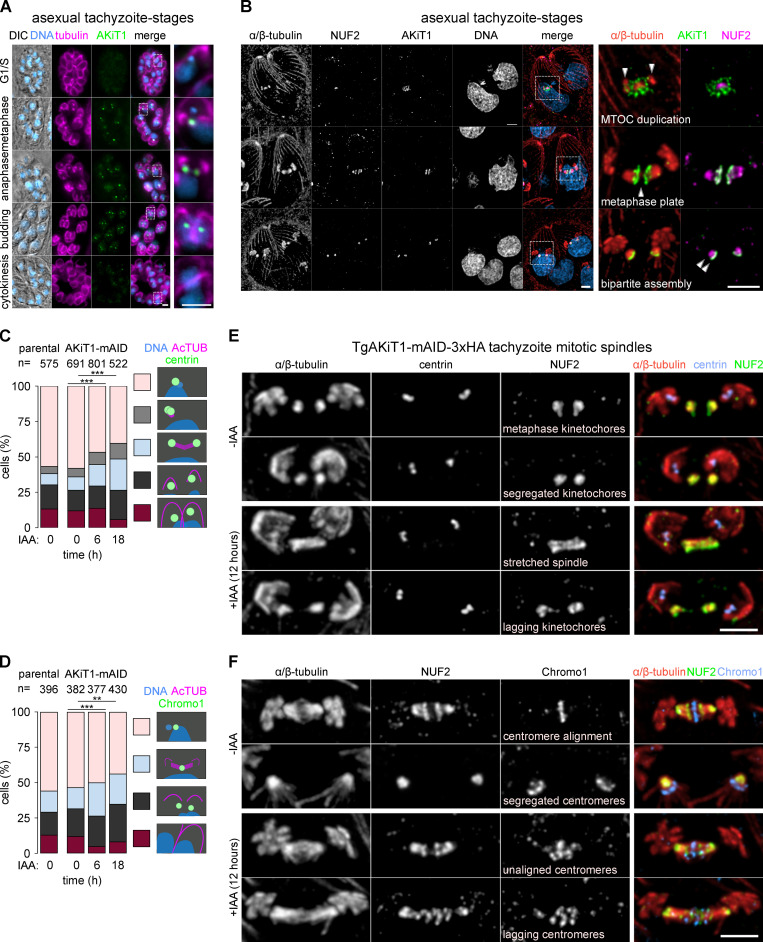
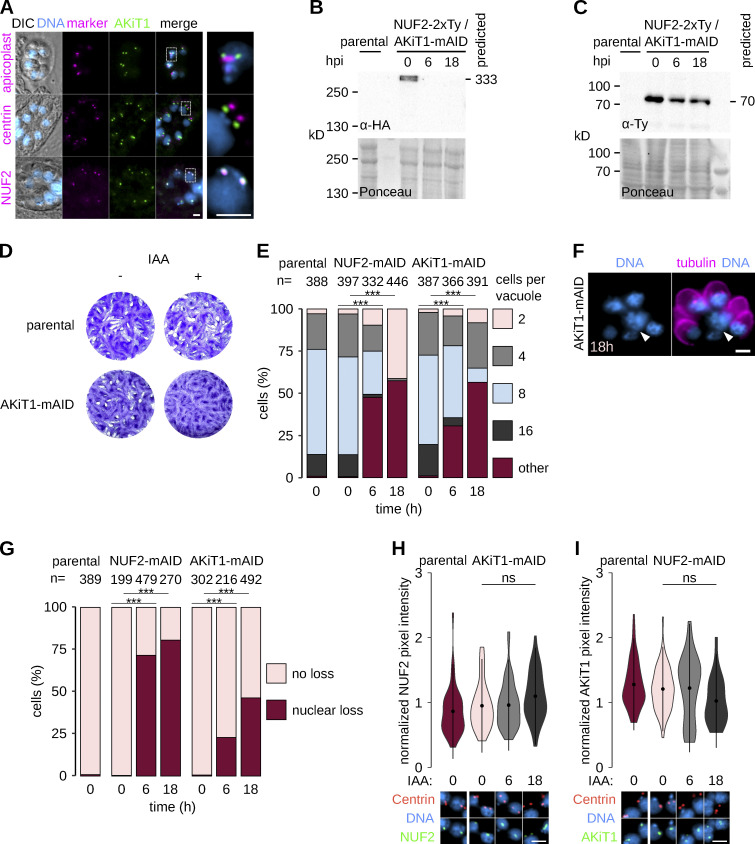
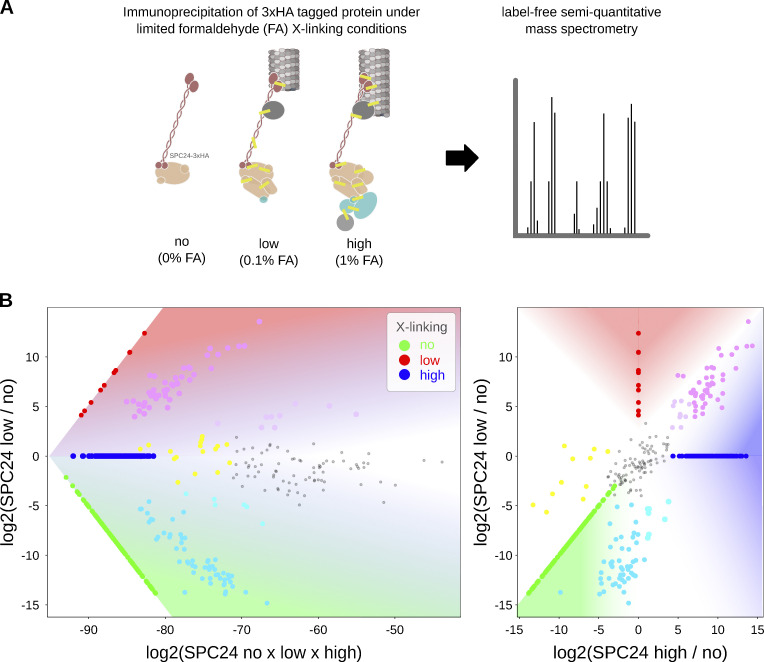
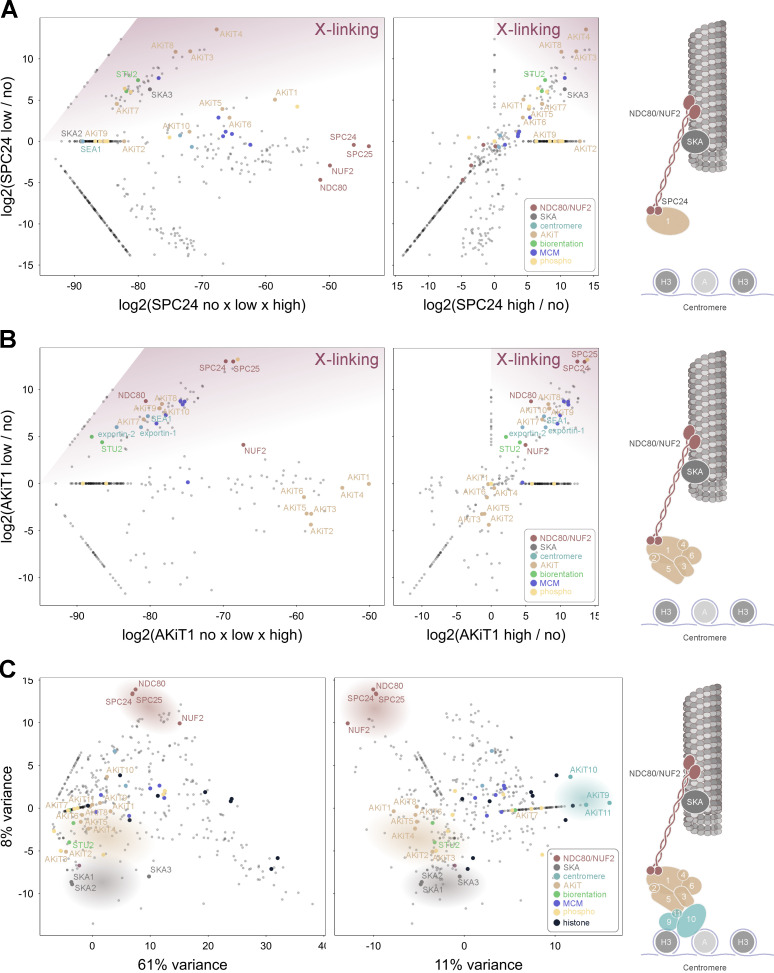
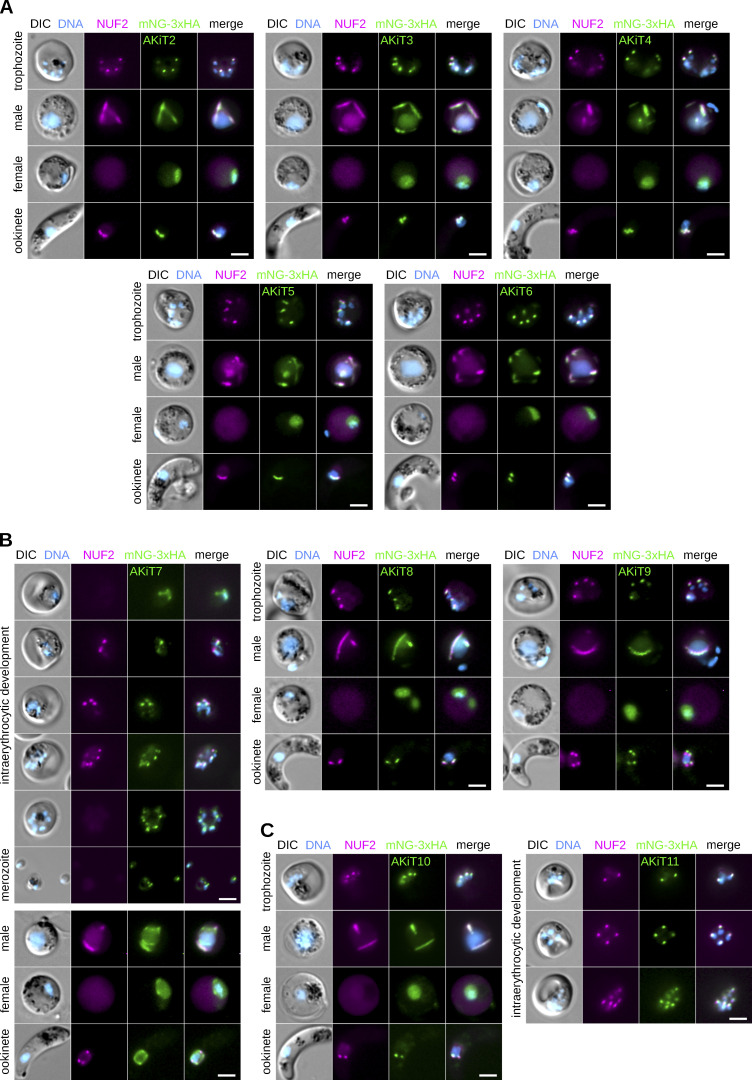
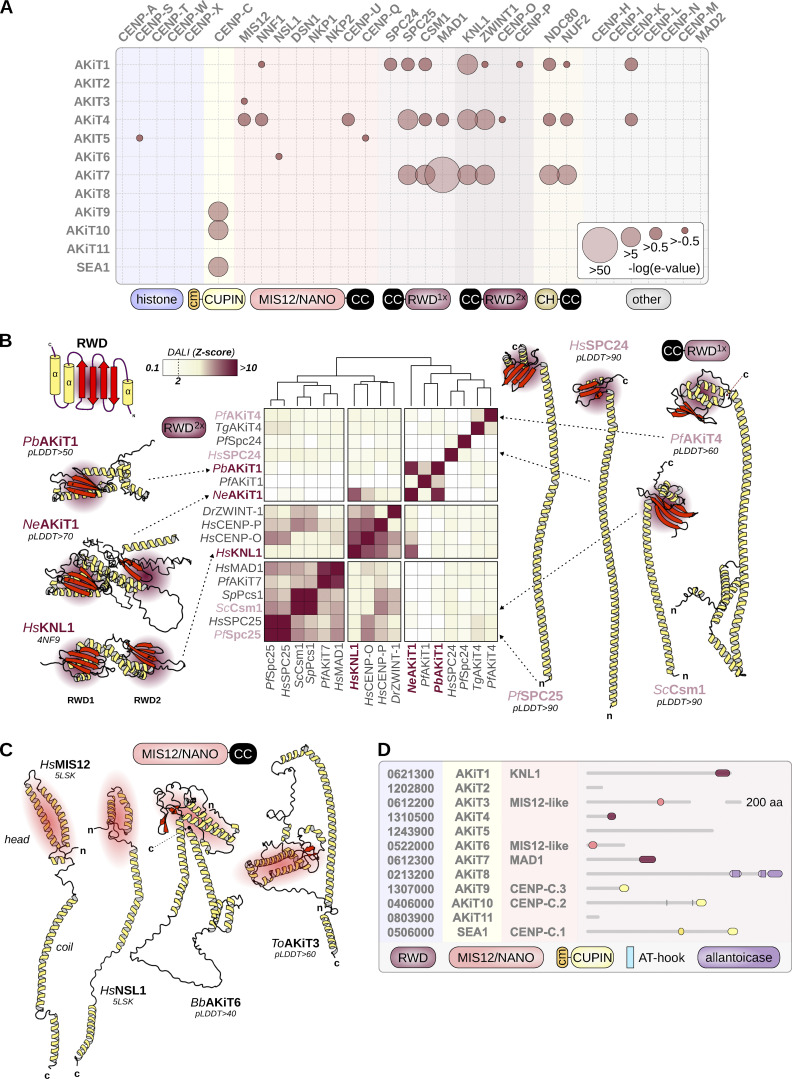
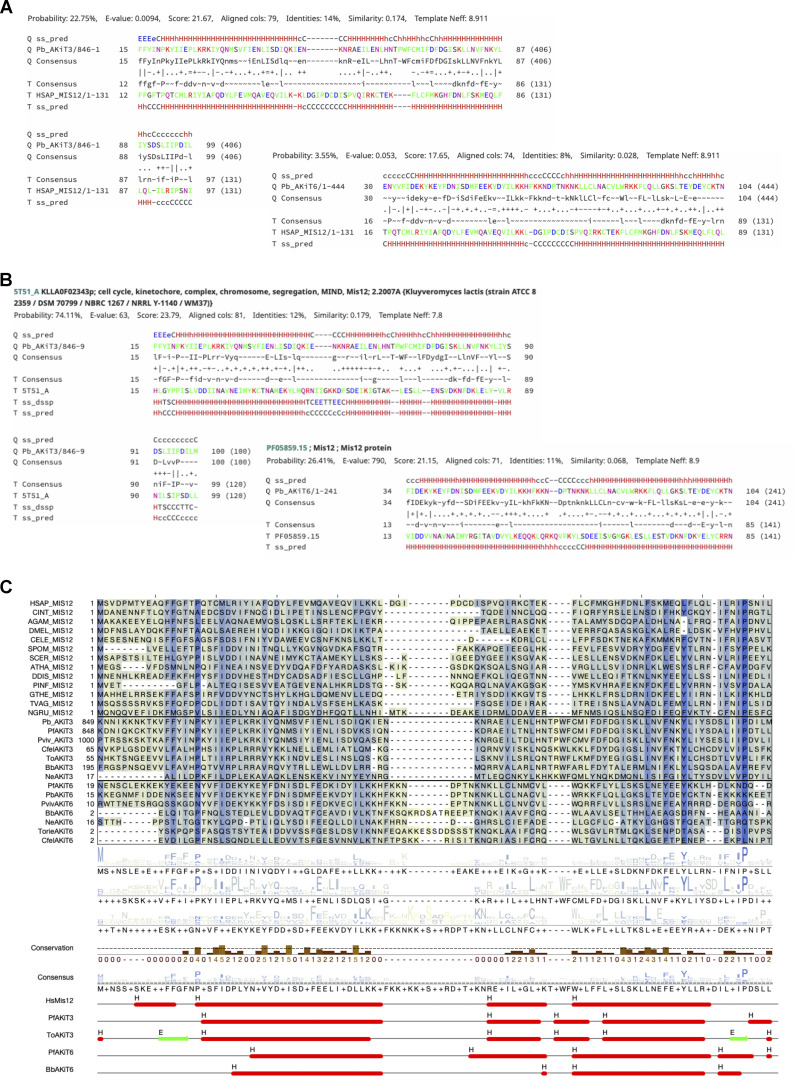
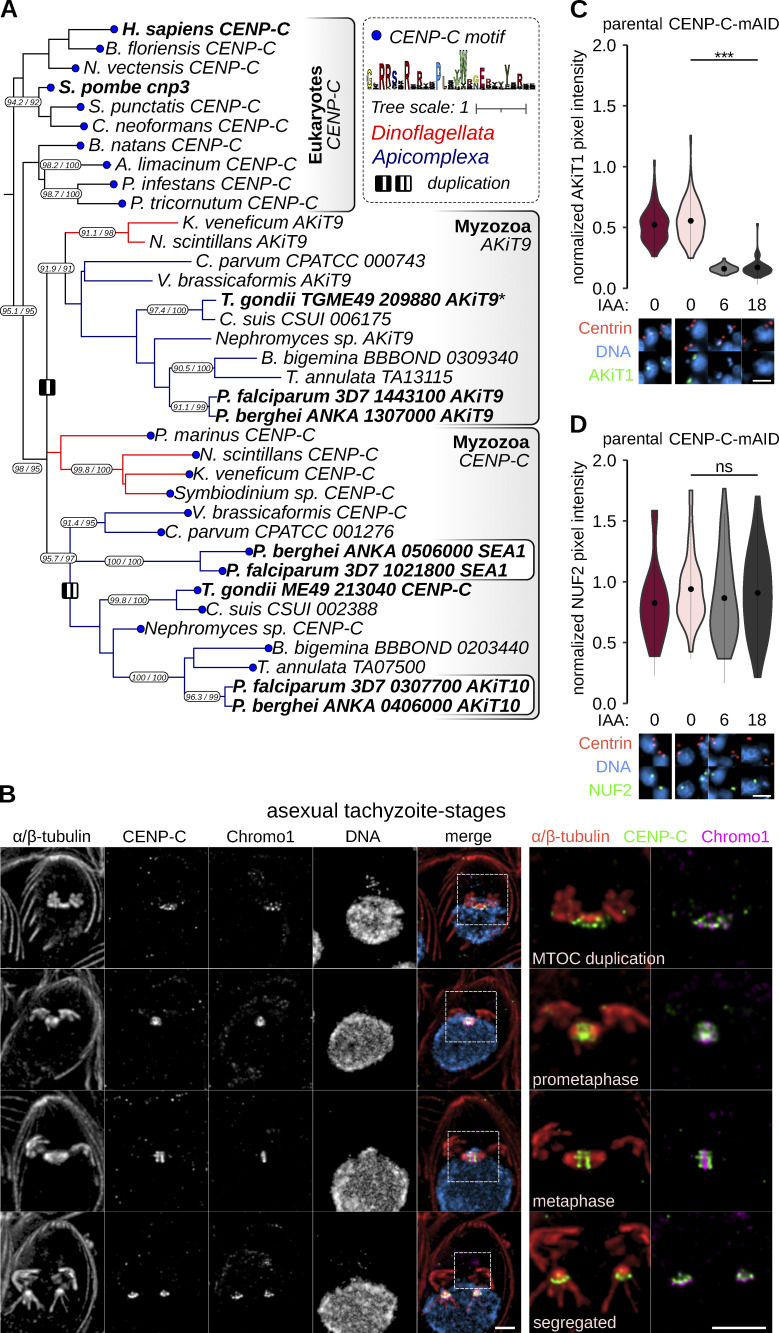
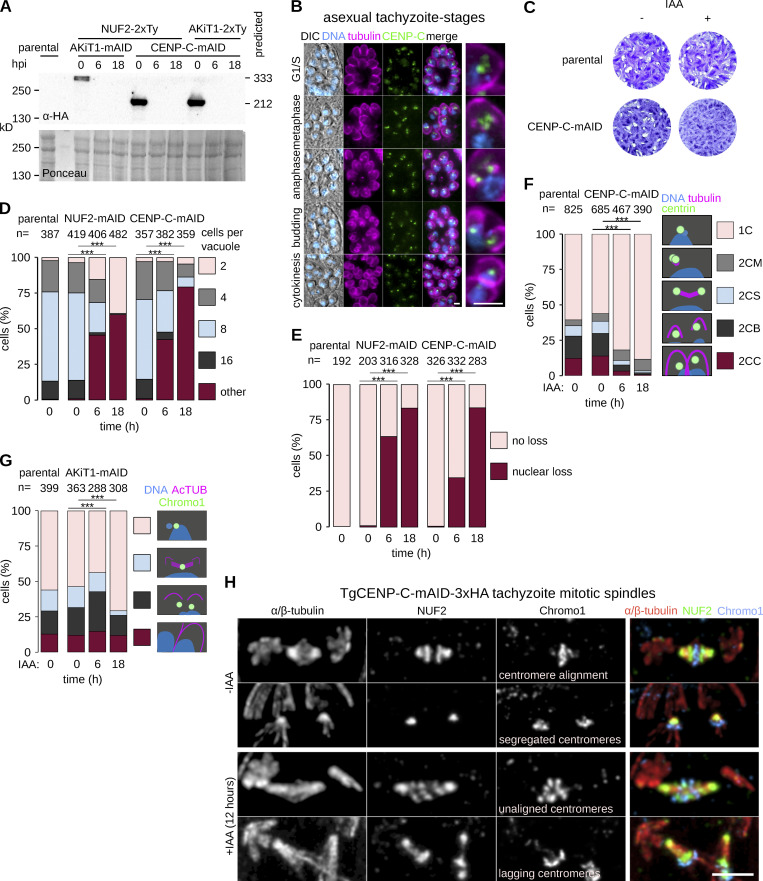
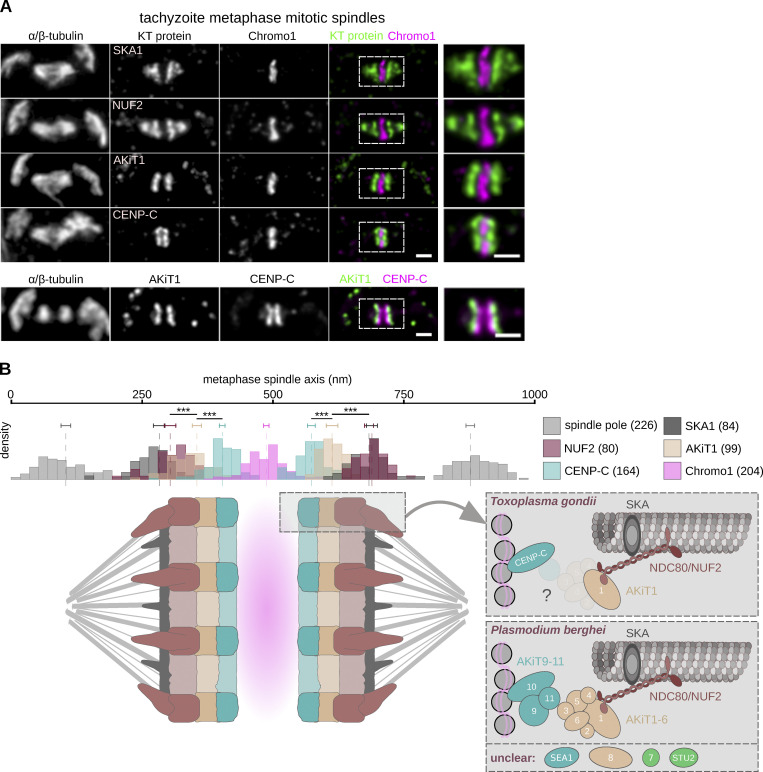
Kinetochores are multiprotein assemblies directing mitotic spindle attachment and chromosome segregation. In apicomplexan parasites, most known kinetochore components and associated regulators are apparently missing, suggesting a minimal structure with limited control over chromosome segregation. In this study, we use interactomics combined with deep homology searches to identify 13 previously unknown components of kinetochores in Apicomplexa. Apicomplexan kinetochores are highly divergent in sequence and composition from animal and fungal models. The nanoscale organization includes at least four discrete compartments, each displaying different biochemical interactions, subkinetochore localizations and evolutionary rates across the phylum. We reveal alignment of kinetochores at the metaphase plate in both Plasmodium berghei and Toxoplasma gondii, suggestive of a conserved "hold signal" that prevents precocious entry into anaphase. Finally, we show unexpected plasticity in kinetochore composition and segregation between apicomplexan lifecycle stages, suggestive of diverse requirements to maintain fidelity of chromosome segregation across parasite modes of division.


Figures

Figure S1.
Figure S1.
Generation and validation of tagged NUF2 and SKA components in P. berghei and T. gondii. (A) Presence/absence (bold/grey) of known kinetochore proteins in P. berghei and T. gondii. (B–E) Immunoblots of malaria parasites expressing SKA proteins tagged with mNeonGreen-3xHA alongside NUF2-mScarlet-I, probed with either polyclonal α-mCherry or monoclonal α-HA antibodies. Protein loading is shown by Ponceau S stain. (F and G) Micrographs of live native fluorescence in malaria parasites expressing tagged NUF2 and SKA2-interacting proteins during asexual blood stages and sexual mosquito stages of development. Counter-staining of DNA with Hoechst 33342 (cyan) and differential interference contrast images are also shown. Scale bar, 2 μm. (H and I) Immunoblots of T. gondii parasites expressing tagged kinetochore proteins and showing depletion of mAID-3xHA tagged protein upon induction of auxin. Protein loading is shown by Ponceau S stain. (J) Micrographs of fixed immunofluorescence in T. gondii tachyzoites expressing SKA3 tagged with a 2xTy epitope throughout intracellular divisions. Counter-staining tubulin (magenta). DNA staining with DAPI (cyan) and differential interference contrast images are also shown. Scale bar, 5 μm. Source data are available for this figure: SourceData FS1.
Figure 1.
Figure 1.
NDC80C and SKA proteins localize to spindle poles and kinetochores in the malaria parasite. (A–C) Micrographs of live native fluorescence in malaria parasites expressing tagged kinetochore components NUF2-mScarlet-I (magenta) and SKA2-mNeonGreen-3xHA (green) during blood-stage (A), mosquito-stage (B), and ookinete (C) development. Counter-staining of DNA with Hoechst 33342 (cyan) and differential interference contrast images are also shown. Scale bar, 2 μm. (D) U-ExM resolved SKA2 at spindle poles (γ-tubulin and NHS-ester), the spindle (α/β-tubulin) and kinetochores (NUF2). Scale bar, 1 μm. (E) Relative enrichment of proteins identified by mass spectrometry following immunoprecipitation of NUF2-3xHA (magenta) and SKA2-3xHA (green). NDC80C and SKA2-interacting proteins highlighted. Intensities of proteins are not detected for either immunoprecipitation set to arbitrary minimum value. (F) Live native fluorescence of blood- and mosquito-stage cells expressing SKA2-interacting proteins tagged with mNG-3xHA.
Figure 2.
Figure 2.
Toxoplasma SKA proteins accumulate at spindle poles and kinetochores at the onset of mitosis. (A and B) HMMs constructed using alveolate homologs of SKA2-interacting proteins identify HMMs including animal SKA proteins as highest scoring hits. (C) Micrographs of fixed immunofluorescence in dividing intracellular T. gondii tachyzoites expressing kinetochore components SKA1-2xTy and SKA2-2xTy. Counter-staining of DNA (cyan), acetylated α-tubulin (magenta), and differential interference contrast images are also shown. Scale bar, 5 μm. (D) Counter-staining (magenta) for the apicoplast (CPN60), centrosome (Centrin1), and kinetochores (NUF2-2xTy) are also shown. (E and F) U-ExM resolved SKA2 at spindle poles and kinetochores (E; α/β-tubulin and NUF2, respectively), concomitant with alignment of centromeres at metaphase (F; TgChromo1). Scale bar, 2 μm.
Figure S2.
Figure S2.
Toxoplasma SKA proteins are required for intracellular growth and lytic plaque formation. (A) Strategy for auxin-induced depletion of T. gondii kinetochore components. (B) Tachyzoites depleted for SKA1–3 failed to form lysis plaques 7 d after inoculation compared to parental controls. (C) Intracellular growth is severely reduced in T. gondii depleted of SKA1 and 2 and NUF2 (**, P < 0.01; ***, P < 0.001; χ2 test). (D and E) Intracellular vacuoles containing accumulations of DNA (arrow) and no associated cell body were present after depletion of SKA1–2 tagged with mAID-3xHA. Scale bar, 5 µm. (F and G) Insertion of mScarlet-I at the C-terminus of MORN1 is detrimental to parasite growth.
Figure 3.
Figure 3.
Toxoplasma SKA proteins are essential for centromere and kinetochore segregation. (A and B) Morphological analyses of cells depleted for SKA1 or SKA2 tagged with mAID-3xHA reveal a buildup of cells with duplicated Centrin1 staining (A) or a single TgChromo1 focus (B) along bipolar or monopolar spindles (**, P < 0.01; ***, P < 0.001; χ2 test). Representative micrographs are shown below. Counter-staining of DNA (cyan), acetylated α-tubulin (magenta), and centrin1 or TgChromo1 (green). Scale bar, 2.5 μm. (C and D) U-ExM revealed tachyzoites with elongated mitotic spindles and unaligned and lagging kinetochores (C) or centromeres (D). Scale bar, 1 µm. (E and F) Levels of NUF2 (E) and SKA1 or SKA2 (F) at kinetochores in cells depleted for either protein. Representative micrographs are shown below. DNA (cyan), centrin1 (tomato), and NUF2, SKA1, or SKA2 (green). Scale bar, 4 μm.
Figure 4.
Figure 4.
AKiT1 is a component of the Plasmodium kinetochore. (A) Relative enrichment of proteins (shaded threshold) identified following immunoprecipitation of NUF2 upon cross-linking compared to non–cross-linked cells. (B and C) Micrographs of blood-stage (B) and mosquito-stage (C) cells expressing NUF2-mScarlet-I (magenta) and AKiT1-mNG-3xHA (green). Scale bar, 2 μm. (D and E) U-ExM identified alignment of tagged AKiT1 and NUF2 kinetochores during blood-stage divisions (D), whilst dispersed along the mitotic spindle during microgametogenesis (E). Scale bar, 1 μm. (F and G) Centroid measurements for head-to-head AKiT1 foci along the microgametocyte spindle (F), and relative to NUF2 and centrin in segregated clusters (G). Total number of foci analyzed, SEM error bars, and representative micrograph shown. Centrin1 (cyan), NUF2 (magenta), and AKiT1 (green). Scale bar, 2 μm.
Figure S3.
Figure S3.
AKiT1 is a component of the Plasmodium kinetochore. (A and B) Widefield images of native fluorescence (A) and U-ExM (B) in malaria parasites expressing NUF2-mScarlet-I (magenta) and AKiT1-mNeonGreen-3xHA (green) during mosquito stages of development. U-ExM revealed AKiT1 along the spindle (identified by α/β-tubulin counter-stain) and at spindle poles (centrin). DNA (cyan) is also shown. Scale bar, 2 μm.
Figure 5.
Figure 5.
AKiT1 is an essential component of the Toxoplasma kinetochore. (A) Micrographs of T. gondii tachyzoites expressing AKiT1-2xTy. DNA (cyan), tubulin (magenta), and differential interference contrast images shown. Scale bar, 5 μm. (B) U-ExM identified alignment of AKiT1 foci at metaphase. Scale bar, 2 μm. (C and D) Depletion of AKiT1-mAID-3xHA delayed mitotic progression, with a buildup of cells with duplicated centrin foci (C) unable to properly partition TgChromo1 (D; **, P < 0.01; ***, P < 0.001; χ2 test). (E and F) U-ExM revealed tachyzoites displaying elongated mitotic spindles, with misaligned and lagging kinetochores (E) and centromeres (F). Scale bar, 1 µm. Levels of NUF2 and AKiT1 in cells depleted for either component. Representative images are also shown.
Figure S4.
Figure S4.
AKiT1 is required for kinetochore segregation in Toxoplasma. (A) Micrographs of fixed immunofluorescence in T. gondii expressing AKiT1-mAID-3xHA throughout intracellular divisions. Counter-staining with antibodies raised against organelle markers (magenta) for the apicoplast (CPN60), centrosome (Centrin1), and kinetochores (NUF2-2xTy). DNA staining with DAPI (cyan) and differential interference contrast images are also shown. Scale bar, 5 μm. (B and C) Immunoblots of T. gondii parasites expressing tagged kinetochore proteins and showing depletion of AKiT1 protein upon induction of auxin. Protein loading is shown by Ponceau S stain. (D) Depletion of AKiT1-mAID-3xHA prevented proper formation of lysis plaques 7 d postinoculation compared to parental controls. (E) Intracellular growth is severely reduced in T. gondii depleted of AKiT1 and NUF2 (***, P < 0.001; χ2 test). (F and G) Intracellular vacuoles containing accumulations of DNA (arrow) and no associated cell body were present after depletion of SKA1–2 tagged with mAID-3xHA. Scale bar, 5 µm. (H and I) Levels and localization of NUF2 and AKiT1 in cells depleted for either component. Representative images are shown below. Scale bar, 4 μm. Source data are available for this figure: SourceData FS4.
Figure S5.
Figure S5.
Relative protein abundance following immunoprecipitation under limited cross-linking and mass spectrometry. (A) General workflow for immunoprecipitation under limited cross-linking and mass spectrometry. (B) Representative plot demonstrating positions of relative protein abundances in main plot (Fig. 6 A). The values in Table S3, as identified under specific formaldehyde (FA) cross-linking conditions no (0%), low (0.1%), and high (1%), are multiplied by (×) or divided by (/) one another, according to the axes, and log2 transformed. For display, intensities not detected under a specific condition are set to the minimum value identified across all experiments (in this instance 2.87 × 10⁻¹⁰). Plotted intensities identified under specific cross-linking conditions are colored according to the key and those identified under combinations of conditions are mix colored, e.g., relative abundances enriched upon cross-linking compared to noncross-linking are displayed in magenta/pink, whereas proteins identified as equally abundant across all conditions are in grey.
Figure 6.
Figure 6.
AKiT1 interacts with additional AKiT components and proteins at the Plasmodium centromere. (A and B) Relative enrichment of proteins immunopurified with SPC24-3xHA (A) and AKiT1-3xHA (B) under conditions of low compared to high and no cross-linking conditions (left), or low compared to high cross-linking (right). (C) Principal components 1–3 of integrated spectral intensities identified following immunopurifications of NUF2, SPC24, AKiT1, AKiT8, AKiT9, SKA2, PBANKA_1343200, NEK1, and KIN8X. Intensities for all 780 proteins detected across experiments are presented in Table S3.
Figure S6.
Figure S6.
Generation of tagged AKiT components in P. berghei. (A) Immunoblots of malaria parasites expressing tagged AKiT proteins, probed with a monoclonal α-HA antibody. Protein loading is shown by Ponceau S stain. (B) PCR on genomic DNA of malaria parasites expressing tagged AKiT10 and 11 alongside parental controls. (C) HMM profile-profile comparisons using domain-only kinetochore HMMs against AKiT orthologs. Source data are available for this figure: SourceData FS6.
Figure 7.
Figure 7.
AKiTs accumulate alongside NUF2 at the nuclear periphery in malaria parasites. (A–C) Micrographs of P. berghei expressing NUF2-mScarlet-I (magenta) and AKiT1–6 (A), AKiT7–9 (B) and AKiT10–11 (C) tagged with mNG-3xHA (green). Scale bar, 2 μm.
Figure 8.
Figure 8.
Apicomplexan kinetochores include distant relatives of eukaryotic kinetochore and spindle assembly checkpoint proteins. (A) HMM profile-profile comparisons using full-length conventional kinetochore HMMs (Tromer et al., 2019) and alveolate homologs of AKiT proteins. E-values are binned to indicate the confidence of detection. (B) Structural comparisons of the RWD domains of cKiTs and AKiTs (AF2-predicted structures) using DALI. Z-scores are clustered using Ward’s method of minimum variance clustering. For previously resolved structures, a PDB code is shown and for AF2 the average pLDDT confidence score shown. Two letters indicate species (Table S1). (C) Resolved structures for HsMIS12 and HsNSL1 and AF2-predicted structures for ToAKiT3 and BbAKiT6, the latter two chosen due to their shorter length than Plasmodium orthologs. (D) Predicted protein domain architectures for AKiT1–11.
Figure S7.
Figure S7.
AKiT3 and AKiT6 bear similarity of the head domain of MIS12. (A and B) HMM profile-profile alignment of AKiT3 and 6 with MIS12 by (A) HHpred, and against (B) the Pfam/ECOD and PDB database. (C) Alignment of head domains predicted by AF2 and profile-profile comparisons (see A and B) of AKiT3 and 6 with MIS12.
Figure S8.
Figure S8.
The T. gondii gene TGME49_209880 is incorrectly predicted and harbors a bona fide AKiT9 at its C-terminus. Multiple sequence alignment showing TGME49_209880 where only the C-terminus aligns with coccidian AKiT9 orthologs, which are much shorter in length.
Figure 9.
Figure 9.
AKiT1 localization to kinetochores is dependent upon CENP-C in Toxoplasma. (A) Pruned tree of a maximum likelihood inference based on an alignment of cupin domains retrieved following iterative HMM searches for myzozoa and eukaryotic homologs of CENP-C. Duplications within the myzozoan CENP-C clade are indicated by I (AKiT9-CENP-C) and II (AKiT10-SEA1). Terminal blue nodes indicate sequences harboring a known CENP-A binding motif. Numbers on branches indicate rapid bootstrap and Shimodaira–Hasegawa-aLRT support (1,000 replicates). Full tree can be found in Data S3. (B) U-ExM of T. gondii tachyzoites expressing TgCENP-C fused to mAID-3xHA (green) throughout intracellular divisions. Counter-staining of DNA (cyan), TgChromo1 (magenta). Scale bar, 1 μm. (C and D) Levels and localization of NUF2 and AKiT1 postdepletion of CENP-C. Representative images are shown below. DNA (cyan), Centrin1 (tomato), and AKiT1 or NUF2 (green). Scale bar, 4 μm.
Figure S9.
Figure S9.
CENP-C is required for T. gondii proliferation. (A) Immunoblots of T. gondii parasites expressing tagged AKiT1 and CENP-C. (B) Micrographs of fixed immunofluorescence in T. gondii tachyzoites throughout intracellular divisions. Tubulin (magenta), DNA (cyan), and differential interference contrast images are also shown. Scale bar, 5 μm. (C) Tachyzoites depleted for CENP-C failed to form lysis plaques 7 d after inoculation compared to parental controls. (D) Intracellular growth is severely reduced in T. gondii depleted of CENP-C and NUF2 (***, P < 0.001; χ2 test). (E) Intracellular vacuoles containing accumulations of DNA and no associated cell body were present after depletion of CENP-C. (F and G) Morphological analyses to assess the effect of CENP-C depletion on partitioning of the centrosome (F) or centromeres (G; ***, P < 0.001; χ2 test). (H) U-ExM revealed cells with misaligned and lagging centromeres along elongated mitotic spindles postdepletion of CENP-C. Source data are available for this figure: SourceData FS9.
Figure 10.
Figure 10.
AKiTs localize to discrete sub-kinetochore compartments along the metaphase spindle. (A) U-ExM of T. gondii tachyzoite cells expressing either of tagged SKA1, NUF2, AKiT1, and CENP-C (green) alongside staining for TgChromo1 (magenta). (B) Centroid measurements along the metaphase spindle axis. In brackets are the number of centroids measured. Dotted lines show the mean relative positions and error bars show the SEM (***, P < 0.001). (C) Models for T. gondii and P. berghei metaphase kinetochores (Note SKA is not detected during microgametogenesis in P. berghei).

Similar articles

Cited by

References

    1. Aikawa, M. 1966. The fine structure of the erythrocytic stages of three avian malarial parasites, Plasmodium fallax, P. lophurae, and P. cathemerium. Am. J. Trop. Med. Hyg. 15:449–471. 10.4269/ajtmh.1966.15.449 - DOI - PubMed
    1. Akiyoshi, B., and Gull K.. 2014. Discovery of unconventional kinetochores in kinetoplastids. Cell. 156:1247–1258. 10.1016/j.cell.2014.01.049 - DOI - PMC - PubMed
    1. Alvarez, C.A., and Suvorova E.S.. 2017. Checkpoints of apicomplexan cell division identified in Toxoplasma gondii. PLoS Pathog. 13:e1006483. 10.1371/journal.ppat.1006483 - DOI - PMC - PubMed
    1. Arnot, D.E., and Gull K.. 1998. The Plasmodium cell-cycle: Facts and questions. Ann. Trop. Med. Parasitol. 92:361–365. 10.1080/00034989859357 - DOI - PubMed
    1. Arnot, D.E., Ronander E., and Bengtsson D.C.. 2011. The progression of the intra-erythrocytic cell cycle of Plasmodium falciparum and the role of the centriolar plaques in asynchronous mitotic division during schizogony. Int. J. Parasitol. 41:71–80. 10.1016/j.ijpara.2010.07.012 - DOI - PubMed

Publication types