

C-Reactive Protein-to-Albumin Ratio and Clinical Outcomes in COVID-19 Patients: A Systematic Review and Meta-Analysis
- PMID: 36006278
- PMCID: PMC9414550
- DOI: 10.3390/tropicalmed7080186
C-Reactive Protein-to-Albumin Ratio and Clinical Outcomes in COVID-19 Patients: A Systematic Review and Meta-Analysis
Abstract
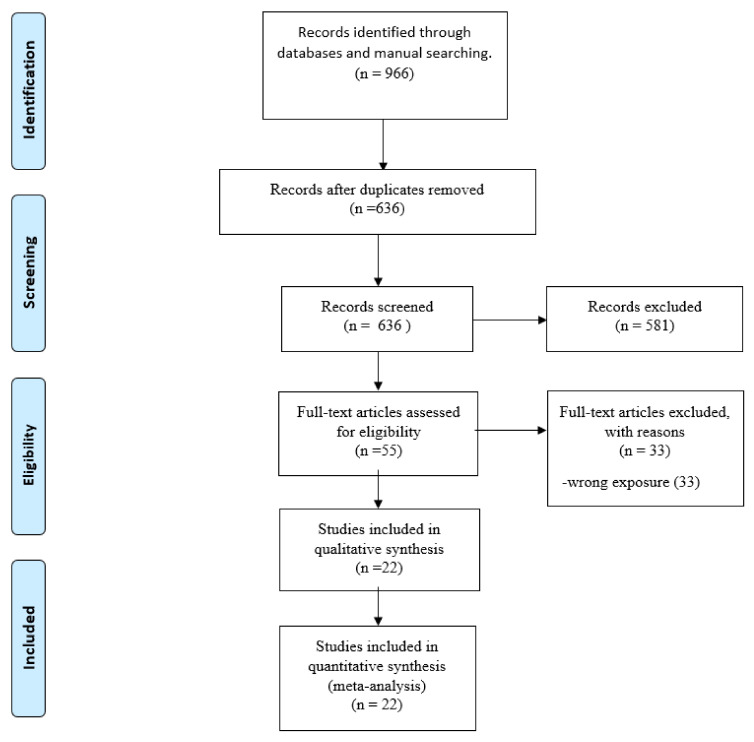
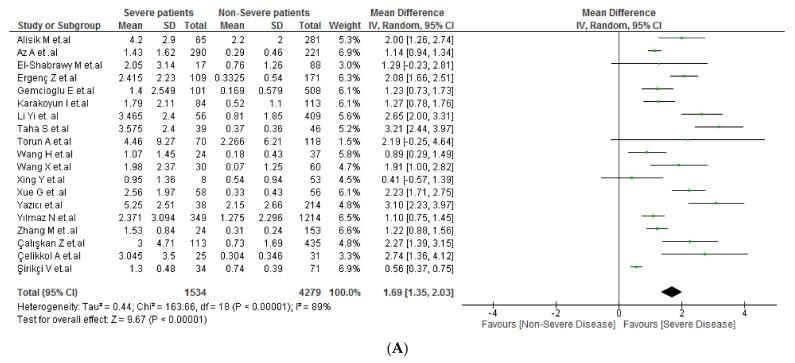
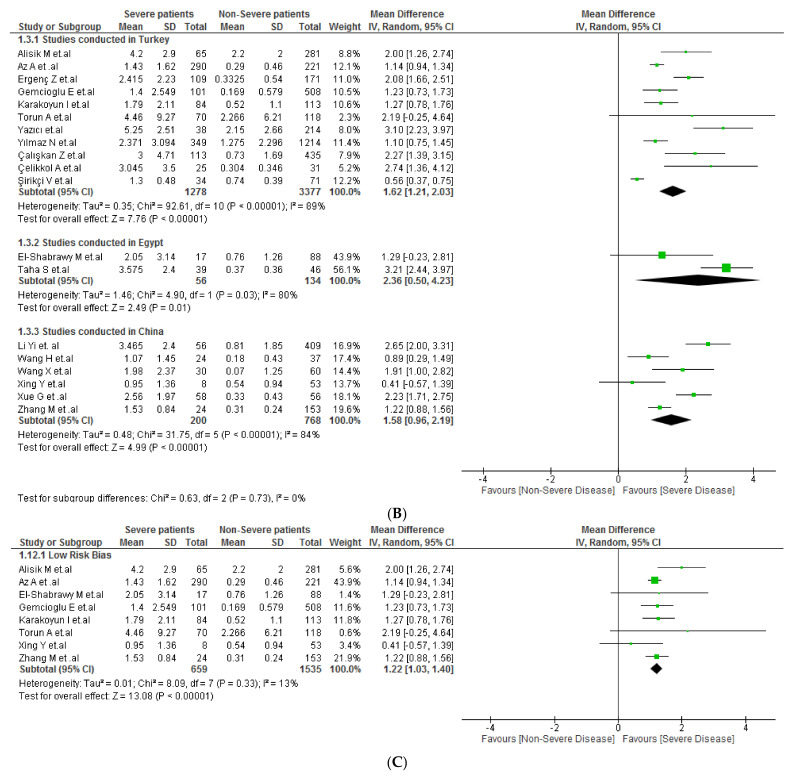
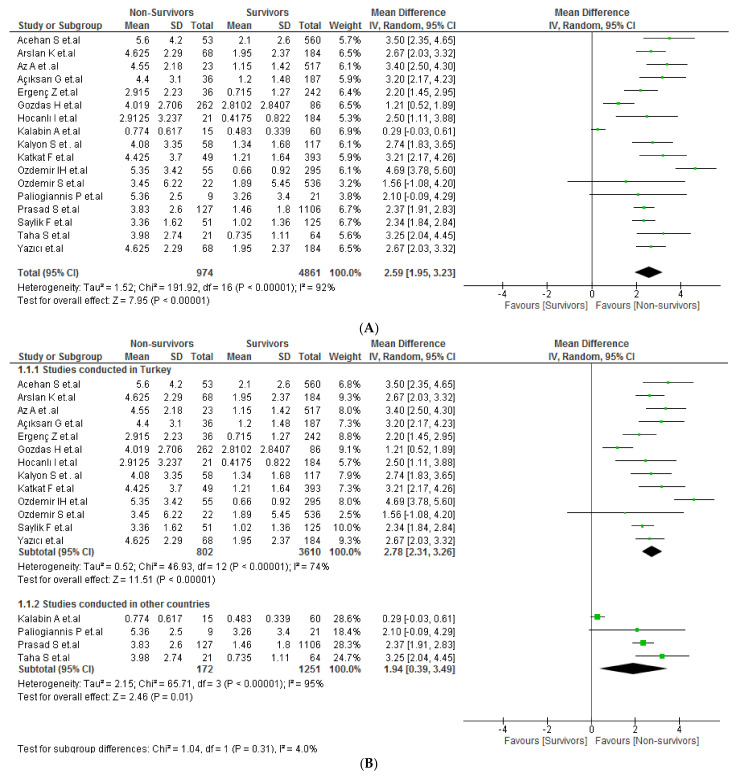
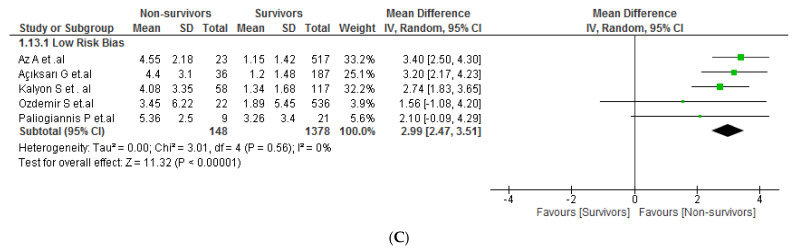
C-reactive protein-to-albumin ratio (CAR) is an independent risk factor in cardiovascular, cerebrovascular, and infectious diseases. Through this study, we investigated the CAR values with respect to the severity and mortality of COVID-19 patients. We performed a systematic review and meta-analysis to retrieve studies that evaluated CAR values upon hospital admission in relation to the severity or mortality of COVID-19 patients. We adopted a random-effect model to calculate the pooled mean difference (MD) and their 95% confidence intervals (CI). Quality assessment was appraised using a Newcastle−Ottawa scale and publication bias was assessed using the Begg-test and funnel plot. We equally performed a subgroup analysis using study location and a sensitivity analysis only with studies with low risk of bias. We analyzed 32 studies (n = 12445). Severe COVID-19 patients had higher on-admission CAR values than non-severe COVID-19 patients (MD: 1.69; 95% CI: 1.35−2.03; p < 0.001; I2 = 89%). Non-survivor patients with COVID-19 had higher CAR values than survivor patients (MD: 2.59; 95% CI: 1.95−3.23; p < 0.001; I2 = 92%). In sensitivity analysis, the relationship remained with a decreasing of heterogeneity for severity (MD: 1.22; 95% CI: 1.03−1.40; p < 0.001; I2 = 13%) and for mortality (MD: 2.99; 95% CI: 2.47−3.51; p < 0.001; I2 = 0%). High CAR values were found in COVID-19 patients who developed severe disease or died.
Keywords: C-reactive protein; COVID-19; albumin; meta-analysis.
Conflict of interest statement
The authors declare no conflict of interest.
Figures
Similar articles
-
Prognostic value of albumin-to-globulin ratio in COVID-19 patients: A systematic review and meta-analysis.Heliyon. 2022 May 18;8(5):e09457. doi: 10.1016/j.heliyon.2022.e09457. eCollection 2022 May. Heliyon. 2022. PMID: 35601226 Free PMC article. Review.
-
Extracorporeal membrane oxygenation (ECMO) in patients with severe COVID-19 adult respiratory distress syndrome: a systematic review and meta-analysis.Cardiothorac Surg. 2021;29(1):9. doi: 10.1186/s43057-021-00046-3. Epub 2021 Apr 12. Cardiothorac Surg. 2021. PMID: 38624751 Free PMC article. Review.
-
Variation in outcome of invasive mechanical ventilation between different countries for patients with severe COVID-19: A systematic review and meta-analysis.PLoS One. 2021 Jun 4;16(6):e0252760. doi: 10.1371/journal.pone.0252760. eCollection 2021. PLoS One. 2021. PMID: 34086779 Free PMC article.
-
Fibrinogen-to-Albumin Ratio and Blood Urea Nitrogen-to-Albumin Ratio in COVID-19 Patients: A Systematic Review and Meta-Analysis.Trop Med Infect Dis. 2022 Jul 27;7(8):150. doi: 10.3390/tropicalmed7080150. Trop Med Infect Dis. 2022. PMID: 36006242 Free PMC article. Review.
-
Serum Complement C3 and C4 and COVID-19 Severity and Mortality: A Systematic Review and Meta-Analysis With Meta-Regression.Front Immunol. 2021 Jun 7;12:696085. doi: 10.3389/fimmu.2021.696085. eCollection 2021. Front Immunol. 2021. PMID: 34163491 Free PMC article.
Cited by
-
Presepsin as a prognostic biomarker in COVID-19 patients: combining clinical scoring systems and laboratory inflammatory markers for outcome prediction.Virol J. 2024 Apr 26;21(1):96. doi: 10.1186/s12985-024-02367-1. Virol J. 2024. PMID: 38671532 Free PMC article.
-
Prognostic Value of D-dimer to Lymphocyte Ratio (DLR) in Hospitalized Coronavirus Disease 2019 (COVID-19) Patients: A Validation Study in a National Cohort.Viruses. 2024 Feb 22;16(3):335. doi: 10.3390/v16030335. Viruses. 2024. PMID: 38543700 Free PMC article.
-
Nomogram-based prediction model for survival of COVID-19 patients: A clinical study.Heliyon. 2023 Sep 14;9(9):e20137. doi: 10.1016/j.heliyon.2023.e20137. eCollection 2023 Sep. Heliyon. 2023. PMID: 37809383 Free PMC article.
-
Evaluation of serum neopterin levels in severe COVID-19 patients: An observational study.Medicine (Baltimore). 2024 Jul 26;103(30):e38996. doi: 10.1097/MD.0000000000038996. Medicine (Baltimore). 2024. PMID: 39058886 Free PMC article.
-
Blood-urea-nitrogen-to-serum-albumin ratio in predicting the value of patients with contrast-induced nephropathy for coronary heart disease.Int Urol Nephrol. 2024 Jun;56(6):2075-2083. doi: 10.1007/s11255-023-03915-4. Epub 2024 Jan 28. Int Urol Nephrol. 2024. PMID: 38281310
References
-
- Bonilla-Aldana D.K., Quintero-Rada K., Montoya-Posada J.P., Ramírez-Ocampo S., Paniz-Mondolfi A., Rabaan A.A., Sah R., Rodríguez-Morales A.J. SARS-CoV, MERS-CoV and Now the 2019-Novel CoV: Have We Investigated Enough about Coronaviruses?—A Bibliometric Analysis. Travel Med. Infect. Dis. 2020;33:101566. doi: 10.1016/j.tmaid.2020.101566. - DOI - PMC - PubMed
-
- WHO Coronavirus (COVID-19) Dashboard | WHO Coronavirus (COVID-19) Dashboard with Vaccination Data. [(accessed on 13 November 2021)]; Available online: https://covid19.who.int/
-
- Ray D., Salvatore M., Bhattacharyya R., Wang L., Du J., Mohammed S., Purkayastha S., Halder A., Rix A., Barker D., et al. Predictions, Role of Interventions and Effects of a Historic National Lockdown in India’s Response to the COVID-19 Pandemic: Data Science Call to Arms. Harv. Data Sci. Rev. 2020 doi: 10.1162/99608F92.60E08ED5. - DOI - PMC - PubMed
Publication types
LinkOut - more resources
Full Text Sources
Research Materials
