. 2022 Oct;240(10):2647-2657.
doi: 10.1007/s00221-022-06440-5. Epub 2022 Aug 25.

Postural support requirements preferentially modulate late components of the gastrocnemius response to transcranial magnetic stimulation

Affiliations

Postural support requirements preferentially modulate late components of the gastrocnemius response to transcranial magnetic stimulation

Cassandra Russell et al. Exp Brain Res. 2022 Oct.

Abstract

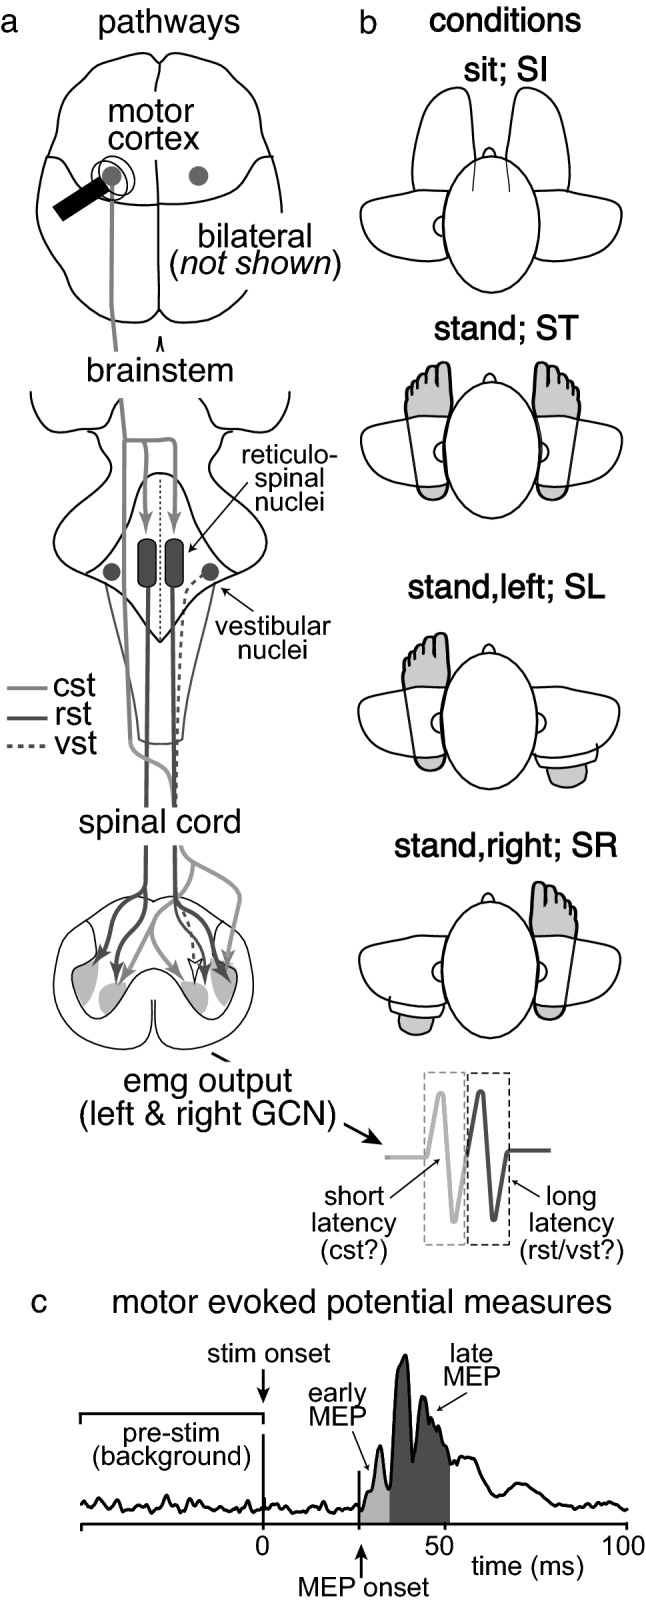
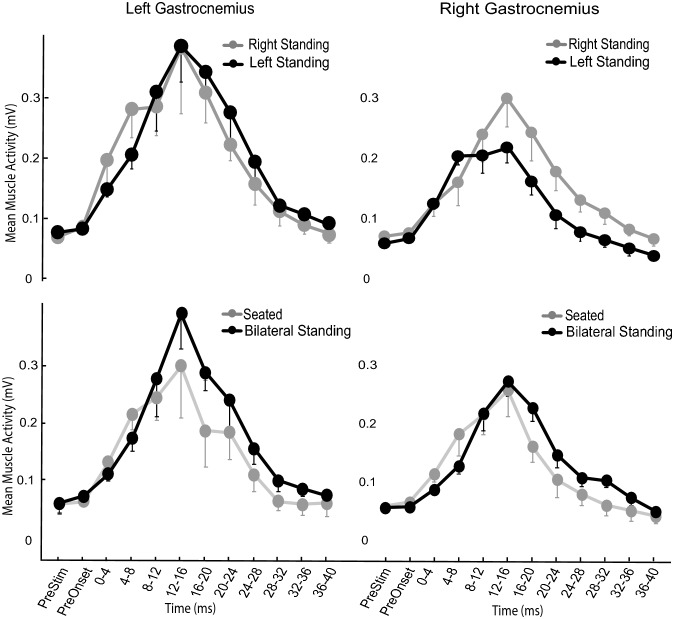
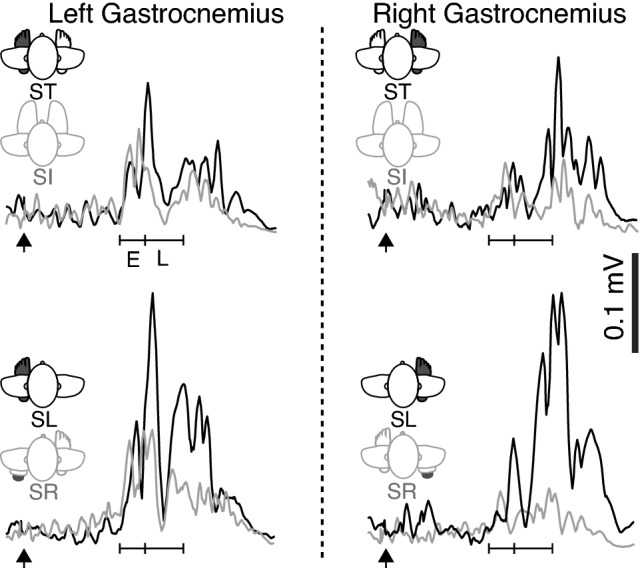
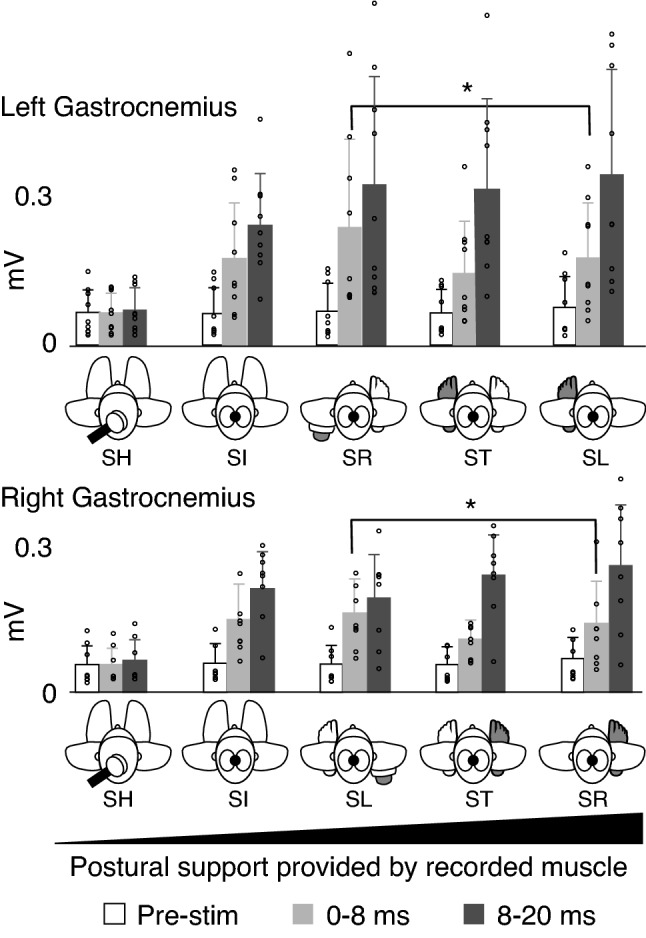
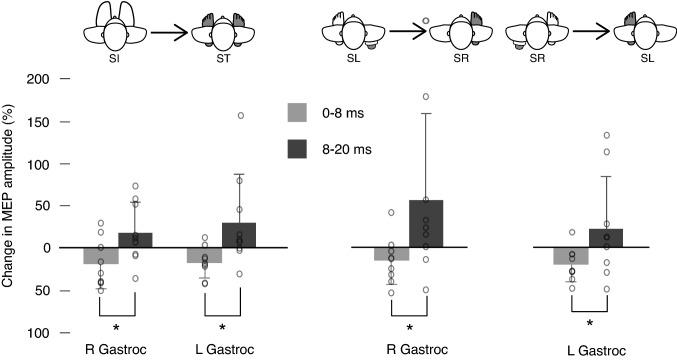
Mounting evidence suggests that motor evoked potentials (MEPs) recorded in upper limb muscles with postural support roles following transcranial magnetic stimulation receive contributions from both corticospinal and non-corticospinal descending pathways. We tested the hypothesis that neural structures responsible for regulating upright balance are involved in transmitting late portions of TMS-induced MEPs in a lower limb muscle. MEPs were recorded in the medial gastrocnemius muscles of each leg, while participants supported their upright posture in five postural conditions that required different levels of support from the target muscles. We observed that early and late portions of the MEP were modulated independently, with early MEP amplitude being reduced when high levels of postural support were required from a target muscle. Independent modulation of early and late MEPs by altered postural demand suggests largely separable transmission of each part of the MEP. The early component of the MEP is likely generated by fast-conducting corticospinal pathways, whereas the later component may be primarily transmitted along a polysynaptic cortico-reticulospinal pathway.

Keywords: Balance control; Brainstem; Cortico-reticulospinal; Corticospinal; Posture; Reticular formation; Triceps surae.


Conflict of interest statement

None to declare.

Figures

Fig. 1
Fig. 1
A Diagram showing the point of cortical stimulation and the descending motor pathways along which excitatory volleys may be transmitted following TMS. These include the corticospinal tract (cst), the reticulospinal tract (rst) and the vestibulospinal tract (vst). B Four major experimental conditions in which TMS was applied (excluding sham stimulation) with the foot providing postural support in each condition shaded. C Example of an MEP in the medial gastrocnemius following TMS (stim onset). Average EMG levels was calculated within a pre-stimulation window as well as the early (shaded light grey) and late (shaded dark grey) MEP
Fig. 2
Fig. 2
Mean muscle activity of all participants across the duration of the MEP, separated into averaged 4 ms bins. The left top and bottom panels indicate the activity in the left gastrocnemius muscle, while the right top and bottom panels indicate the activity in the right gastrocnemius across the various conditions. Error bars indicate standard deviation
Fig. 3
Fig. 3
Rectified data from a single participant, each line reflecting the mean of ten trials in each condition. The left side of the figure illustrates MEPs from the left gastrocnemius, comparing Sit (SI) (grey) and Stand (ST) (black) conditions (upper panel) and Stand Left (SL) (grey) and Stand Right (black) (SR) conditions (lower panel). The right side of the figure illustrates MEPs recorded from the right gastrocnemius in the same conditions: Sit (SI) (grey) and Stand (ST) (black) conditions in the upper panel and Stand Left (SL) (grey) and Stand Right (SR) (black) conditions in the lower panel. The time of TMS application is indicated by an arrow in each panel. The time scale depicts the duration of the response classified as either early (E) or late (L) MEP, while the vertical scale is shown by the annotated thick line and indicated millivolts (mV)
Fig. 4
Fig. 4
Mean (+ SD) EMG within pre-stim (white) and early (light grey) and late (dark grey) MEP windows in the left (upper panel) and right (lower panel) gastrocnemius muscles. For each muscle, the experimental conditions are ordered from the least to the most posturally demanding conditions; sham (SH), sit (SI) and then stand right (SR) or stand left (SL) depending on the leg that is not providing support, followed by stand (ST), and then stand right (SR) or stand left (SL) depending on the leg providing support. Individual data points for each condition are displayed as open circles on the respective condition. The asterix indicates significance (p < 0.05)
Fig. 5
Fig. 5
Percentage changes in early (light grey) and late (dark grey) MEP components of the motor evoked potential response from conditions of lower to greater postural demand (mean ± SD). The left panel of results shows the change from sit (SI) to stand (ST), first in the right gastroc and then in the left. The right panel of results shows the change first in the right gastroc when it goes from a position of no postural demand to single leg support, that is from stand left (SL) to stand right (SR). Then the change in the left gastroc from a stand right (SR) condition to a stand left (SL) condition is shown. Individual data points for each condition are displayed as open circles on the respective condition. The asterix indicates significance (p < 0.05)
Fig. 6
Fig. 6
Correlation between the percentage change in the early (light grey circles) and late (dark grey circles) MEP. Each data point represents the change in MEP amplitude for a participant between either Sit and Stand or between unipedal stance conditions. As indicated by the inset waveforms, data within quadrants 1 and 4 represent changes of opposite polarity in the early and late MEP. Data within quadrants 2–3 represent changes of early and late MEP amplitude that are in the same direction. A linear regression line (dotted line) fit to the data is shown with Adj R2 value

Similar articles

Cited by

References

    1. Barker AT, Jalinous R, Freeston IL. Non-invasive magnetic stimulation of human motor cortex. The Lancet. 1985;325:1106–1107. doi: 10.1016/S0140-6736(85)92413-4. - DOI - PubMed
    1. Baudry S, Collignon S, Duchateau J. Influence of age and posture on spinal and corticospinal excitability. Exp Gerontol. 2015;69:62–69. doi: 10.1016/j.exger.2015.06.006. - DOI - PubMed
    1. Beer RF, Ellis MD, Holubar BG, Dewald JPA. Impact of gravity loading on post-stroke reaching and its relationship to weakness. Muscle Nerve. 2007;36:242–250. doi: 10.1002/mus.20817. - DOI - PMC - PubMed
    1. Brum M, Cabib C, Valls-Solé J. Clinical value of the assessment of changes in MEP duration with voluntary contraction. Front Neurosci. 2016 doi: 10.3389/fnins.2015.00505. - DOI - PMC - PubMed
    1. MacKinnon CD, Quartarone A, Rothwell JC. Inter-hemispheric asymmetry of ipsilateral corticofugal projections to proximal muscles in humans. Exp Brain Res. 2004;157(2):225–233. doi: 10.1007/s00221-004-1836-y. - DOI - PubMed

LinkOut - more resources