

GFAP and NfL increase during neurotoxicity from high baseline levels in pediatric CD19-CAR T-cell patients
- PMID: 36006611
- PMCID: PMC10036503
- DOI: 10.1182/bloodadvances.2022008119
GFAP and NfL increase during neurotoxicity from high baseline levels in pediatric CD19-CAR T-cell patients
Abstract
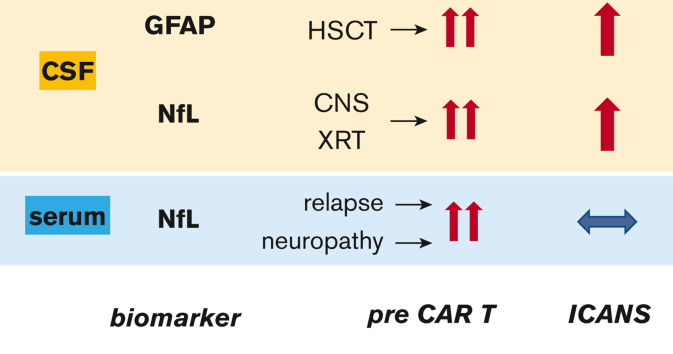
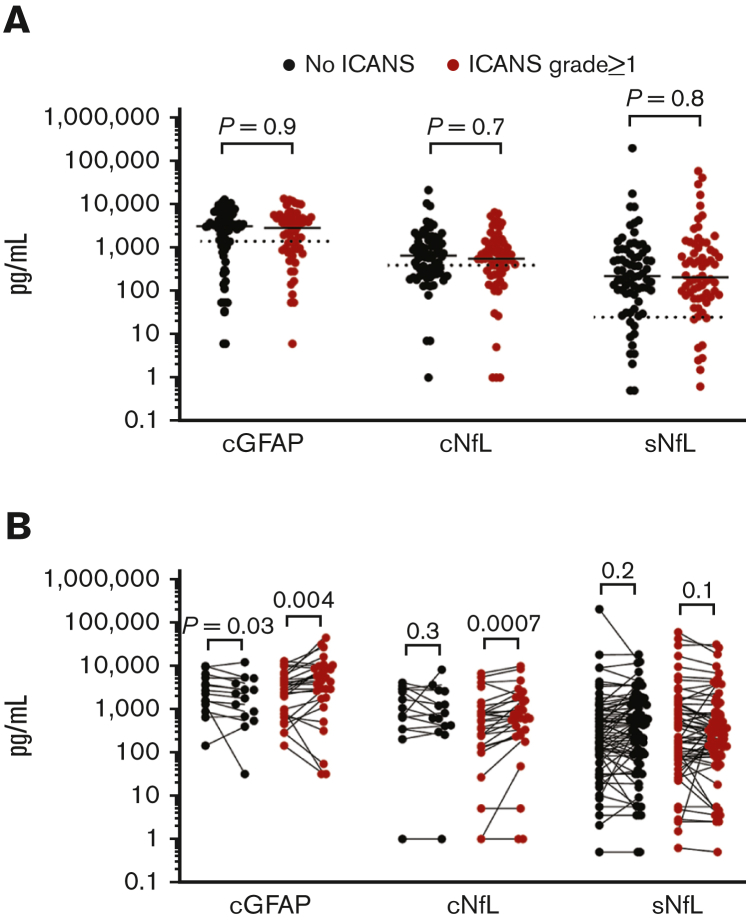
There is a need for biomarkers to predict and measure the severity of immune effector cell-associated neurotoxicity syndrome (ICANS). Glial fibrillary acidic protein (GFAP) and neurofilament light chain (NfL) are well-validated biomarkers of astroglial and neuronal injury, respectively. We hypothesized that pretreatment GFAP and NfL levels can predict the risk of subsequent ICANS and that increases in GFAP and NfL levels during treatment reflect ICANS severity. We measured cerebrospinal fluid GFAP (cGFAP) and NfL (cNfL) along with serum NfL (sNfL) levels at pretreatment and day 7 to 10 after chimeric antigen receptor (CAR) T-cell infusion in 3 pediatric cohorts treated with CD19- or CD19/CD22-directed CAR T cells. cGFAP and cNfL levels increased during grade ≥1 ICANS in patients treated with CD19-directed CAR T cells but not in those who received CD19/CD22-directed CAR T cells. The sNfL levels did not increase during ICANS. Prelymphodepletion cGFAP, cNfL, and sNfL levels were not predictive of subsequent ICANS. Elevated baseline cGFAP levels were associated with a history of transplantation. Patients with prior central nervous system (CNS) radiation had higher cNfL levels, and elevated baseline sNfL levels were associated with a history of peripheral neuropathy. Thus, cGFAP and cNfL may be useful biomarkers for measuring the severity of CNS injury during ICANS in children. Elevated baseline levels of cGFAP, cNfL, and sNfL likely reflect the cumulative injury to the central and peripheral nervous systems from prior treatment. However, levels of any of the 3 biomarkers before CAR T-cell infusion did not predict the risk of ICANS.
© 2023 by The American Society of Hematology. Licensed under Creative Commons Attribution-NonCommercial-NoDerivatives 4.0 International (CC BY-NC-ND 4.0), permitting only noncommercial, nonderivative use with attribution. All other rights reserved.
Conflict of interest statement
Conflict-of-interest disclosure: J.G. has served as a consultant for Johnson & Johnson. R.A.G. serves on a study steering committee for and is an inventor on patents licensed to Juno Therapeutics, a Bristol Myers Squibb company, and has served on advisory boards for Novartis. The remaining authors declare no competing financial interests.
Figures
References
-
- Abdelhak A, Foschi M, Abu-Rumeileh S, et al. Blood GFAP as an emerging biomarker in brain and spinal cord disorders. Nat Rev Neurol. 2022;18(3):158–172. - PubMed
-
- Abbott NJ, Rönnbäck L, Hansson E. Astrocyte–endothelial interactions at the blood–brain barrier. Nat Rev Neurosci. 2006;7(1):41–53. - PubMed
Publication types
MeSH terms
Substances
Grants and funding
LinkOut - more resources
Full Text Sources
Miscellaneous
