. 2022 Oct 10;7(19):e162939.
doi: 10.1172/jci.insight.162939.

In vivo base editing by a single i.v. vector injection for treatment of hemoglobinopathies

Affiliations

In vivo base editing by a single i.v. vector injection for treatment of hemoglobinopathies

Chang Li et al. JCI Insight. .

Abstract

Individuals with β-thalassemia or sickle cell disease and hereditary persistence of fetal hemoglobin (HPFH) possessing 30% fetal hemoglobin (HbF) appear to be symptom free. Here, we used a nonintegrating HDAd5/35++ vector expressing a highly efficient and accurate version of an adenine base editor (ABE8e) to install, in vivo, a -113 A>G HPFH mutation in the γ-globin promoters in healthy CD46/β-YAC mice carrying the human β-globin locus. Our in vivo hematopoietic stem cell (HSC) editing/selection strategy involves only s.c. and i.v. injections and does not require myeloablation and HSC transplantation. In vivo HSC base editing in CD46/β-YAC mice resulted in > 60% -113 A>G conversion, with 30% γ-globin of β-globin expressed in 70% of erythrocytes. Importantly, no off-target editing at sites predicted by CIRCLE-Seq or in silico was detected. Furthermore, no critical alterations in the transcriptome of in vivo edited mice were found by RNA-Seq. In vitro, in HSCs from β-thalassemia and patients with sickle cell disease, transduction with the base editor vector mediated efficient -113 A>G conversion and reactivation of γ-globin expression with subsequent phenotypic correction of erythroid cells. Because our in vivo base editing strategy is safe and technically simple, it has the potential for clinical application in developing countries where hemoglobinopathies are prevalent.

Keywords: Gene therapy; Hematology; Hematopoietic stem cells; Monogenic diseases; Stem cells.


Conflict of interest statement

Conflict of interest: HPK is a paid advisor for Ensoma Bio.

Figures

Figure 1
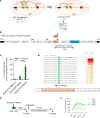
Figure 1. In vitro studies with HDAd-ABE8e vectors in CD34+ cells from healthy donors.
(A) Reactivation of γ-globin by HBG1/2 base editor. In adult erythroid cells, expression of γ-globin is inhibited by a number of repressor proteins, including BCL11A, which binds within the promoter of the 2 copies of the HBG gene (HBG1/Gγ and HBG2/Aγ). This directs the action of the strong β-globin locus control region (LCR) toward expression of β-globin. LCR activity can be switched back to the γ-globin by targeting the BCL11A binding motif using an adenine base editor (31). Expected outcomes of editing the –118 to –113 TGACCA BCL11A binding motif by ABE8e are shown on the bottom. In addition to the target –113 A>G conversion, bystander editing of neighboring adenines was observed. The –116 A>G conversion would further destroy the BCL11A binding motif (underlined blue). In the absence of the –110 A>G bystander conversion, a GATA motif would be created (underlined red). (B) The vectors contain an HBG1/2 sgRNA and the ABE8e gene linked to miRNA regulatory elements. The ABE8e gene is either under the control of the PGK promoter (HDAd-PGK.ABE8e) or the EF1α promoter (HDAd-EF1α.ABE8e). The vectors also contain a PGK-mgmtP140K cassette for O6-BG/BCNU selection. The IR and frt sequences are remnants from previous vectors that were integrated by SB100x transposase. They are irrelevant for this study, which does not employ the SB100x integrating system. (C) Editing rate in CD34+ cells from 3 healthy, G-CSF–mobilized donors. Cells were transduced at an MOI of 2,000 viral particles (vp)/cell, and 3 days later, genomic DNA was analyzed by Sanger sequencing for the –113 A>G conversion. ABEmax is an early adenine base editor version (12). (D) Sequences of the top 12 edited alleles in CD34+ cells from donor #1 after transduction with HDAd-EF1α.ABE8e. The target site –113 A (A8 in the sequence shown in the lower panel) is marked by a green box. Editable window in the spacer by ABE8e is highlighted in orange. (E and F) In vitro transduction studies with donor #1 CD34+ cells that were subjected to erythroid differentiation (ED) and 1 cycle of O6-BG/BCNU selection. (E) Schematic of the experiment. (F) Percentage of –113 A>G conversion at different time points without or with O6-BG + 15, 25, or 35 μM BCNU added at day 3. The SD was less than 10% for all time points. n = 3 technical replicates.
Figure 2
Figure 2. In vitro editing studies with CD34+ cells from patients with β-thalassemia and SCD.
(A) Schematic of the experiment. G-CSF/plerixafor mobilized CD34+ cells from 3 β-thalassemia (Thal) patients were used. SCD CD34+ cells from fresh peripheral blood were isolated after blood transfusion of 3 patients (1 β0S, 2 βSS patients). CD34+ cells were transduced with HDAd-EF1α.ABE8e or left untransduced (UNTD). Cells were then subjected to erythroid differentiation for 18 days. Aliquots were collected at the indicated time points. On day 3, 1 set of ED cells was treated once with O6-BG/BCNU for in vitro selection (only from second βSS patient, we obtained sufficient numbers of CD34+ cell to perform in vitro selection). (B) Editing rate of the –113 A target site and percentage of reads with indels analyzed by NGS for the thalassemia samples (left panel) and SCD samples (right panel). Note the different scale on the y axes for on-target editing and indels. (C) Flow cytometry analysis for γ-globin/HbF at the end of ED in total cells and in differentiated enucleated erythroid (NucRed) cells in Thal and SCD samples. (D) Measurement of globin protein chains by HPLC. Shown is the percentage of human γ-globin relative to human β- and α-globin chains in Thal samples (n = 3), 2 SCD (βSS) samples without selection, and 1 SCD (βSS) sample with selection. Statistical analyses of the data from the Thal samples were performed using 2-way ANOVA.
Figure 3
Figure 3. Phenotypic improvement in in vitro editing studies with CD34+ cells from patients with β-thalassemia and SCD.
Analyses were done with the samples described in Figure 2. (A) Percentage of ROS+ cells within total erythroid cells (CD235a+) and denucleated erythroid cells (CD235a+/NucRed cells) for Thal samples and in total erythroid cells for SCD samples. (B) Fold increase in erythroid cell numbers between days 7 and 18 of ED. Statistical analyses of the data from the Thal samples were performed using 2-way ANOVA.
Figure 4
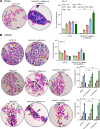
Figure 4. Cytospins from cultures at different time points of ED.
(A) Representative samples from Thal CD34+ cells either untransduced or transduced with HDAd-EF1α.ABE8e and O6-BG/BCNU selected. Left panel: cytospins stained with Giemsa/May-Grünwald (see Supplemental Methods). The arrows indicate cells at different stages of erythroid differentiation: proerythroblasts (red) → basophilic erythroblasts (green) → polychromatic erythroblasts (blue) → orthochromatic erythroblasts (orange) → maturing orthochromatic erythroblasts (yellow) → reticulocytes (black)/pyrenocytes (gray). Scale bar: 25 μm. Right panel: quantification of erythroid progenitors. Five random fields were counted by 2 scientists. Pro, proerythroblasts; Baso, basophilic erythroblasts; Poly, polychromatic erythroblasts; Ortho, orthochromatic erythroblasts; mat; Ortho, maturing orthochromatic erythroblasts; Retics, reticulocytes; Pyrcs, pyrenocytes. (B) Cytospins from differentiated SCD CD34+ cells at days 11, 14, and 18 of ED, untransduced and HDAd-EF1α.ABE8e –transduced without and with selection. Statistical analyses were performed using 2-way ANOVA. *P < 0.05.
Figure 5
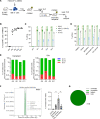
Figure 5. Ex vivo HSC base editing for γ-globin reactivation by HDAd-EF1α.ABE8e.
(A) Schematic of the experiment. BM Lin cells were isolated from β-YAC/CD46 transgenic mice and transduced ex vivo with HDAd-EF1α.ABE8e at an MOI of 500 vp/cell. After 1 day in culture, 1 million cells per mouse were transplanted into lethally irradiated C57BL/6 mice, which were followed for 16 weeks (week 16 primary [week 16-P]). Data from these mice are shown in this figure. BM Lin cells from these mice were then used for secondary transplantation and these mice were monitored for another 16 weeks (week 16 secondary [week 16-S]; see Supplemental Figure 6). (B) Engraftment of transplanted HDAd-EF1α.ABE8e–transduced HSCs measured by flow cytometry of human CD46 in PBMCs. Each symbol is an individual mouse. n = 5 animals. (C) Analysis of target site editing in PBMCs by Sanger sequencing. Shown are percentages of conversion for the –113 A>G site and neighboring adenines. n = 5 animals. (D) Analysis of target site editing in PBMCs, spleen, BM MNCs, BM Lin cells, and CFU at week 16 after transplantation by Sanger sequencing. n = 5 animals. (E) Comparison of editing rates (by NGS) at the 4 adenines in the transplant (ex vivo transduced Lin cells cultured for 3 days) and BM MNCs at week 16 after transplantation. Shown are percentages of reads. Note the log10 scale of the y axis. n = 3 animals. (F) NGS of the target area (222 bp amplicon; ~100 nucleotides upstream and downstream of the spacer). Left panel: base substitutions (green), deletions (blue), and insertions (red) in the target area for 1 representative mouse. Right panel: summary of all indel reads in the transplant, week 16-P mice and week 16-S mice. *P < 0.05. Statistical analyses were performed using 2-way ANOVA. (G) Editing on a single cell basis. Week 16 BM Lin cells were plated for progenitor assay, and individual colonies were subjected to NGS. Shown is a representative mouse with 100% biallelic editing of the HBG1/2 sites. n = 36 (3 mice, 12 colonies per mouse analyzed).
Figure 6
Figure 6. γ-Globin analysis after ex vivo base editing with by HDAd-EF1α.ABE8e.
(A) Percentage of γ-globin+ peripheral RBCs measured by flow cytometry at different time points after transplantation. n = 5 animals. (B) qPCR for globin mRNA (human HBG/γ-globin versus mouse HBA/α-globin; human HBG/γ-globin versus mouse HBB/β-globin; human HBG/γ-globin versus human HBB/β-globin). Shown are the fold changes between untreated and treated animals. n = 5 animals. (C) Percentage of human γ-globin chains relative to mouse α-globin chains, mouse β-globin, and human β-globin chain measured by HPLC.
Figure 7
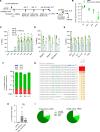
Figure 7. In vivo HSC transduction of β-YAC/CD46 mice to achieve γ-globin reactivation by HDAd-EF1α.ABE8e.
(A) Experimental procedure. β-YAC/CD46 mice (n = 5 animals) were mobilized by G-CSF/AMD3100 and in vivo transduced by i.v. injection of HDAd-EF1α.ABE8e. In vivo selection with O6-BG/BCNU was started at day 2 after HDAd injection and repeated at days 12 and 26 at the indicated doses (30 mg/kg O6-BG + 5, 10, and 10 mg/kg BCNU). The mice were euthanized at week 16-P. The data from primary in vivo transduced mice are sown in this figure. Lin cells were isolated from BM and i.v. injected into lethally irradiated C57BL/6J mice. The secondary transplanted mice were followed for another 16 weeks (week 16-S; see Supplemental Figure 10). (B) Loss of vector genomes in PBMCs and BM MNCs. Vector copy number (VCN) was measured by qPCR with human mgmtP140K primers. ND, not detectable. n = 5 animals for d3 and wk16; n = 3 animals for wk4 and wk6. (CE) Target base conversion measured by Sanger sequencing. Each dot represents 1 animal. n = 5 animals. (C) Percent conversion in DNA from PBMCs. (D) Percent conversion at week 16 in PBMCs and MNCs in the spleen and BM. (E) Percent conversion at week 16 in lineage (CD3+, CD19+, Gr-1+, Ter-119+) cells and in Lin cells in the BM. (F) Comparison of editing rates at the 4 adenines in BM MNCs at week 16 after in vivo transduction. Shown are percentages of reads. n = 5 animals. (G) Representative NGS results showing target base conversion and indels at week 16 (mouse #446). (H) Summary of all indel reads in week 16-P mice and week 16-S mice. n = 5 animals. (I) Editing on a single-cell basis. Week 16 BM Lin cells were plated for progenitor assays, and individual colonies were subjected to NGS. Shown are sequencing data of the HBG1 and HBG2 sites of a representative colony with mono- and biallelic conversions, as well as indels (<1%, not visible).
Figure 8
Figure 8. γ-Globin analysis after in vivo base editing with by HDAd-EF1α.ABE8e.
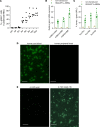
(A) γ-Globin expression in peripheral RBCs measured by flow cytometry. n = 5 animals. (B) γ-Globin expression at mRNA level measured by qPCR. Data shown are fold of change over mouse HBA, mHBB, or human HBB mRNA. n = 5 animals. (C) Human γ-globin chain levels in RBC lysates measured by HPLC. Data shown are percentages over mouse α- or β-globin or human β-globin. n = 5 animals. (D and E) Immunofluorescence analysis of HbF in erythrocytes. (D) Human samples. Cytospins of total blood cells from umbilical cord blood (fetus-derived) and from an adult donor. (E) Samples from untreated and treaded β-YAC mice (total blood). Cytospins were stained with a GFP-specific antibody. Shown are representative samples out of 5 cytospins per group. Scale bar: 20 μm.
Figure 9
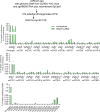
Figure 9. Off-target analysis after in vitro and in vivo base editing with HDAd-EF1α.ABE8e (based on CIRCLE-Seq prediction).
Genomic DNA from CD46/β-YAC naive mice was cleaved with recombinant SpCas9 plus sgHBG#2 RNA. CIRCLE-Seq identified 272 OTS, from which the top 20 were subjected to NGS. Amplicons were prepared using a genomic DNA template from a naive mouse and an in vivo transduced mouse with the highest on-targeting editing rate. The middle 2 panels show A>G conversion frequencies in the targetable window (positions 3–14) of the top 20 candidate OTS. Note that, for site mOTS11, the percentage of target-site conversion was similar for untreated and HDAd-EF1α.ABE8e–treated mice, making it unlikely that the conversions were triggered by ABE8e. The bottom panel shows the indel frequency in a quantification window of 140 bp.
Figure 10
Figure 10. Off-target analysis after in vitro and in vivo base editing with HDAd-EF1α.ABE8e (based on in silico prediction).
(A) Analysis based on in silico OTS prediction using Cas-OFFinder software for the mouse genome. Seventy-four sites were nominated, from which the top 5 were subjected to NGS. Amplicons were prepared using genomic DNA template from a naive mouse and an in vivo–transduced mouse with the highest on-targeting editing rate. The middle and lower panels show the frequency of A>G conversions and indels, respectively. (B) Analysis based on in silico OTS prediction using Cas-OFFinder software for the human genome. Eighty-nine sites were nominated, from which the top 5 were subjected to NGS. Amplicons were prepared using genomic DNA from erythroid cells derived from CD34+ cells of a thalassemia patient that were in vitro transduced with HDAd-EF1α.ABE8e.
Figure 11
Figure 11. Differentially expressed genes after in vivo base editing HDAd-EF1α.ABE8e.
RNA-Seq analysis was performed with BM MNCs collected before treatment and at week 16 after in vivo HSC transduction/selection with HDAd-EF1α.ABE8e (n = 3 females, age 8–12 weeks). The genome of CD46/β-YAC mice contains the WT 248 kb β-globin locus (β-YAC) including the LCR, γ- and β-globin genes. Shown are genes with altered mRNA expression based on their adjusted P value after annotation with the human genome. (A) Altered mRNA expression after annotation with a reference human genome. Statistically significant changes (P < 0.01) are highlighted in red (upregulated). (B) Volcano plot of mRNA data after annotation with the mouse reference genome are shown. Statistically significant changes (P < 0.01) are highlighted in red (upregulated) or blue (downregulated). Statistical analyses were performed using 2-way ANOVA.

References

    1. Li C, Lieber A. Adenovirus vectors in hematopoietic stem cell genome editing. FEBS Lett. 2019;593(24):3623–3648. doi: 10.1002/1873-3468.13668. - DOI - PMC - PubMed
    1. Richter M, et al. In vivo transduction of primitive mobilized hematopoietic stem cells after intravenous injection of integrating adenovirus vectors. Blood. 2016;128(18):2206–2217. doi: 10.1182/blood-2016-04-711580. - DOI - PMC - PubMed
    1. Wang H, et al. In vivo HSC transduction in rhesus macaques with an HDAd5/3+ vector targeting desmoglein 2 and transiently overexpressing cxcr4. Blood Adv. 2022;6(15):4360–4372. doi: 10.1182/bloodadvances.2022007975. - DOI - PMC - PubMed
    1. Yu VW, Scadden DT. Hematopoietic stem cell and its bone marrow niche. Curr Top Dev Biol. 2016;118:21–44. doi: 10.1016/bs.ctdb.2016.01.009. - DOI - PMC - PubMed
    1. Wang H, et al. A combined in vivo hsc transduction/selection approach results in efficient and stable gene expression in peripheral blood cells in mice. Mol Ther Methods Clin Dev. 2018;8:52–64. doi: 10.1016/j.omtm.2017.11.004. - DOI - PMC - PubMed

Publication types