

A person-centered approach to capture health disparities and multidimensional impact of COVID-related stressors
- PMID: 36006708
- PMCID: PMC9958275
- DOI: 10.1037/amp0001044
A person-centered approach to capture health disparities and multidimensional impact of COVID-related stressors
Abstract
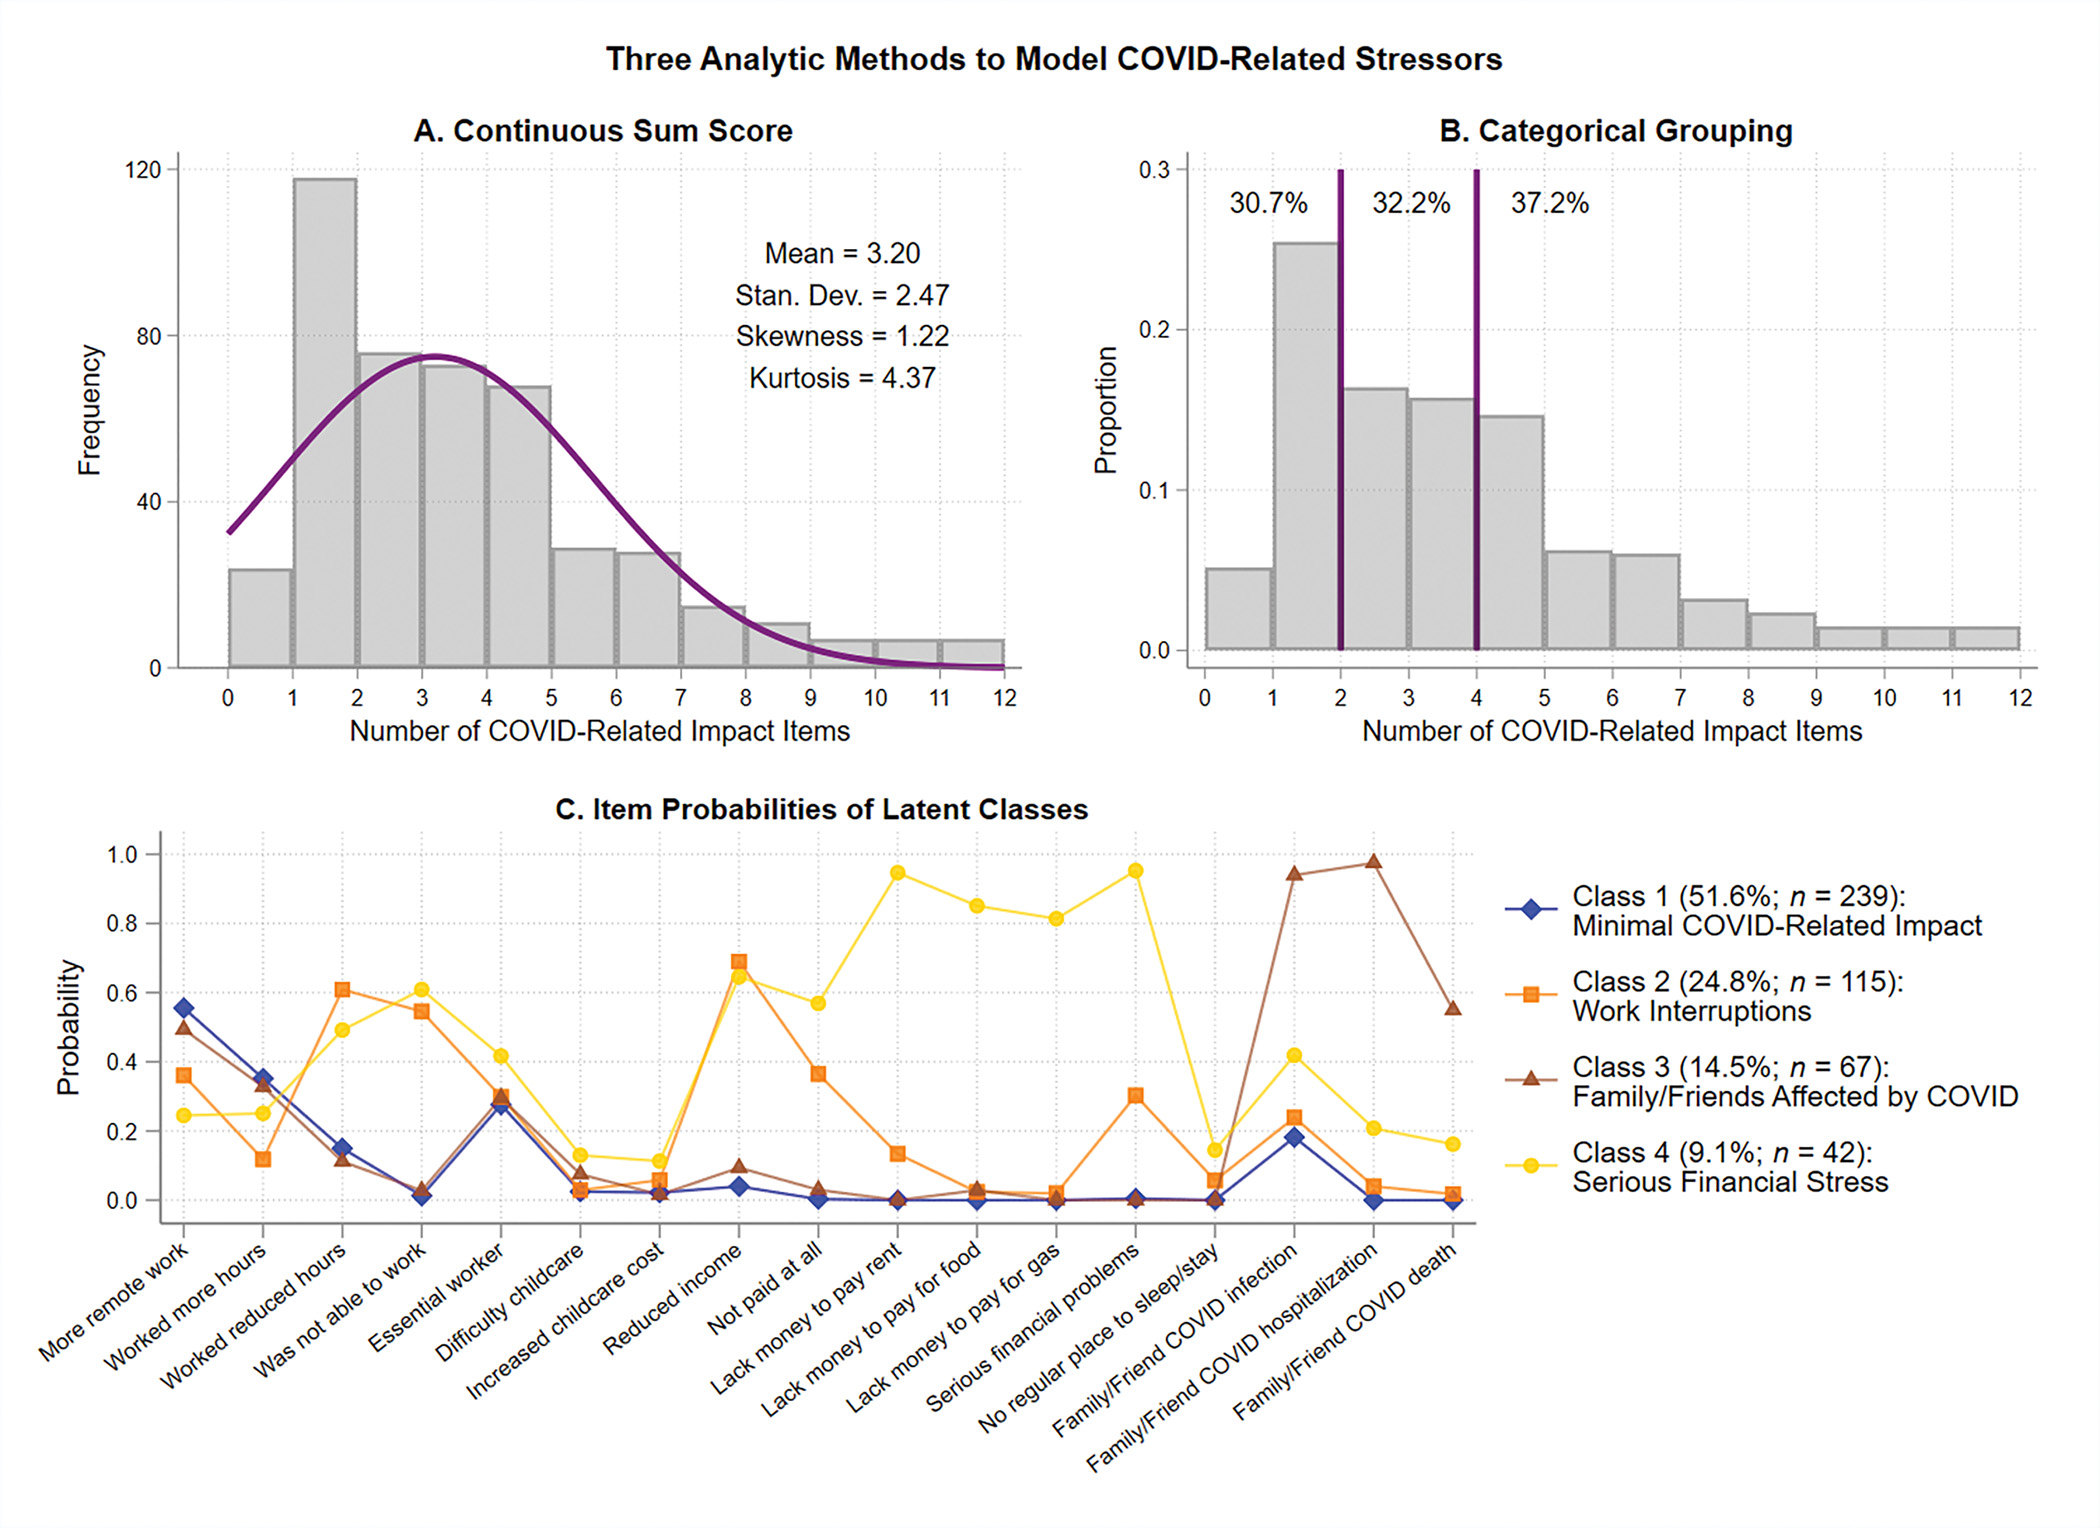
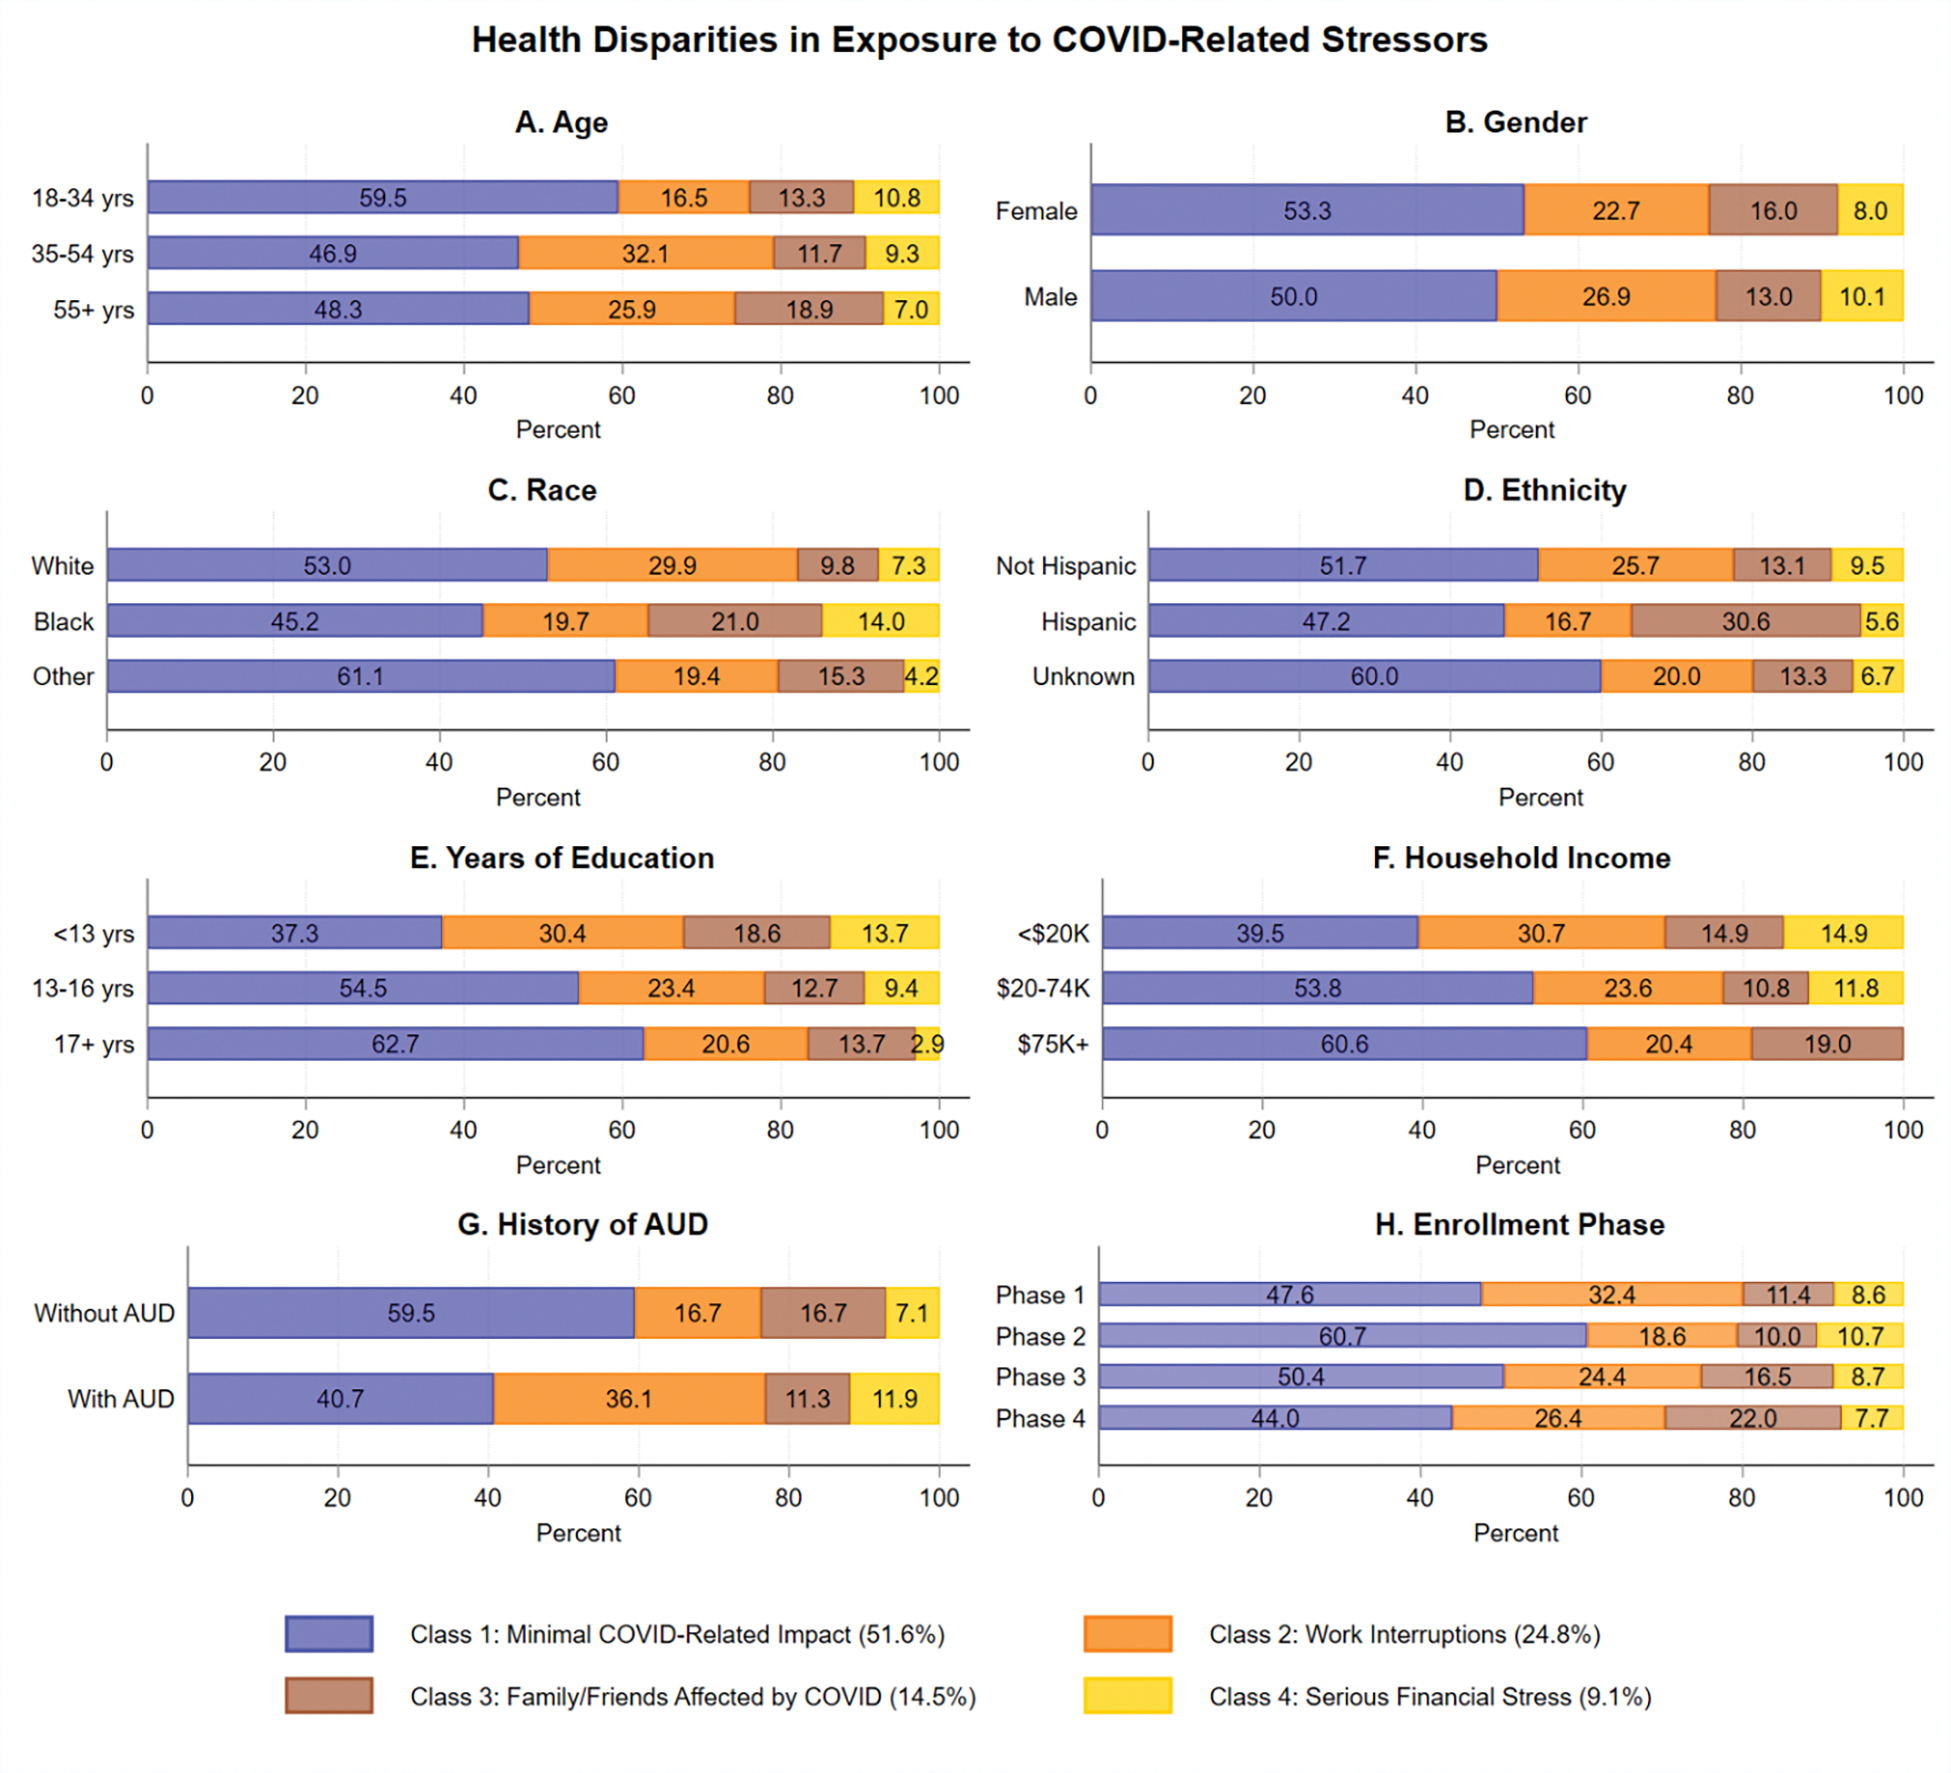
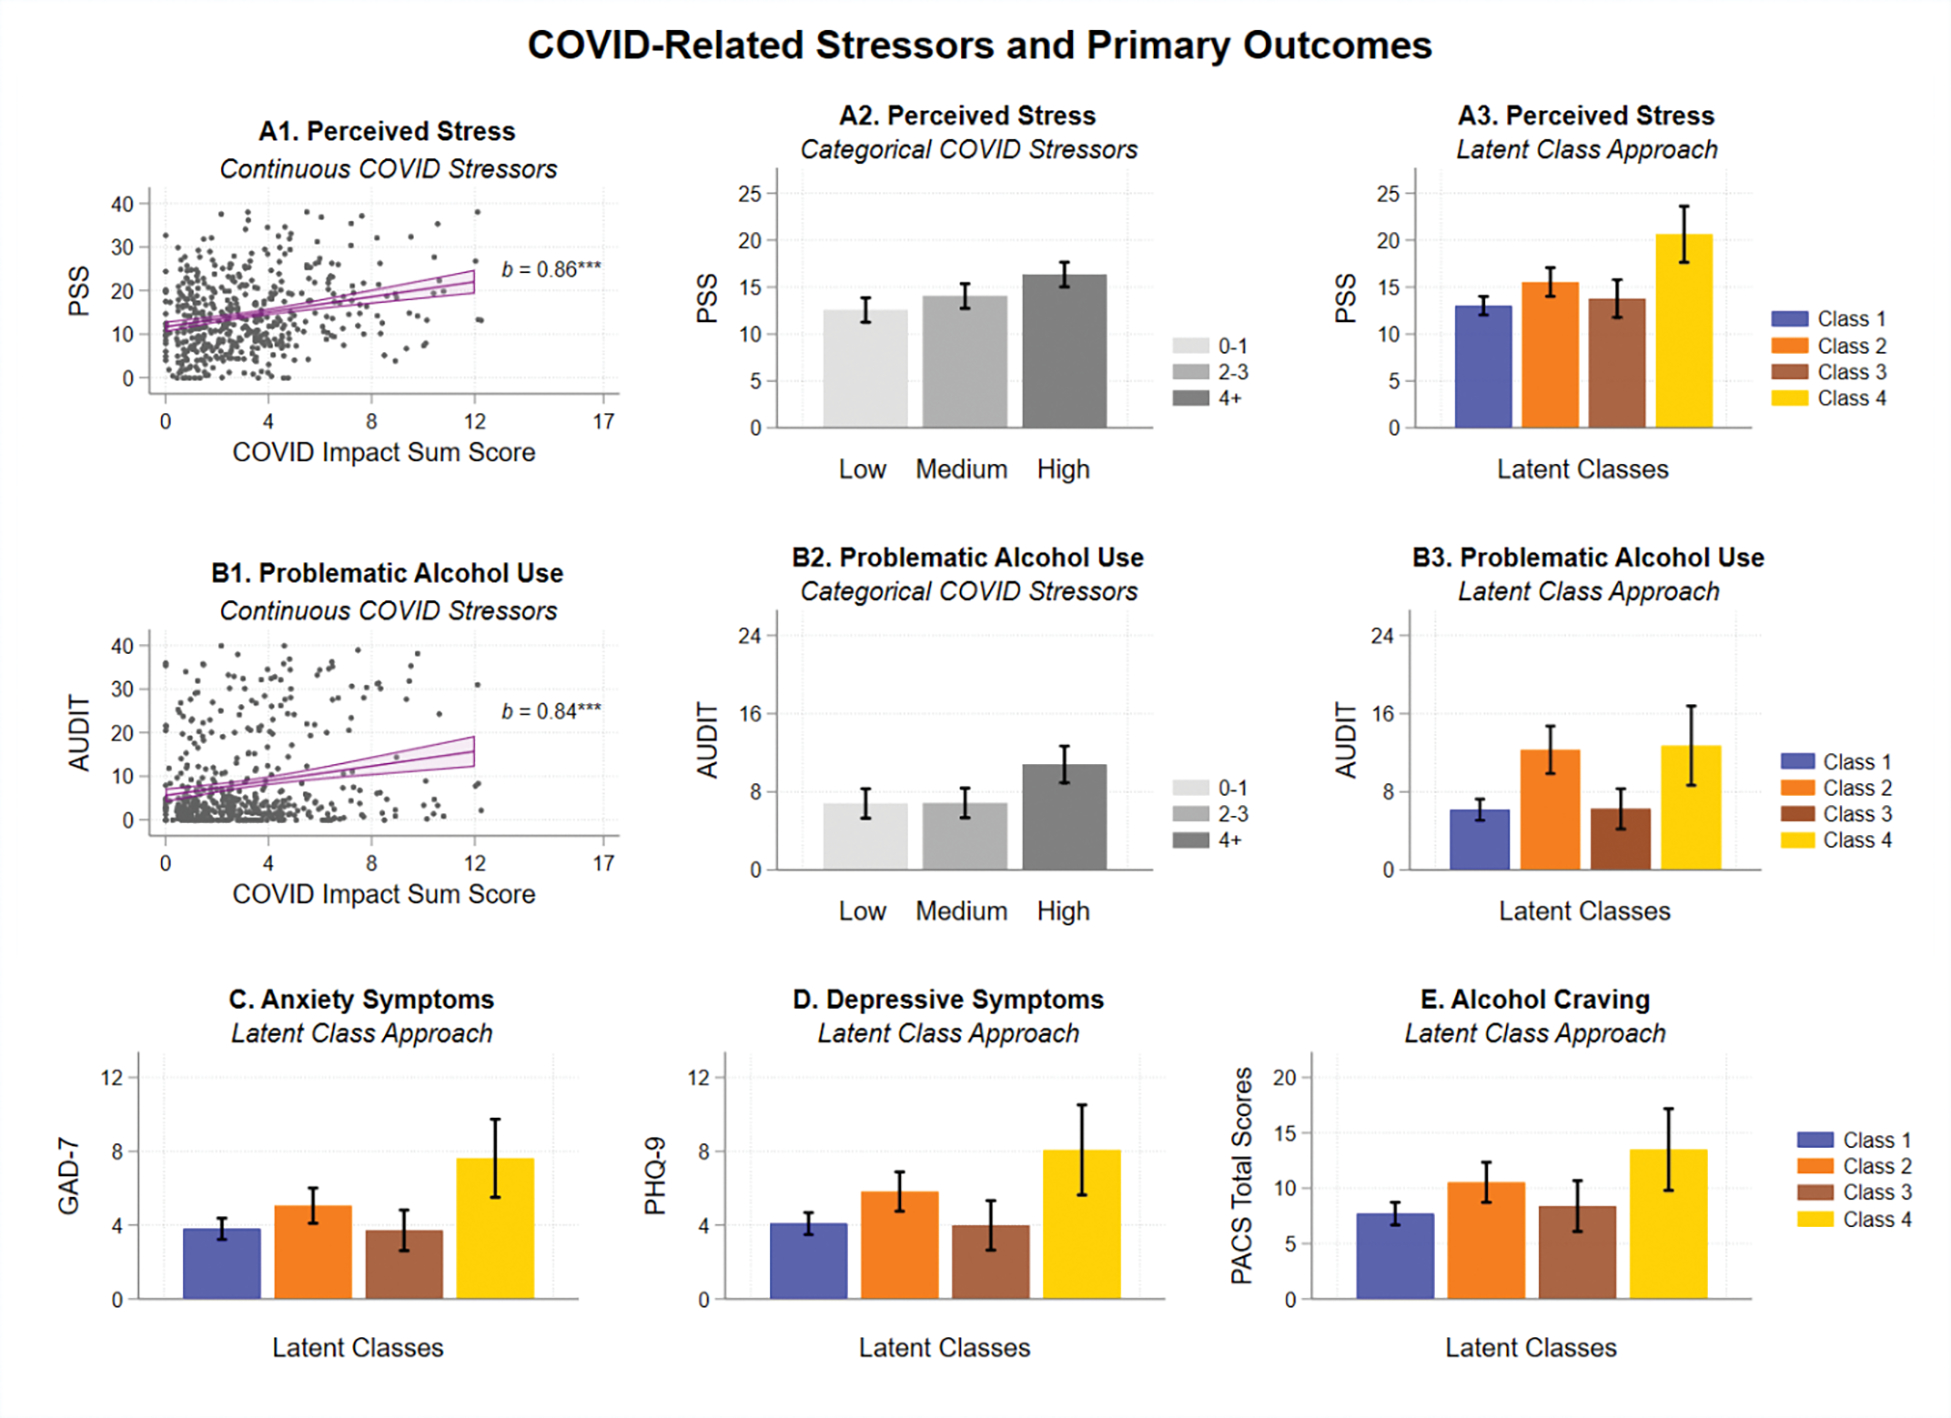
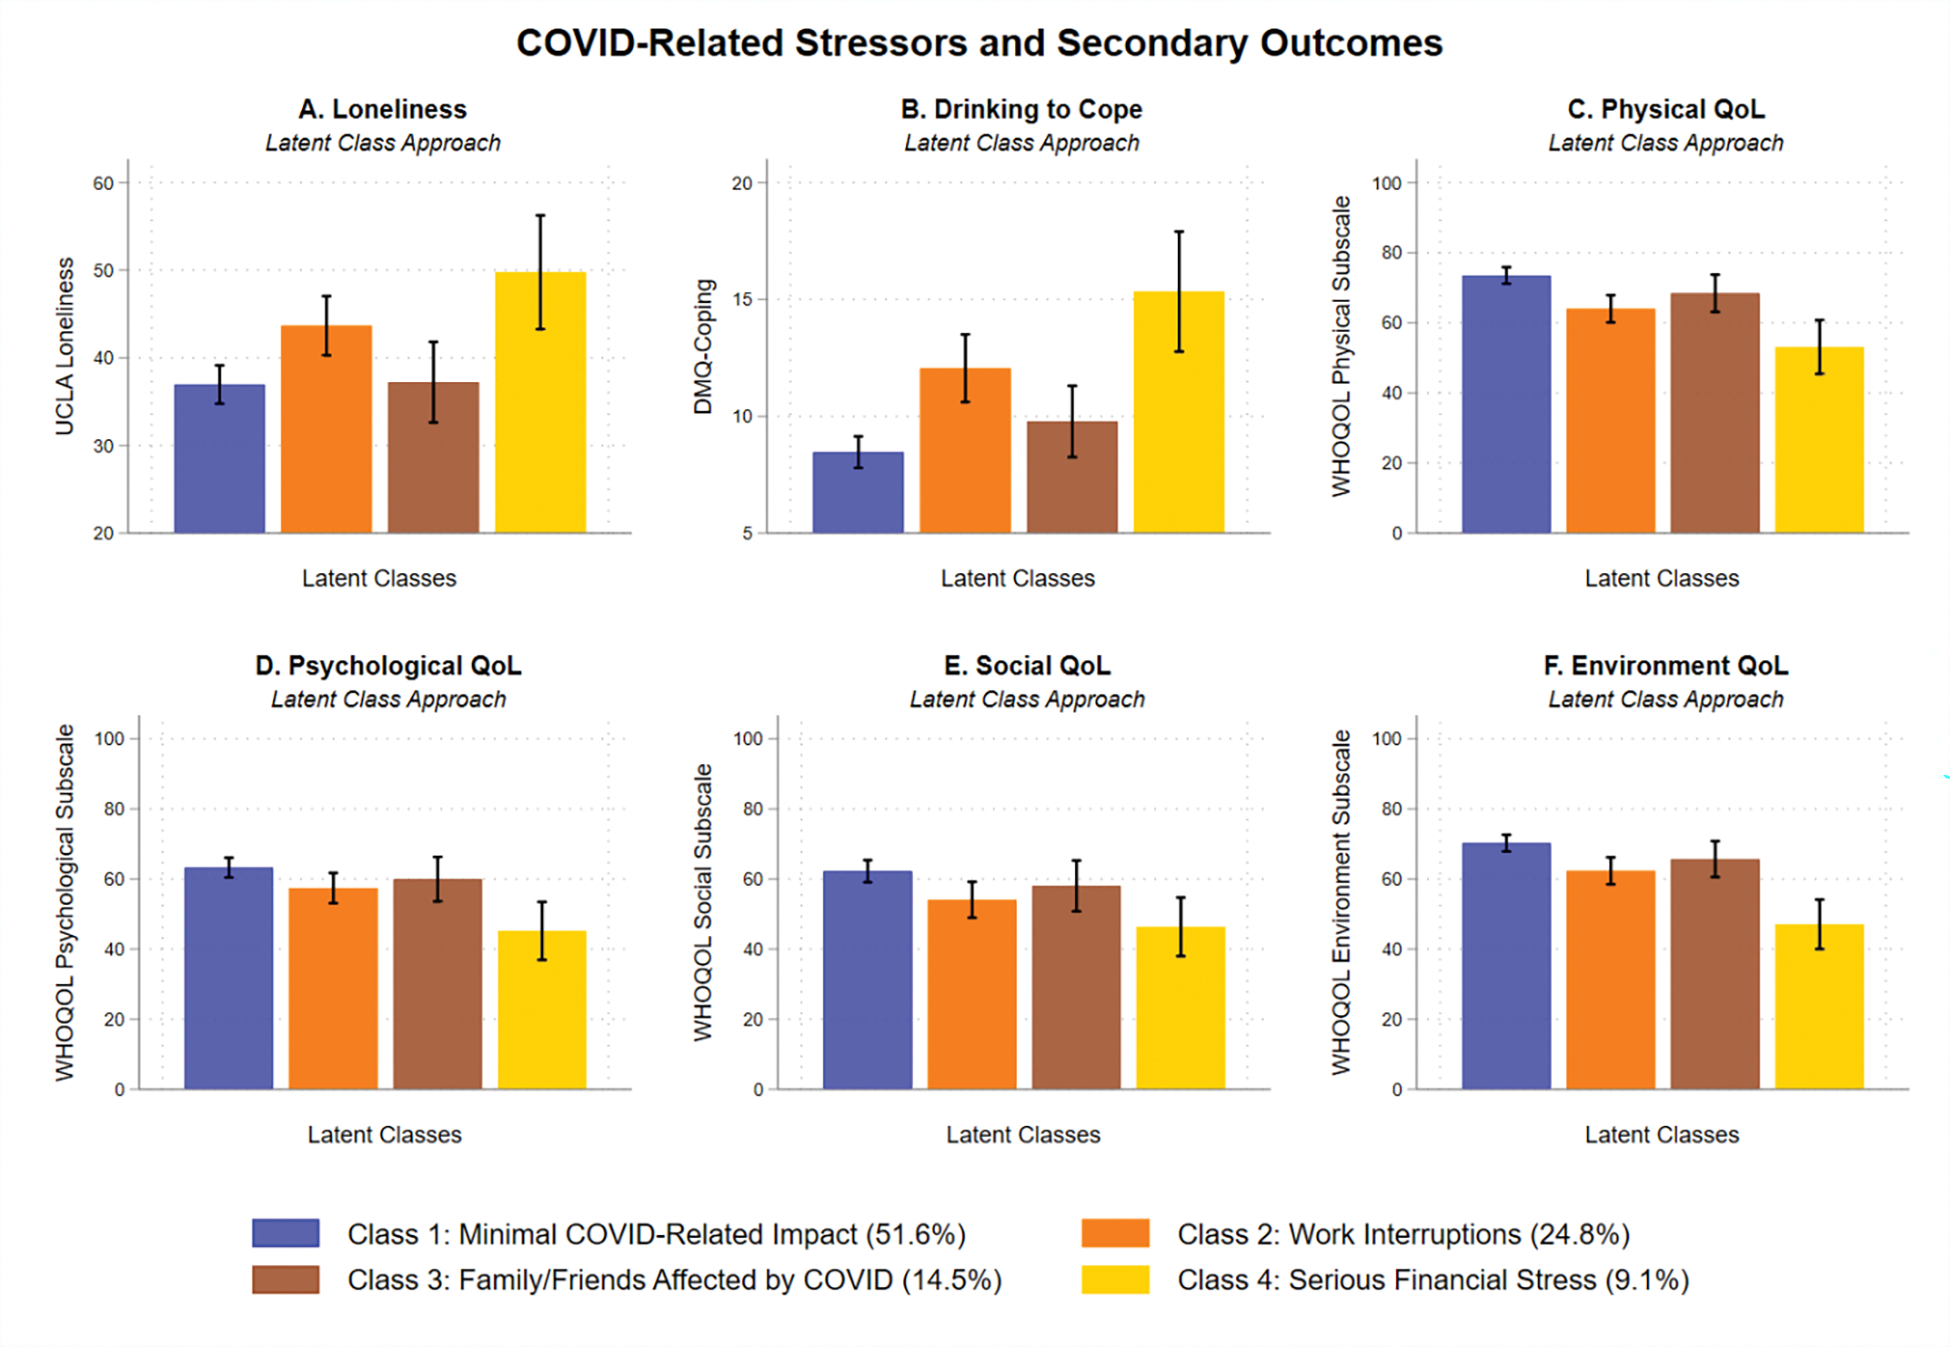
The COVID-19 pandemic has influenced people's lives in diverse ways. The authors utilized latent class analysis (LCA), a person-centered approach, to examine distinct patterns of COVID-related stressors and their associations with alcohol-related, mental health, and quality of life outcomes. Participants were 463 adults who completed the baseline assessment of the National Institute on Alcohol Abuse and Alcoholism COVID-19 Pandemic Impact on Alcohol Study from June 2020 to January 2022. Using cross-sectional data, three analytic methods (continuous sum score, categorical grouping, and LCA) were applied to model 17 COVID-related stressors. Regression analyses indicated higher COVID-related stress and endorsement of four or more COVID-related stressors were generally associated with worse health-related outcomes. LCA revealed four classes: Class 1: Minimal COVID-Related Impact (51.6%); Class 2: Work Interruptions (24.8%); Class 3: Family/Friends Affected by COVID (14.5%); and Class 4: Serious Financial Stress (9.1%). Racial/ethnic minorities were more likely to be in Class 3, whereas individuals with more years of education and higher income were less likely to be in Class 4. Individuals with a history of alcohol use disorder were more likely to be in Classes 2 and 4. Compared with Class 1, Class 4 reported highest levels of perceived stress, problematic alcohol use, anxiety symptoms, depressive symptoms, alcohol craving, loneliness, drinking to cope, and lowest levels of physical, psychological, social, and environment quality of life. COVID-related stressors disproportionately affected minority and vulnerable groups. Individuals who experienced multiple financial stressors had the greatest risk for negative health-related outcomes and may benefit from holistic interventions and community outreach. (PsycInfo Database Record (c) 2023 APA, all rights reserved).
Conflict of interest statement
Figures
References
-
- Acosta AM, Garg S, Pham H, Whitaker M, Anglin O, O’Halloran A, Milucky J, Patel K, Taylor C, Wortham J, Chai SJ, Kirley PD, Alden NB, Kawasaki B, Meek J, Yousey-Hindes K, Anderson EJ, Openo KP, Weigel A, Monroe ML, Ryan P, Reeg L, Kohrman A, Lynfield R, Bye E, Torres S, Salazar-Sanchez Y, Muse A, Barney G, Bennett NM, Bushey S, Billing L, Shiltz E, Sutton M, Abdullah N, Talbot HK, Schaffner W, Ortega J, Price A, Fry AM, Hall A, Kim L, & Havers FP (2021, Oct 1). Racial and Ethnic Disparities in Rates of COVID-19-Associated Hospitalization, Intensive Care Unit Admission, and In-Hospital Death in the United States From March 2020 to February 2021. JAMA Netw Open, 4(10), e2130479. 10.1001/jamanetworkopen.2021.30479 - DOI - PMC - PubMed
-
- Alon-Tirosh M, Hadar-Shoval D, Asraf K, Tannous-Haddad L, & Tzischinsky O (2021, Sep 15). The Association between Lifestyle Changes and Psychological Distress during COVID-19 Lockdown: The Moderating Role of COVID-Related Stressors. Int J Environ Res Public Health, 18(18). 10.3390/ijerph18189695 - DOI - PMC - PubMed
-
- Angelucci M, Angrisani M, Bennett DM, Kapteyn A, & Schaner SG (2020). Remote work and the heterogeneous impact of covid-19 on employment and health. National Bureau of Economic Research. 10.3386/w27749 - DOI
MeSH terms
Grants and funding
LinkOut - more resources
Full Text Sources
Medical
Research Materials