

Patient-Level and County-Level Trends in Nonfatal Opioid-Involved Overdose Emergency Medical Services Encounters - 491 Counties, United States, January 2018-March 2022
- PMID: 36006833
- PMCID: PMC9422964
- DOI: 10.15585/mmwr.mm7134a1
Patient-Level and County-Level Trends in Nonfatal Opioid-Involved Overdose Emergency Medical Services Encounters - 491 Counties, United States, January 2018-March 2022
Abstract
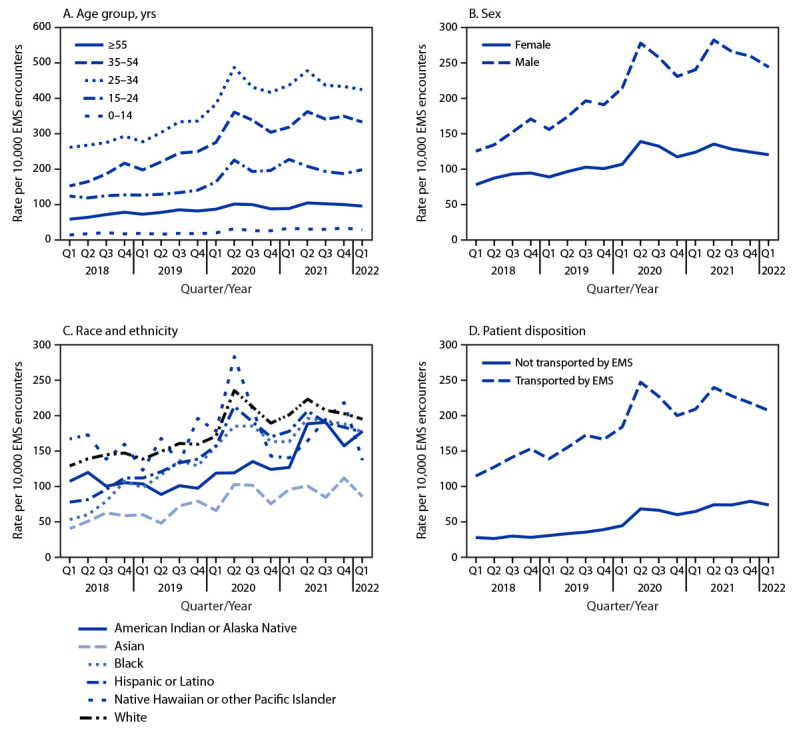
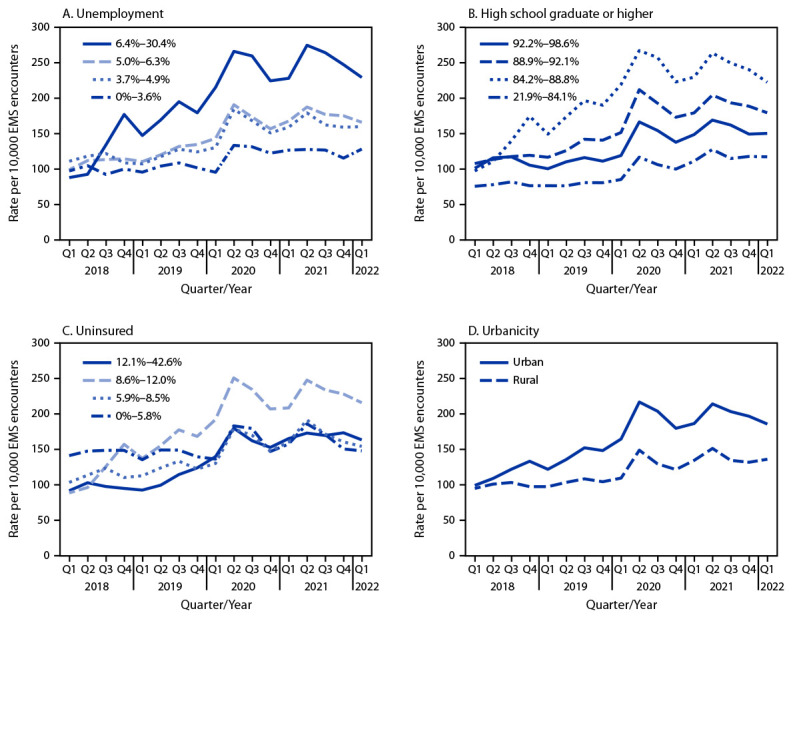
The number of nonfatal opioid-involved overdoses treated by health care providers has risen in the United States; the median number of emergency department (ED) visits for these overdoses was significantly higher during 2020 than during 2019 (1). ED visit data can underestimate nonfatal opioid-involved overdose incidence because, increasingly, persons experiencing a nonfatal opioid overdose are refusing transport to EDs by emergency medical services (EMS) (2). A study in Kentucky found that during a 6-month period, 19.8% of persons treated by EMS for an opioid overdose refused transport to an ED (2). Thus, EMS encounter data involving suspected nonfatal opioid-involved overdoses complement ED data and also allow for near real-time analysis (3). This report describes trends in rates of EMS encounters for nonfatal opioid-involved overdoses per 10,000 total EMS encounters (rates) by selected patient- and county-level characteristics during January 2018–March 2022 in 491 counties from 21 states using data from biospatial, Inc.* During this period, the nonfatal opioid-involved overdose rate increased, on average, 4.0% quarterly. Rates increased for both sexes and for most age groups. Rates were highest among non-Hispanic White (White) and non-Hispanic Native Hawaiian or other Pacific Islander (NH/OPI) persons, and increases were largest among non-Hispanic Black (Black), followed by Hispanic or Latino (Hispanic) persons. Rates increased in both urban and rural counties and for all quartiles of county-level characteristics (i.e., unemployment, education, and uninsured), except in counties with the lowest percentage of uninsured persons. Rates were highest and rate increases were largest in urban counties and counties with higher unemployment rates. This analysis of nonfatal opioid-involved overdose trends in EMS data highlights the utility of these data and the importance of addressing inequities that contribute to disproportionate overdose risk, such as through focused outreach to racial and ethnic minority groups, who disproportionately experience these inequities, and communities with higher levels of unemployment. EMS providers are in a unique position to engage in postoverdose response protocols and promote evidence-based overdose education and facilitate linkage to care and harm reduction services.†,§
Conflict of interest statement
All authors have completed and submitted the International Committee of Medical Journal Editors form for disclosure of potential conflicts of interest. Josh Walters reports that he owns employee stock options in biospatial, Inc. No other potential conflicts of interest were disclosed.
Figures
References
MeSH terms
Substances
LinkOut - more resources
Full Text Sources
Medical
