. 2022 Aug 25;18(8):e1010755.
doi: 10.1371/journal.ppat.1010755. eCollection 2022 Aug.

Universal protection against influenza viruses by multi-subtype neuraminidase and M2 ectodomain virus-like particle

Affiliations

Universal protection against influenza viruses by multi-subtype neuraminidase and M2 ectodomain virus-like particle

Ki-Hye Kim et al. PLoS Pathog. .

Abstract

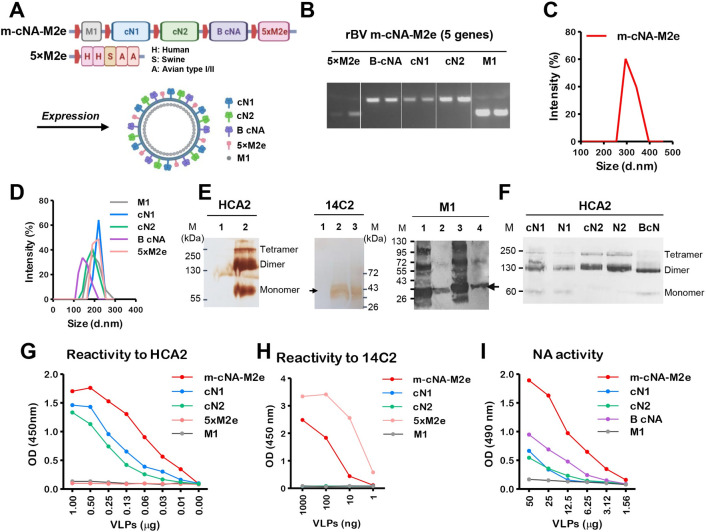
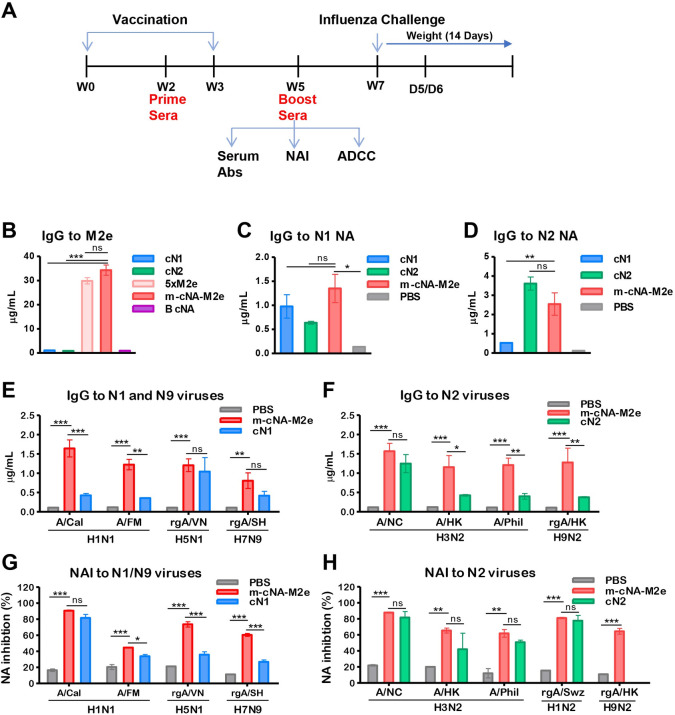
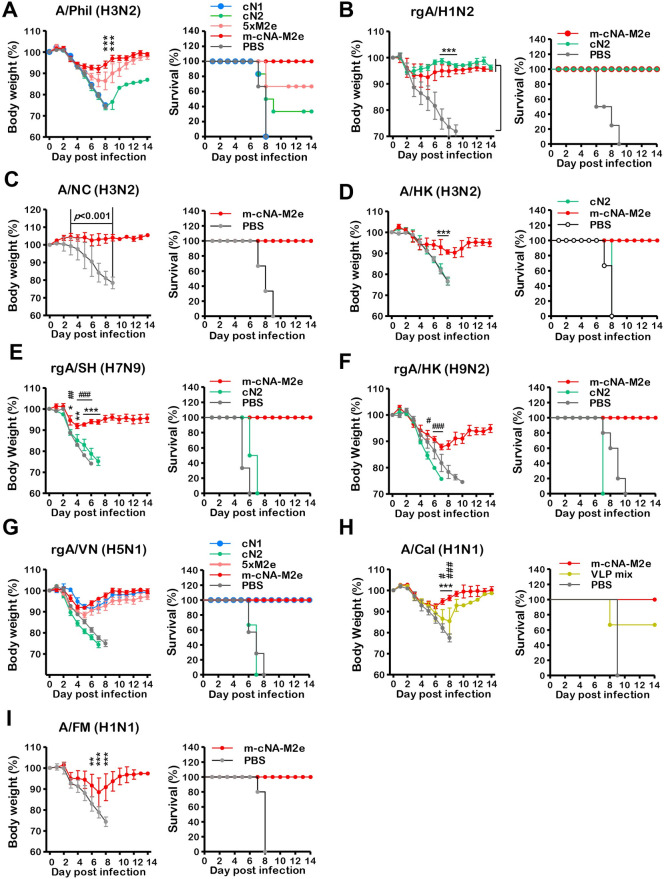
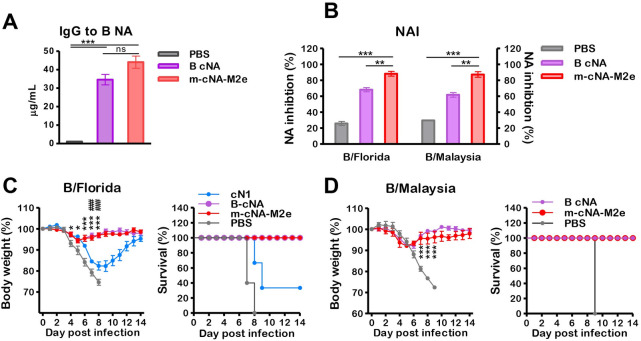
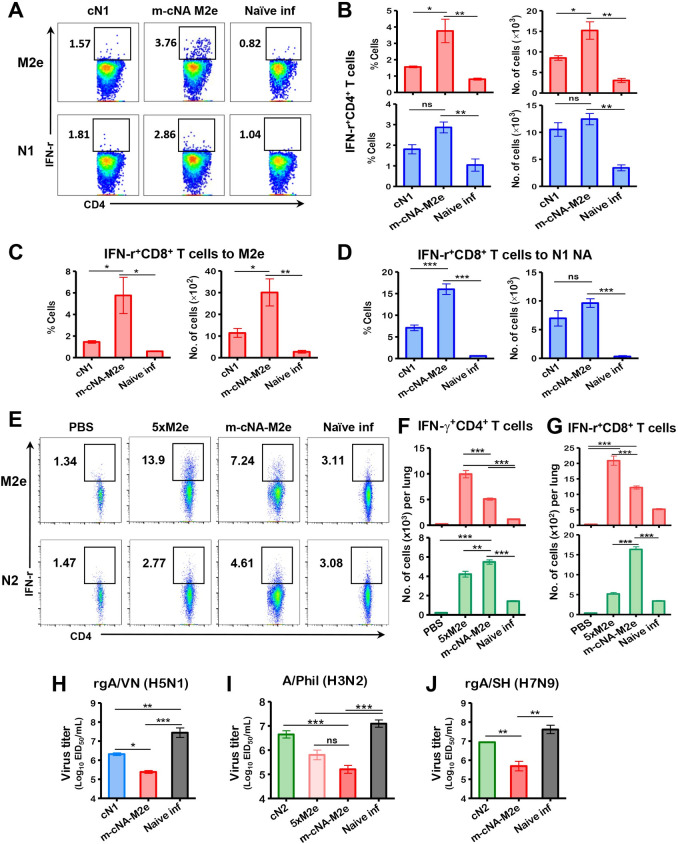
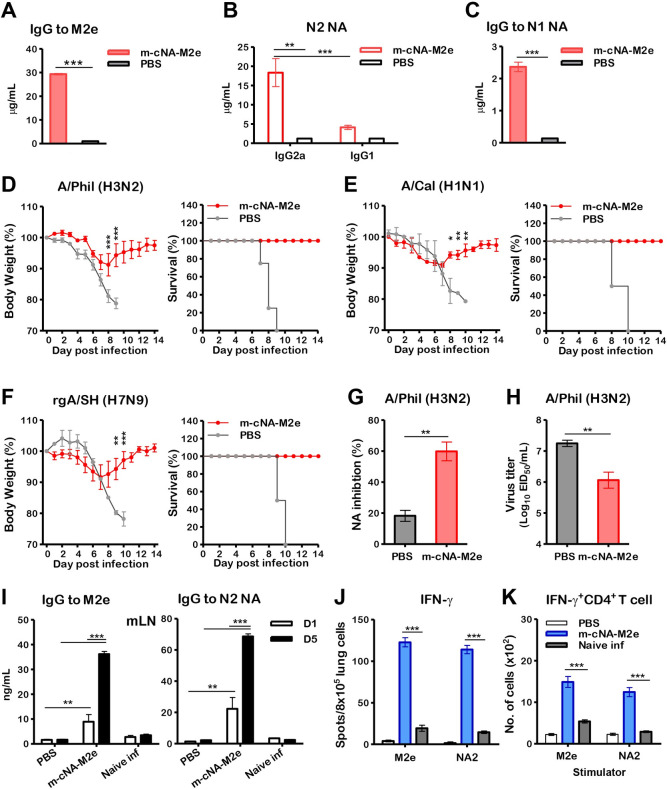
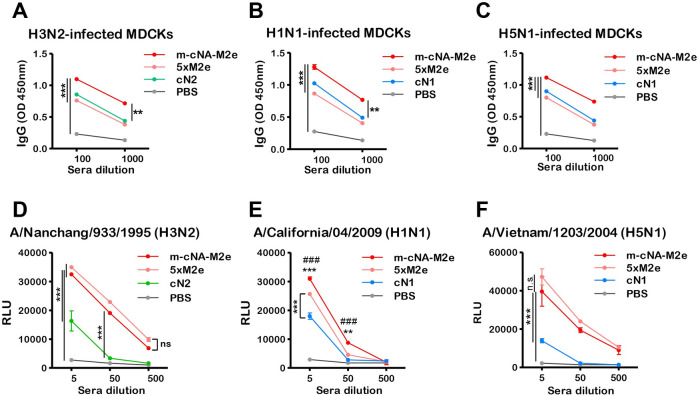
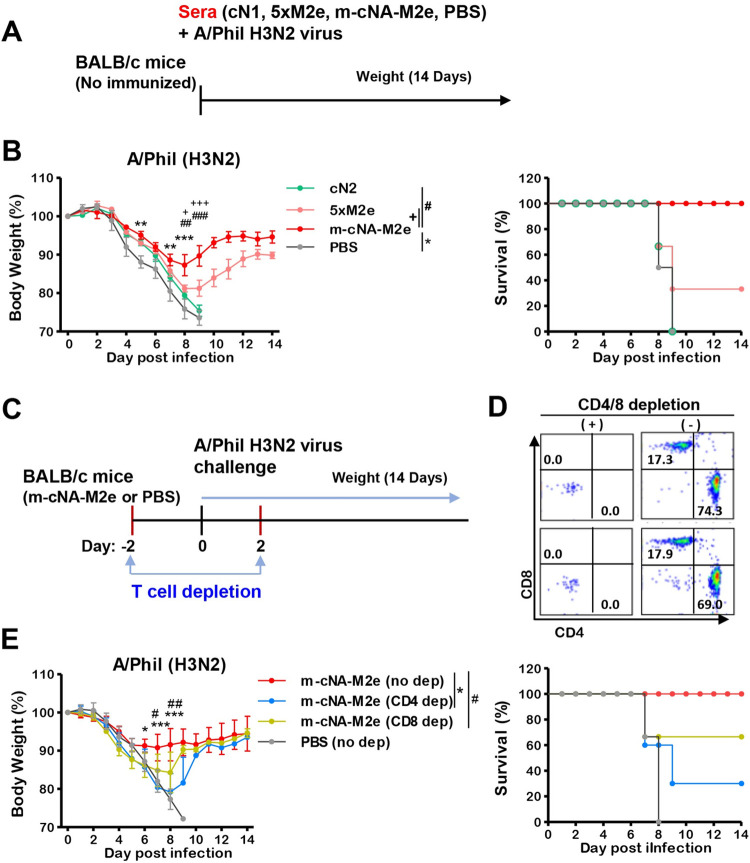
Annual influenza vaccination is recommended to update the variable hemagglutinin antigens. Here, we first designed a virus-like particle (VLP) displaying consensus multi-neuraminidase (NA) subtypes (cN1, cN2, B cNA) and M2 ectodomain (M2e) tandem repeat (m-cNA-M2e VLP). Vaccination of mice with m-cNA-M2e VLP induced broad NA inhibition (NAI), and M2e antibodies as well as interferon-gamma secreting T cell responses. Mice vaccinated with m-cNA-M2e VLP were protected against influenza A (H1N1, H5N1, H3N2, H9N2, H7N9) and influenza B (Yamagata and Victoria lineage) viruses containing substantial antigenic variations. Protective immune contributors include cellular and humoral immunity as well as antibody-dependent cellular cytotoxicity. Furthermore, comparable cross protection by m-cNA-M2e VLP vaccination was induced in aged mice. This study supports a novel strategy of developing a universal vaccine against influenza A and B viruses potentially in both young and aged populations by inducing multi-NA subtype and M2e immunity with a single VLP entity.


Conflict of interest statement

The authors declare no conflicts of competing interest exits.

Figures

Fig 1
Fig 1. Design and characterization of m-cNA-M2e VLPs containing consensus multi-subtype cNA and tandem repeat 5×M2e.
(A) Scheme diagram of multi-component m-cNA-M2e VLP vaccine expressing M1, multi subtype cNA (cN1, cN2, and B-cNA), and 5×M2e genes under each polyhedrin promoter (red boxes). (B) PCR analysis for confirmation of five genes cloned into the rBV transfer plasmid pFastBac using gene specific primers. (C and D) Size distribution of (C) m-cNA-M2e VLP, (D) mono cN1 VLP, cN2 VLP, and 5×M2e VLP. d.nm: diameter in nanometer. (E) Western blot analysis of m-cNA-M2e and controls using HCA2 (left) mAb specific for pan NA222-230, 14C2 mAb specific for M2e (middle), and M1 (right) specific mAb (ab22396). M: size marker; kDa: kilodalton. VLPs in each line were loaded with 20–30 μg. For HCA2 and 14C2; lane 1 M1 VLP, lane 2 m-cNA-M2e VLP, lane 3 5×M2e VLP. For M1; lane 1 m-cNA-M2e VLP, lane 2 M1 VLP, lane 3 inactivated A/PR8 virus, lane 4 5×M2e VLP. (F) Western blot analysis of monomeric VLP samples. VLP and NA protein samples were loaded with 30 μg and 5 μg respectively. cN1: consensus cN1 VLP, N1: NA protein from A/California/04/2009 H1N1 (BEI, NR-19234), cN2: consensus cN2 VLP, N2: NA protein from A/Brisbane/10/2007 H3N2 (BEI, NR-43784), B-cN: influenza B consensus NA VLP. (G and H) The reactivity of m-cNA-M2e VLP, mono cNA VLPs and 5×M2e VLP to HCA2 (G) or 14C2 (H) mAbs by ELISA. (I) Functional NA activity of m-cNA-M2e VLP and mono cNA VLPs by ELLA.
Fig 2
Fig 2. Vaccination with m-cNA-M2e VLP induces IgG antibodies specific for M2e, NA, multi subtype viruses, and broad NA inhibition activity.
(A) Schematic overview of vaccination of mice, prior to influenza virus challenge. BALB/c mice (n = 10 per group) were intramuscularly immunized twice with each VLP vaccine as indicated. Boost sera (W5) were used for measuring IgG, NAI, and ADCC assay, followed by intranasal (IN) influenza virus challenge at W7 and tissue samples were collected at day 5 or 6 post infection for lung viral titers. cN1: monomeric consensus cN1 NA VLP (3 μg), cN2: monomeric cN2 NA VLP (3 μg), 5xM2e: monomeric 5xM2e VLP (3 μg), m-cNA-M2e VLP: multi-subtype consensus NA (cN1-cN2-B cNA) plus 5xM2e VLP (10 μg). B cNA: monomeric consensus B NA VLP (3 μg). Naïve mice (PBS) were used as a mock control. (B-F) IgG antibodies in concentrations as determined by ELISA. IgG antibodies specific for M2e (B), N1 NA (A/Cal/2009 H1N1) (C), N2 NA (A/Brisbane/2007 H3N2) (D), inactivated influenza viruses (E and F) in boost immune sera. (G and H) Neuraminidase (NA) inhibition activities in 40-fold diluted boost immune sera by ELLA. rgA/PR8-Swz (rgAH1N2): reassortant containing N2 of A/Switzerland/2013 (H3N2) and A/PR8 (H1N1) backbone. All viruses and vaccine groups are as described in Materials and Methods. Data represented as mean ± SEM; statistical significances were performed by (B-D) one-way ANOVA and (E-H) Turkey’s comparison and two-way ANOVA with Bonferroni posttest and indicated as **, P < 0.01; ***, P < 0.001.
Fig 3
Fig 3. Broad cross protection against different NA subtype influenza A viruses after vaccination.
Immunized mice (n = 6 per group) were infected with a lethal dose of different NA subtype influenza A viruses. (A) A/Phil/1982 (H3N2) (3xLD50, 2.3x10² EID50), (B) rgA/H1N2 (3xLD50, 1.3x10³ EID50), (C) A/NC (H3N2) (A/Nanchang/1995, 2xLD50, 3x10⁶ EID50), (D) A/HK H3N2 (5xLD50, 4x10 EID50), (E) rgA/SH/2013 (H7N9) (3xLD50, 1.1x10⁴ EID50), (F) rgA/HK/1999 (H9N2) (5xLD50, 1.4x10² EID50), (G) rgA/VN/2004 H5N1 (3xLD50, 2.6x10⁴ EID50), (H) A/Cal/2009 H1N1 (3xLD50, 2x10³ EID50), (I) A/FM/1947 H1N1 (3xLD50, 8x10³ EID50). The VLP vaccine dose and groups are the same as in the Fig 2 legend except for the cN2 (cN2 VLP, 10 μg) group in (B). The statistical significances were performed with one-way ANOVA with Tukey’s Multiple Comparison test and indicated as *,# P < 0.05; **,##, P < 0.01; ***,###, P < 0.001 (compared among the m-cNA-M2e and PBS, monomeric cN, or VLP mix control groups); ns, no significant difference between two compared groups.
Fig 4
Fig 4. Vaccination with m-cNA-M2e VLP induces cross protection against influenza B viruses.
BALB/c mice (n = 10 per group) were intramuscularly prime-boost immunized with m-cNA-M2e VLP (10 μg) or B cNA VLP (3 μg). (A) IgG antibodies specific for flu B NA protein (B/Florida/4/2006) as determined by ELISA. (B) NA inhibition activities against B/Florida/4/2006 and B/Malaysia/2056/2004 viruses in 40-fold diluted boost immune sera by ELLA. (C) Protection against B/Florida/4/2006 (2xLD50). (D) Protection against B/Malaysia/2056/2004 (3xLD50). The VLP vaccine dose and groups are the same as in the Fig 2 legend. The statistical significances were performed with one-way ANOVA with Tukey’s Multiple Comparison test and indicated as *,# P < 0.05; **,##, P < 0.01; ***,###, P < 0.001 (compared among the m-cNA-M2e and PBS or monomeric cN control groups).
Fig 5
Fig 5. CD4+ and CD8+ T cells responses and diminished lung viral loads by m-cNA-M2e VLP vaccination after virus challenge.
Immunized mice (n = 4 per group) were challenged with a lethal dose of (A-D) rgA/VN/2004 H5N1 (3xLD50, 2.6x10⁴ EID50) and (E-G) A/Phil/1982 (H3N2) virus (3xLD50, 2.3x10² EID50). (A-G) Effector CD4 or CD8 T cells secreting IFN-γ were analyzed in lung cells harvested on day 6 post infection after in vitro stimulation with 5 μg/mL of M2e, N1 NA (A/Vietnam/1203/2004 H5N1) or N2 (A/Brisbane/10/2007) NA pooled peptides. (A) Representative flow profiles of IFN-γ+CD4 + T cells gated in percentages. (B) IFN-γ+CD4 + T cells specific for M2e peptide (red bar) or N1 NA peptide pools (blue bar). (C and D) IFN- γ+CD8 + T cells to M2e or N1 NA peptide pools. At day 6 following A/Phil/1982 (H3N2) challenge, (E) representative flow profiles of IFN-γ+CD4 + T cells gated in percentages. (F) IFN- γ+CD4 + T cells specific for M2e (red bar) or N2 NA (A/Brisbane/10/2007) peptide pools (green bar). (G) IFN- γ+CD8 + T cells to M2e (red bar) or N2 NA (green bar) peptide pools. (H-J) Lung viral titers at day 6 post lethal dose infection with (H) rgA/VN/2004 H5N1, (I) A/Phil (H3N2), and (J) rgA/SH (H7N9) by an egg inoculation assay in 10-day embryonated chicken eggs. EID50: 50% egg infectious dose. The statistical significances were performed with one-way ANOVA with Tukey’s Multiple Comparison test and indicated as *, P < 0.05; **, P < 0.01; ***, P < 0.001; ns, no significant difference between two compared groups.
Fig 6
Fig 6. m-cNA-M2e VLP vaccination induces humoral and cellular immune responses and confers cross protection against influenza A viruses in aged mice.
BALB/c mice (14-months old, n = 10 per group) were intramuscularly immunized with m-cNA-M2e VLP (10 μg) prime-boost at a 3-week interval. (A-C) Concentrations of IgG and isotype antibodies specific for M2e, N2 NA (A/Brisbane/10/2007 H3N2), and N1 NA (A/California/4/2009 H1N1) protein in boost immune sera from aged mice. (D-F) Body weight changes monitored daily for 14 days and survival rates after challenge with influenza A viruses. (D) A/Phil/1982 H3N2 (3xLD50, 7x10 EID50), (E) A/Cal/2009 H1N1 (3xLD50, 2x10⁴ EID50), (F) rgA/SH/2013 H7N9 (H7 HA, N9 NA from A/Shanghai/2013) (3xLD50, 5.6x10³ EID50). (G) NA inhibition activity in 40-fold diluted boost immune sera against A/Phil (H3N2) virus by ELLA. (H) Lung viral titers at day 6 post infection with A/Phil (H3N2). (I) Antigen-specific IgG levels in mLN cells collected at day 6 post challenge with A/Phil (H3N2) after in vitro culture with M2e (4 μg/ml) or N2 NA protein (A/Brisbane/10/2007 H3N2, 200 ng/mL) for 1 (D1) or 5 (D5) days. (J) IFN-γ cytokine secreting spots in lung cells after stimulation with 5 μg/mL of M2e or N2 NA (A/Brisbane/10/2007, H3N2) pooled peptide. (K) IFN-γ secreting CD4 T cells in lungs after in vitro stimulation with 5 μg/mL of M2e or N2 NA pooled peptide by intracellular cytokine staining and flow cytometry. The statistical significances were performed with one-way ANOVA with Tukey’s Multiple comparison test or two-way ANOVA with Bonferroni posttest and indicated as *, P < 0.05; **, P < 0.01; ***, P < 0.001.
Fig 7
Fig 7. IgG antibodies recognizing cell surface viral antigens and ADCC functional activities by m-cNA-M2e VLP-vaccination.
(A-C) IgG antibodies recognizing cell surface viral antigens. MDCKs were infected with influenza A viruses (A/Nanchang/933/1995 H3N2, A/California/04/2009 H1N1, and rgA/Vietnam/1203/2004 H5N1). The levels of IgG binding to virus antigens expressed on MDCKs were determined by ELISA. Binding reactivity of immune sera to H3N2- (A), H1N1- (B), H5N1- (C) infected MDCKs. (D-F) ADCC reporter assays of antisera from immunized mice, against MDCK target cells infected with A/Nanchang/933/1995 (H3N2) (D), A/California/04/2009 (H1N1) (E), and rgA/VN/1203/2004 H5N1 (F). Subsequently, the ADCC reporter assay was performed using Jurkat effector cells expressing mouse FcrRIII, and the relative luminescence unit (RLU) was measured. The statistical significances were performed with two-way ANOVA with Bonferroni posttest and indicated as **, P < 0.01; ***,###, P < 0.001 (compared among the m-cNA-M2e and PBS or monomeric cN control groups); ns, no significant difference between two compared groups.
Fig 8
Fig 8. The roles of immune sera and T cell responses in conferring protection.
(A) Experiment schematic diagram to determine the roles of immune sera. Naïve mice (n = 3 per group) were intranasally infected with a mixture of influenza virus A/Phil H3N2 (4×LD50, 3.7x10² EID50) and immune sera from the m-cNA-M2e VLP, 5×M2e VLP, cN2 VLP, or naïve control groups. (B) Weight changes and survival rates for 14 days. (C-D) Contribution of T cells to protection in m-cNA-M2e VLP vaccinated mice. The statistical significances are indicated as *,#,+, P < 0.05; **,##, P < 0.01; ***,###,+++, P < 0.001 and bars mark the comparing groups. (C) Experiment schematic diagram to determine the roles of T cells. (D) Flow profiles to represent the depletion efficacy of CD4 T cells and CD8 T cells in m-cNA-M2e VLP vaccinated mice (n = 4 per group) by intraperitoneal injection with anti-CD4 (clone GK1.5) or anti-CD8 (clone 53.6.7) antibodies. (E) Weight changes and survival rates for 14 days in m-cNA-M2e VLP vaccinated mice with or without T cell depletion after challenge with A/Phil H3N2 virus (4×LD50, 3.7x10² EID50). The statistical significances are indicated as *,#,+, P < 0.05; **,##, P < 0.01; ***,###,+++, P < 0.001 and bars mark the comparing groups.

Similar articles

Cited by

References

    1. Zimmerman RK, Nowalk MP, Chung J, Jackson ML, Jackson LA, Petrie JG, et al.. 2014–2015 Influenza Vaccine Effectiveness in the United States by Vaccine Type. Clin Infect Dis. 2016;63(12):1564–73. doi: 10.1093/cid/ciw635 ; PubMed Central PMCID: PMC5146719. - DOI - PMC - PubMed
    1. CDC. Seasonal Influenza Vaccine Effectiveness, 2004–2019. https://wwwcdcgov/flu/vaccines-work/effectiveness-studieshtm#figure.
    1. Krammer F, Fouchier RAM, Eichelberger MC, Webby RJ, Shaw-Saliba K, Wan H, et al.. NAction! How Can Neuraminidase-Based Immunity Contribute to Better Influenza Virus Vaccines? MBio. 2018;9(2). doi: 10.1128/mBio.02332-17 ; PubMed Central PMCID: PMC5885027. - DOI - PMC - PubMed
    1. Kilbourne ED, Johansson BE, Grajower B. Independent and disparate evolution in nature of influenza A virus hemagglutinin and neuraminidase glycoproteins. Proc Natl Acad Sci U S A. 1990;87(2):786–90. Epub 1990/01/01. doi: 10.1073/pnas.87.2.786 . - DOI - PMC - PubMed
    1. Cohen M, Zhang XQ, Senaati HP, Chen HW, Varki NM, Schooley RT, et al.. Influenza A penetrates host mucus by cleaving sialic acids with neuraminidase. Virol J. 2013;10:321. Epub 2013/11/23. doi: 10.1186/1743-422X-10-321 ; PubMed Central PMCID: PMC3842836. - DOI - PMC - PubMed

Publication types