. 2022 Aug 25;17(8):e0273469.
doi: 10.1371/journal.pone.0273469. eCollection 2022.

Measuring the impact of social-distancing, testing, and undetected asymptomatic cases on the diffusion of COVID-19

Affiliations

Measuring the impact of social-distancing, testing, and undetected asymptomatic cases on the diffusion of COVID-19

Seungyoo Jeon. PLoS One. .

Abstract

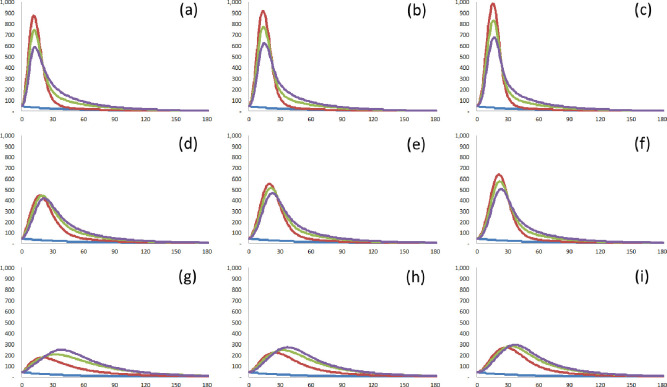
The key to overcoming COVID-19 lies, arguably, in the diffusion process of confirmed cases. In view of this, this study has two main aims: first, to investigate the unique characteristics of COVID-19-for the existence of asymptomatic cases-and second, to determine the best strategy to suppress the diffusion of COVID-19. To this end, this study proposes a new compartmental model-the SICUR model-which can address undetected asymptomatic cases and considers the three main drivers of the diffusion of COVID-19: the degree of social distancing, the speed of testing, and the detection rate of infected cases. Taking each country's situation into account, it is suggested that susceptible cases can be classified into two categories based on their sources of occurrence: internal and external factors. The results show that the ratio of undetected asymptomatic cases to infected cases will, ceteris paribus, be 6.9% for South Korea and 22.4% for the United States. This study also quantitatively shows that to impede the diffusion of COVID-19: firstly, strong social distancing is necessary when the detection rate is high, and secondly, fast testing is effective when the detection rate is low.


Conflict of interest statement

The author has declared that no competing interests exist.

Figures

Fig 1
Fig 1. Structure map of the SICUR model.
Fig 2
Fig 2. Three kinds of connected graphs (the number of nodes = 7 / the sum of degrees = 12) are based on the heterogeneity of networks.
The example network with—(a) high heterogeneity. (b) intermediate heterogeneity. (c) low heterogeneity. The number of links for each node in—(d) the network A. (e) the network B. (f) the network C. The plot (x-axis = the number of links r / the y-axis = the number of nodes with r links) for—(g) the network A. (h) the network B. (i) the network C. There are three kinds of graphs based on the heterogeneity of the networks. If the detection of infected cases connected with detected cases is possible, all susceptible nodes (individuals) in the example network A (on the left side) can be detected for three periods at most. For example, node 2 is detected in period 1. Then, node 1, connected with node 2, can be detected in period 2. Since node 1 is connected with all the other nodes, all the left nodes can finally be detected in period 3. If the first detected node is node 1, all the susceptible nodes can be detected within two periods. However, all susceptible nodes in the example network C (on the right side) can be detected for at least four periods. For example, node 4 is detected in period 1, fortunately. Then, the nodes connected with node 4 (nodes 3 and 5) can be detected in period 2. Similarly, nodes 2 and 6 can be detected in period 3. Finally, nodes 1 and 7 can be detected in period 4. If the first detected node is not node 4, the number of periods required to detect all susceptible cases is more than five.
Fig 3
Fig 3. Estimated numbers of confirmed cases in South Korea with the partition based on the sources of occurrence.
(a) The point-wise number of actual confirmed cases (blue vertical line) and the point-wise number of estimated confirmed cases (red solid line). (b) The point-wise number of estimated confirmed cases from the first wave (orange vertical line), the point-wise number of estimated confirmed cases from the rapid global diffusion (green vertical line), the point-wise number of estimated confirmed cases from the second wave (violet vertical line), and the point-wise number of estimated confirmed cases from the third wave (azure vertical line). (c) The cumulative number of actual confirmed cases (blue vertical line) and the cumulative number of estimated confirmed cases (red solid line). (d) The cumulative number of estimated confirmed cases from the first wave (orange vertical line), the cumulative number of estimated confirmed cases from the rapid global diffusion (green vertical line), the cumulative number of estimated confirmed cases from the second wave (violet vertical line), and the cumulative number of estimated confirmed cases from the third wave (azure vertical line).
Fig 4
Fig 4. Estimated numbers of confirmed cases in the United States with the partition based on the sources of occurrence.
(a) The point-wise number of actual confirmed cases (blue vertical line) and the point-wise number of estimated confirmed cases (red solid line). (b) The point-wise number of estimated confirmed cases from the first wave (orange vertical line), and the point-wise number of estimated confirmed cases from the rapid global diffusion (green vertical line). (c) The cumulative number of actual confirmed cases (blue vertical line) and the cumulative number of estimated confirmed cases (red solid line). (d) The cumulative number of estimated confirmed cases from the first wave (orange vertical line), and the cumulative number of estimated confirmed cases from the rapid global diffusion (green vertical line).
Fig 5
Fig 5. Estimated numbers of confirmed cases in South Korea with/without the shift of q.
(a) The point-wise number of actual confirmed cases (blue vertical line), the point-wise number of estimated confirmed cases (red solid line), and the point-wise number of estimated confirmed cases without the shift of the degree of social distancing on October 12 (orange solid line). (b) The cumulative number of actual confirmed cases (blue vertical line), the cumulative number of estimated confirmed cases (red solid line), and the cumulative number of estimated confirmed cases without the shift of the degree of social distancing on October 12 (orange solid line).
Fig 6
Fig 6. Demonstration of the effects of social distancing.
The confirmed cases without a new wave (default; blue solid line), the confirmed cases with q = 0.4 (red solid line), the confirmed cases with q = 0.2 (green solid line), and the confirmed cases with q = 0.1 (violet solid line). (a) A = 1.0, Imed = 3.7. (b) A = 1.0, Imed = 5.6. (c) A = 1.0, Imed = 7.5. (d) A = 0.75, Imed = 3.7. (e) A = 0.75, Imed = 5.6. (f) A = 0.75, Imed = 7.5. (g) A = 0.5, Imed = 3.7. (h) A = 0.5, Imed = 5.6. (i) A = 0.5, Imed = 7.5.
Fig 7
Fig 7. Demonstration of the effects of detection rate.
The confirmed cases without a new wave (blue solid line), the confirmed cases with A = 1.0 (red solid line), the confirmed cases with A = 0.75 (green solid line), and the confirmed cases with A = 0.5 (violet solid line). (a) q = 0.4, Imed = 3.7. (b) q = 0.4, Imed = 5.6. (c) q = 0.4, Imed = 7.5. (d) q = 0.2, Imed = 3.7. (e) q = 0.2, Imed = 5.6. (f) q = 0.2, Imed = 7.5. (g) q = 0.1, Imed = 3.7. (h) q = 0.1, Imed = 5.6. (i) q = 0.1, Imed = 7.5.
Fig 8
Fig 8. Demonstration of the effects of the speed of testing.
The confirmed cases without a new wave (blue solid line), the confirmed cases with Imed = 3.7 (red solid line), the confirmed cases with Imed = 5.6 (green solid line), and the confirmed cases with Imed = 7.5 (violet solid line). (a) q = 0.4, A = 1.0. (b) q = 0.4, A = 0.75. (c) q = 0.4, A = 0.5. (d) q = 0.2, A = 1.0. (e) q = 0.2, A = 0.75. (f) q = 0.2, A = 0.5. (g) q = 0.1, A = 1.0. (h) q = 0.1, A = 0.75. (i) q = 0.1, A = 0.5.

Similar articles

References

    1. Nishiura H, Kobayashi T, Miyama T, Suzuki A, Jung SM, Hayashi K, et al.. Estimation of the asymptomatic ratio of novel coronavirus infections (COVID-19). Int J Infect Dis. 2020. May;94:154–155. doi: 10.1016/j.ijid.2020.03.020 - DOI - PMC - PubMed
    1. Bjørnstad ON, Shea K, Krzywinski M, Altman N. Modeling infectious epidemics. Nat Methods. 2020;17:455–456. doi: 10.1038/s41592-020-0822-z - DOI - PubMed
    1. Okabe Y, Shudo A. A Mathematical Model of Epidemics—A Tutorial for Students. Mathematics. 2020;8(7):1174. doi: 10.3390/math8071174 - DOI
    1. Cobey S. Modeling infectious disease dynamics. Science. 2020;368:713–714. doi: 10.1126/science.abb5659 - DOI - PubMed
    1. Kermack WO, McKendrick AG. A contribution to the mathematical theory of epidemics. Proceedings of the royal society of London Series A, Containing papers of a mathematical and physical character. 1927;115(772):700–721.