. 2022 Aug 25;18(8):e1010522.
doi: 10.1371/journal.ppat.1010522. eCollection 2022 Aug.

The baseline immunological and hygienic status of pigs impact disease severity of African swine fever

Affiliations

The baseline immunological and hygienic status of pigs impact disease severity of African swine fever

Emilia Radulovic et al. PLoS Pathog. .

Abstract

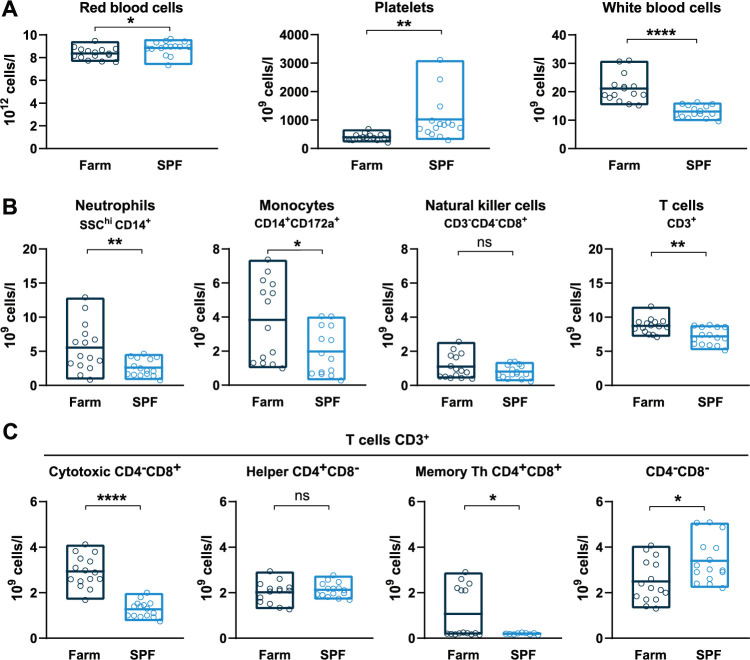
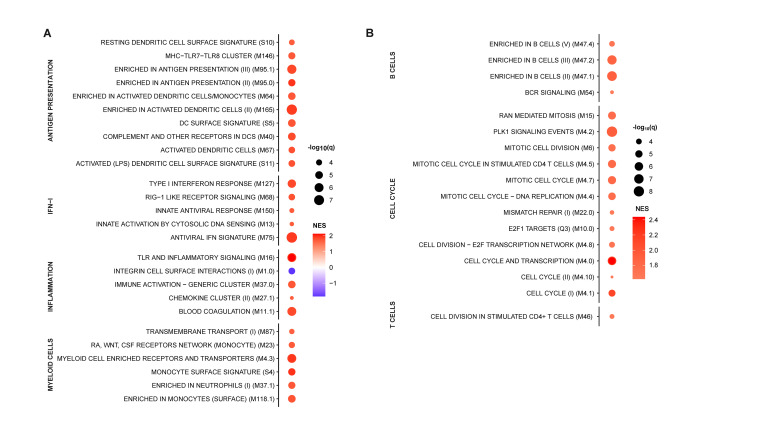
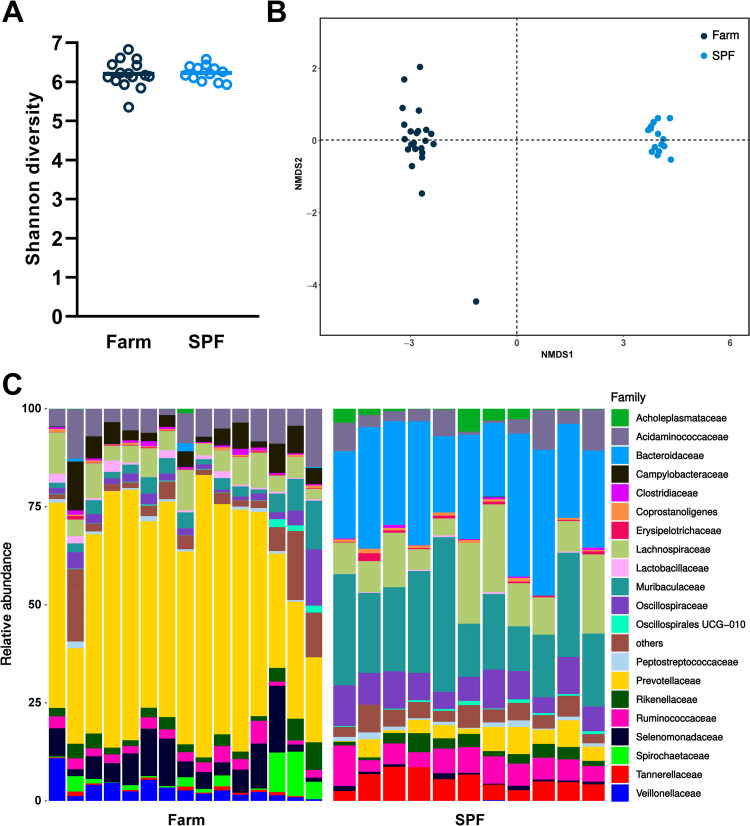
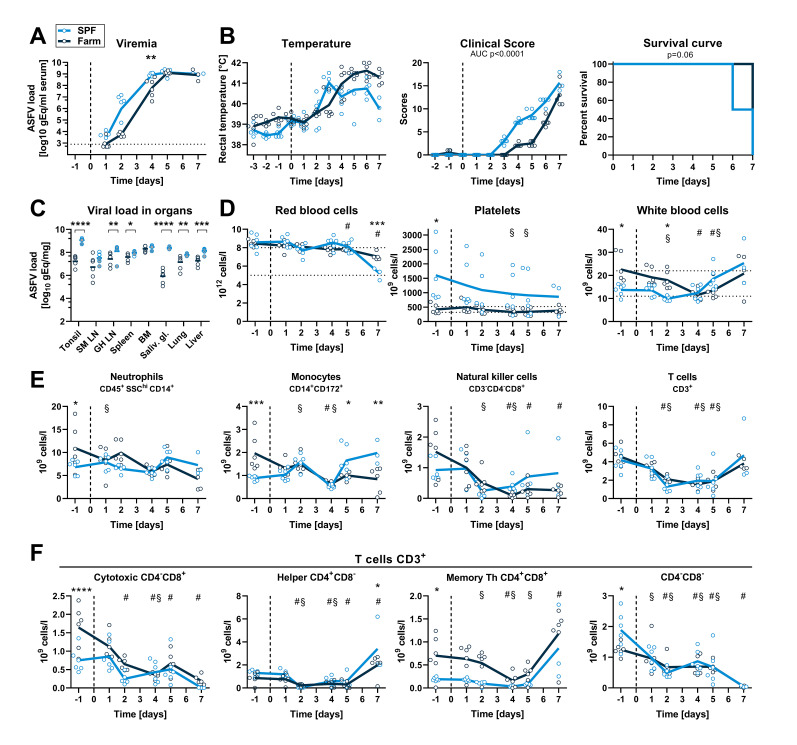
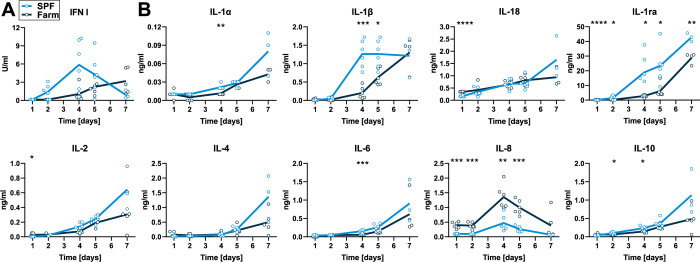
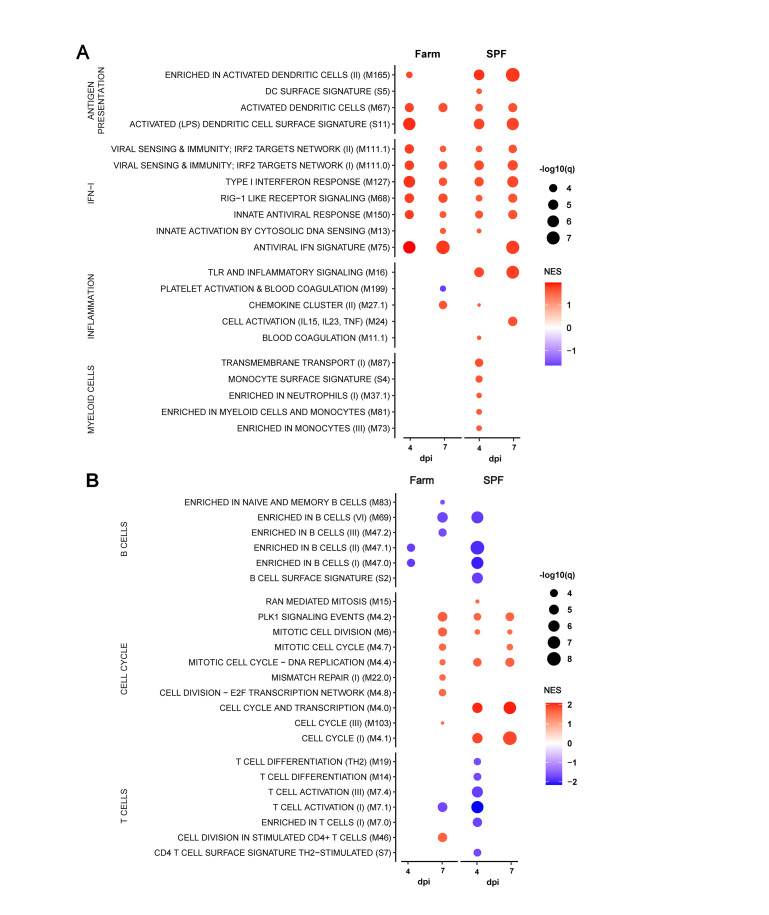
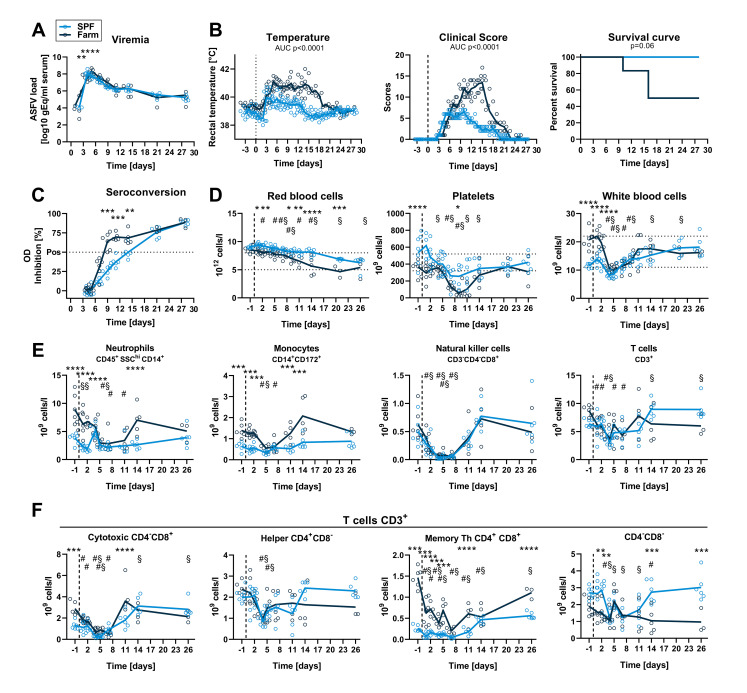
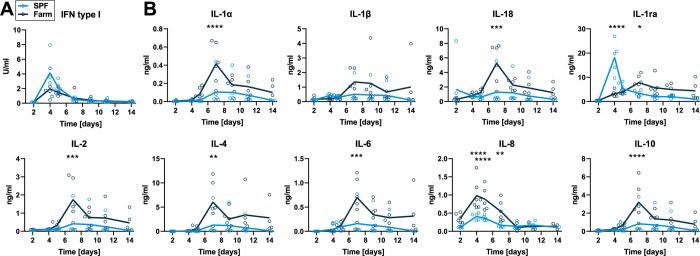
African Swine Fever virus (ASFV) is a large double-enveloped DNA virus of the Asfarviridae family that causes a lethal hemorrhagic disease in domestic pigs and wild boars. Since 2007, a highly virulent genotype II strain has emerged and spread in Europe and South-East Asia, where millions of animals succumbed to the disease. Field- and laboratory-attenuated strains of ASFV cause highly variable clinical disease severity and survival, and mechanisms remain unclear. We hypothesized that the immunological and hygienic status of pigs is a determinant of ASF disease course. Here we compared the immunological profile at baseline and in response to ASFV infection in specific pathogen-free (SPF) and farm-raised Large White domestic pigs. At steady state, SPF pigs showed lower white blood cell counts and a lower basal inflammatory and antiviral transcriptomic profile compared to farm pigs, associated with profound differences in gut microbiome composition. After inoculation with a highly virulent ASFV genotype II strain (Armenia 2008), severe clinical signs, viremia and pro-inflammatory cytokines appeared sooner in SPF pigs, indicating a reduced capacity to control early virus replication. In contrast, during infection with an attenuated field isolate (Estonia 2014), SPF pigs presented a milder and shorter clinical disease with full recovery, whereas farm pigs presented severe protracted disease with 50% lethality. Interestingly, farm pigs showed higher production of inflammatory cytokines, whereas SPF pigs produced more anti-inflammatory IL-1ra early after infection and presented a stronger expansion of leukocytes in the recovery phase. Altogether, our data indicate that the hygiene-dependent innate immune status has a double-edge sword impact on immune responses in ASF pathogenesis. While the higher baseline innate immune activity helps the host in reducing initial virus replication, it promotes immunopathological cytokine responses, and delays lymphocyte proliferation after infection with an attenuated strain. Such effects should be considered for live vaccine development and vigilance.


Conflict of interest statement

The authors have declared that no competing interests exist.

Figures

Fig 1
Fig 1. Basal hematologic and immune profiles of SPF and farm pigs.
(A) RBC, PLT, and WBC counts in uninfected pigs. (B) Immunophenotyping of blood leukocytes (CD45+). The percentage of each subset was determined by flow cytometry gating (S2 Fig) and the absolute numbers were calculated using WBC counts. (C) T cell subsets gated from CD3+ T cells. (A, B, C) Each point represents the value for a single pig, horizontal lines and boxes represent the mean and range. Data are from 2 independent experiments (n = 15 per SPF or farm groups) and were analyzed using unpaired t test; ns, not significant; * p<0.05; ** p<0.01; **** p<0.0001.
Fig 2
Fig 2. Whole blood transcriptome module (BTM) analysis of farm pigs compared to SPF pigs.
Data points show significantly different (A) innate and (B) adaptive immune cell BTMs between farm and SPF pigs using SPF leukocytes as reference in steady state. BTM modulations were calculated as normalized enrichment scores (NES) using GSEA. Increased (red) or decreased (blue) BTMs in farm compared to SPF pigs are shown with color intensity proportional to the NES and the size of the data points proportional to the statistical q value. Data is from n = 12/group from 2 independent experiments.
Fig 3
Fig 3. Fecal microbiota composition at steady state in farm and SPF pigs.
(A,B) Shannon diversity and non-metric multidimensional scanning (NMDS) ordination of gut microbiome of pigs. Each data point represents the value for one animal. (C) Relative abundance of the most frequent bacterial families. Data are from 2 independent experiments (farm group n = 15; SPF group n = 11).
Fig 4
Fig 4. Virus load, clinical signs and blood cell profiles after infection with virulent ASFV strain Armenia 2008.
SPF and farm pigs were inoculated intramuscularly with ASFV Armenia 2008. Blood samples were taken 1 day before infection and 1, 2, 4, 5, and 7 dpi. (A) Viremia was determined in serum by qPCR at indicated time points. (B) Rectal temperature, clinical score, and survival were reported daily. (C) Virus load in organs was measured by qPCR on the day of euthanasia (6 dpi: animal found dead, grey circles crossed (SPF n = 1), 6 dpi: grey circles (SPF n = 2), 7 dpi: empty circles (SPF n = 3, farm n = 6)). SM LN, submandibulary lymph node; GH LN, gastrohepatic LN; BM, bone marrow; Saliv. gl., salivary gland. (D) RBC, PLT, and WBC counts in blood at indicated dpi. (E) Immunophenotyping of blood leukocytes (CD45+). Percentage of each subset was determined by flow cytometry gating (S2 Fig) and absolute numbers were calculated using WBC counts. (F) T cell subsets were gated from CD3+ T cells. (A-F) Each data point represents the value for one pig, lines indicate the mean of each group. Data are from a single experiment (n = 6 pigs/group, except 7 dpi, where n = 3 for SPF group). (A, C-F) Differences between SPF and farm groups were analyzed by unpaired t test at each dpi with Holm-Sidak’s correction for multiple comparisons. * p<0.05; ** p<0.01; *** p<0.001; **** p<0.0001. (B) Differences between groups for body temperature and clinical scores were analyzed by comparing the area under the curve (AUC). Differences in survival were analyzed by Log-rank (Mantel-Cox) analysis. (D-F) Significant differences at different dpi compared to the respective baseline (-1 dpi) are indicated for SPF (§, p<0.05) and farm (#, p<0.05); data were analyzed using mixed model analysis followed by Dunnett’s multiple comparison.
Fig 5
Fig 5. Serum cytokines after infection with virulent ASFV Armenia 2008.
Blood samples were taken on 1, 2, 4, 5, and 7 dpi. (A) IFN type I activity in serum was measured by bioassay. (B) Cytokine levels were determined by multiplex ELISA. Data points show values for individual animals and lines indicate mean of each group at indicated dpi. Differences between SPF and farm groups were analyzed by unpaired t test at each dpi with Holm-Sidak’s correction for multiple comparisons (n = 6 pigs/group, except 7 dpi, where n = 3 for SPF group). * p<0.05, ** p<0.01, *** p<0.001, **** p<0.0001.
Fig 6
Fig 6. BTM analysis after infection with virulent ASFV Armenia 2008.
Data shows only the significantly different (A) innate and (B) adaptive immune cell BTMs in farm and SPF pigs at 4 and 7 dpi relative to their respective BTM at baseline (day 0). BTM modulations were calculated as normalized enrichment scores (NES) using GSEA. Increased (red) or decreased (blue) BTMs are shown relative to each group’s respective baseline with color intensity proportional to the NES and the size of the data points proportional to the q value. Data is from n = 6/group, except for 7dpi where n = 3 for SPF group.
Fig 7
Fig 7. Virus load, clinical signs, and blood cell profiles after infection with attenuated ASFV strain Estonia 2014.
SPF and farm pigs were inoculated intramuscularly with ASFV Estonia 2014 and blood samples were taken 1 day before infection and 1, 2, 4, 5, 7, 11, 14 and 26 dpi. All surviving animals were euthanized on 28 dpi. (A) Viremia was determined in serum by qPCR. (B) Rectal temperature, clinical score, and survival were reported daily. (C) Seroconversion was tested by ELISA. (D) RBC, PLT, and WBC counts in blood at indicated dpi. (E) Immunophenotyping of blood leukocytes (CD45+). Percentage of each subset was determined by flow cytometry gating (S2 Fig) and absolute numbers were calculated using WBC counts. (F) T cell subsets were gated from CD3+ T cells. (A-F) Data points represent values for individual pigs, lines indicate the mean of each group. Data are from a single experiment (n = 6 pigs/group, except from 11 dpi (n = 5) and from 15 dpi (n = 3) for farm group). (A, C-F) Differences between SPF and farm groups were analyzed by unpaired t test at each dpi with Holm-Sidak’s correction for multiple comparisons. * p<0.05; ** p<0.01; *** p<0.001; **** p<0.0001. (B) Differences between groups for body temperature and clinical scores were analyzed by comparing the area under the curve (AUC). Differences in survival were analyzed by Log-rank (Mantel-Cox) analysis. (D, F) Significant differences in blood cell subsets at different dpi compared to the respective baseline (-1 dpi) are indicated for SPF (§, p<0.05) and farm (#, p<0.05); data were analyzed using mixed model analysis followed by Dunnett’s multiple comparison.
Fig 8
Fig 8. Serum cytokines after infection with attenuated ASFV Estonia 2014.
Blood samples were taken on 2, 4, 5, 7, 9, 11, and 14 dpi. (A) IFN type I activity in serum was measured by bioassay. (B) Cytokine levels were determined by multiplex ELISA. Data points show values for individual animals and lines indicate mean of each group at indicated dpi. Differences between SPF and farm groups were analyzed by unpaired t test at each dpi with Holm-Sidak’s correction for multiple comparisons (n = 6 pigs/group, except on 14 dpi, where n = 5 for farm group). * p<0.05, ** p<0.01, *** p<0.001, **** p<0.0001.
Fig 9
Fig 9. BTM analysis after infection with attenuated ASFV Estonia 2014.
Data shows only the significantly different (A) innate and (B) adaptive immune cell BTMs in farm and SPF pigs at 4, 7 and 11 dpi relative to their respective BTM at baseline (day 0). BTM modulations were calculated as normalized enrichment scores (NES) using GSEA. Increased (red) or decreased (blue) BTMs are shown relative to each group’s respective baseline with color intensity proportional to the NES and the size of the data points proportional to the q value. Data is from n = 6/group.

Similar articles

Cited by

References

    1. Montgomery RE. On A Form of Swine Fever Occurring in British East Africa (Kenya Colony). Journal of Comparative Pathology and Therapeutics. 1921;34:159–91. doi: 10.1016/S0368-1742(21)80031-4 EUSTACEMONTGOMERY1921159. - DOI
    1. Gaudreault NN, Madden DW, Wilson WC, Trujillo JD, Richt JA. African Swine Fever Virus: An Emerging DNA Arbovirus. Front Vet Sci. 2020;7:215. doi: 10.3389/fvets.2020.00215 ; PubMed Central PMCID: PMC7237725. - DOI - PMC - PubMed
    1. Alkhamis MA, Gallardo C, Jurado C, Soler A, Arias M, Sanchez-Vizcaino JM. Phylodynamics and evolutionary epidemiology of African swine fever p72-CVR genes in Eurasia and Africa. PLoS One. 2018;13(2):e0192565. doi: 10.1371/journal.pone.0192565 . - DOI - PMC - PubMed
    1. Sauter-Louis C, Conraths FJ, Probst C, Blohm U, Schulz K, Sehl J, et al.. African Swine Fever in Wild Boar in Europe-A Review. Viruses. 2021;13(9). doi: 10.3390/v13091717 ; PubMed Central PMCID: PMC8472013. - DOI - PMC - PubMed
    1. Zhou X, Li N, Luo Y, Liu Y, Miao F, Chen T, et al.. Emergence of African Swine Fever in China, 2018. Transbound Emerg Dis. 2018;65(6):1482–4. doi: 10.1111/tbed.12989 . - DOI - PubMed

Publication types