. 2022 Oct 17;82(20):3763-3773.
doi: 10.1158/0008-5472.CAN-22-1215.

Notch Signaling Promotes Mature T-Cell Lymphomagenesis

Affiliations

Notch Signaling Promotes Mature T-Cell Lymphomagenesis

Xin Gao et al. Cancer Res. .

Abstract

Peripheral T-cell lymphomas (PTCL) are agressive lymphomas that develop from mature T cells. The most common PTCLs are genetically, molecularly, and clinically diverse and are generally associated with dismal outcomes. While Notch signaling plays a critically important role in both the development of immature T cells and their malignant transformation, its role in PTCL is poorly understood, despite the increasingly appreciated function of Notch in regulating the proliferation and differentiation of mature T cells. Here, we demonstrate that Notch receptors and their Delta-like family ligands (DLL1/DLL4) play a pathogenic role in PTCL. Notch1 activation was observed in common PTCL subtypes, including PTCL-not otherwise specified (NOS). In a large cohort of PTCL-NOS biopsies, Notch1 activation was significantly associated with surrogate markers of proliferation. Complementary genetically engineered mouse models and spontaneous PTCL models were used to functionally examine the role of Notch signaling, and Notch1/Notch2 blockade and pan-Notch blockade using dominant-negative MAML significantly impaired the proliferation of malignant T cells and PTCL progression in these models. Treatment with DLL1/DLL4 blocking antibodies established that Notch signaling is ligand-dependent. Together, these findings reveal a role for ligand-dependent Notch signaling in driving peripheral T-cell lymphomagenesis.

Significance: This work demonstrates that ligand-dependent Notch activation promotes the growth and proliferation of mature T-cell lymphomas, providing new therapeutic strategies for this group of aggressive lymphomas.


Conflict of interest statement

Disclosure of Conflicts of Interest: The authors declare no potential conflicts of interest.

Figures

Figure 1.
Figure 1.
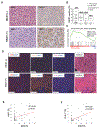
NICD1 is expressed in PTCL, NOS and associated with proliferation. (A, B) Diagnostic biopsies from PTCL, NOS (n=56), AITL/TFH (n=12), ALCL (ALK+ and ALK−, n=15), and less common PTCL subtypes (n=8) were stained for NICD1. A representative NICD1 negative and NICD1 positive PTCL, NOS case are shown in (A) and the data summarized in (B). At least 20% of malignant T cells (as determined by morphologic and immunophenotypic assessment) were NICD1+ in 100% of AITL cases examined. NICD1 expression was similarly determined in the other subtypes indicated, and ≥20% positivity utilized as a cut-off, and the percentage of NICD+ cases indicated (in B). (C) Notch pathway enrichment analysis was performed using microarray data obtained from PTCL, NOS and benign lymph nodes. (D) Multispectral imaging of CD3+CD8− PTCL, NOS cases (n=50), stratified by the extent of NICD1 expression, was performed using lymphoma (CD3, CD8, CD20)-, TME (CD68, CD163)-, and proliferation (Ki67, PLK1)-informative markers. CD3, Ki-67, and PLK1 stains in representative NICD1− and NICD1+ cases are shown. (E-F) As before, the extent of NICD1 expression as a percentage of PTCL cells was determined by immunohistochemistry. The proliferation-associated markers Ki67 (E) and PLK-1 (F), expressed as a percentage of CD3+CD8CD20 PTCL cells (E, F) are shown and correlated with NICD1 expression.
Figure 2.
Figure 2.
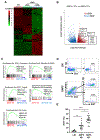
PTCL progression in SNF5-deficient T cells is associated with transcriptional reprogramming. (A) Supervised hierarchical clustering of RNA-seq was performed in sorted CD3+ T cells from littermate control (WT, n=5), CD3+ T cells from young (<4 months of age) SNF55fl/fl, CD4-cre mice without PTCL (SNF5-TCL, n=5), and clonal T cells (CD3+ TCR-Vβ+) from older (> 4 months of age) SNF5fl/fl, CD4-cre mice with PTCL (SNF5 +TCL, n=6). Heat map showing differentially expressed genes is shown. (B) A volcano plot comparing gene expression between SNF5fl/fl, CD4-cre mice without TCL and clonal T cells from older SNF5fl/fl, CD4-cre mice with TCL is shown. (C) Gene set enrichment analysis (GSEA) was performed and enrichment plots for selected pathways, including those that are Notch (shown at right) and c-myc or cell cycle related (shown at left), enriched in SNF5fl/fl, CD4-cre mice with PTCL are shown. (D) Clonal (TCR-Vβ+) and non-clonal (TCR-Vβ) T cells were identified by TCR-Vβ and CD3 expression in lymphoma-bearing mice (SNF5, n=20) and Ki67expression determined by flow cytometry. Open circles represent samples from SNF5fl/fl, p53fl/fl, CD4-Cre+ mice (n=2). (Non-clonal T cells were not observed, or were quantitatively insufficient for gating, in these mice.) Littermate control mice (LM, n=11) were stained with CD3 and Ki67. A representative example is shown in (D), and the data summarized in (E) (* P<0.05, ** P<0.01, *** P<0.001, **** P<0.0001)
Figure 3.
Figure 3.
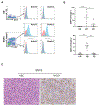
Notch 1 and Notch 2 are highly expressed by PTCL cells. (A, B) The expression of Notch1 and Notch2 (isotype control, orange histogram; anti-Notch1/Notch2, blue histogram) were examined in littermate control (LM, n=5) and lymphoma-bearing SNF5fl/fl p53+/+, CD4-Cre+ (SNF5, closed circles, n=4) and SNF5fl/fl, p53fl/fl, CD4-Cre+ (open circles, n=2) mice. A representative example is shown in (A). Notch1 and Notch2 expression, expressed as ΔMFI was examined on both clonal (Vβ+) and non-clonal (Vβ) T cells, as summarized in (B). (*P<0.05, ** P<0.01, *** P<0.001, **** P<0.0001). (C) Biopsies from LM and SNF5 mice were stained for the Notch intracellular domain (NICD), a representative case is shown.
Figure 4.
Figure 4.
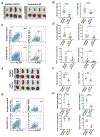
Notch signaling promotes the proliferation of malignant T cells. (A-D), Splenocytes from lymphoma-bearing SNF5fl/fl, p53+/+, CD4-Cre+ (closed circles, •) or SNF5fl/fl, p53fl/fl, CD4-Cre+ (open circles, ○) mice were adoptively transferred into C57BL/6J recipient mice (n=4-5 recipients/experimental group for 4 biological replicates) and recipient mice were treated with isotype control or anti-Notch1/Notch2 antibodies on day 0 and 2 upon engraftment and euthanized 5-7 days after the last dose. Explanted spleens and livers were weighed, a representative example is shown in (A), summarized organ weight is shown in (B). Clonal T cells (CD3++) and Ki67 expression were quantified. A representative example is shown in (C), and summarized in (D). (E-H) Splenocytes from lymphoma-bearing SNF5fl/fl, p53fl/fl, CD4-Cre+ (open circles) mice were adoptively transferred into C57BL/6J recipient mice (n=5 recipients/experimental group for 2 biological replicates) and recipient mice were treated with isotype control or anti-DLL1/DLL4 (Anti-DLL1/4) antibody at day 0, 2, and 7 upon engraftment and euthanized 5-7 days after last dose. Explanted spleens and livers were weighed, a representative example is shown in (E), and organ weight summarized in (F). Clonal (Vβ+) T cells and Ki67 expression was quantified. A representative example is shown in (G), and summarized in (H). (* P<0.05, ** P<0.01, *** P<0.001, **** P<0.0001)
Figure 5.
Figure 5.
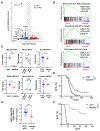
Notch blockade in PTCL inhibits cell proliferation and impairs disease progression. (A) T cells were sorted from SNF5fl/fl, DNMAML+/+, CD4-Cre (n=5) and SNF5fl/fl, DNMAMLfl/fl, CD4-Cre (n=3) mice and RNA-seq was performed. A volcano plot comparing gene expression is shown. (B) Gene set enrichment analysis (GSEA) was performed and enriched pathways are shown. (C) DTX1 and GATA-3 expression was similarly examined in T cells obtained from DNMAML negative (“Notch on”) and DNMAML positive (“Notch off”) T cells, (left). Clonal T cells (CD3++) from short-term isotype control, anti-Notch1/2 or anti-DLI1/4 antibody treated mice were sorted, mRNA was extracted and qRT-PCR was performed to examine the expression of selected Notch target genes. DTX1 and GATA3 expression in treatment group (anti-Notch1/2: closed circles; anti-DLL1/4: open circles) relative to control group is shown (middle). DTX1 and GATA-3 expression in human PTCL, NOS and benign lymph nodes was examined, as indicated (right). (D) Activity score of Notch signaling target genes for human PTCL, NOS (n=68) and benign (n=10) specimens is shown. (E) Event-free survival of SNF5fl/fl, DNMAML+/+, CD4-Cre+ (n=89) and SNF5fl/fl DNMAMLfl/fl or fl/+, CD4-Cre+ (n=38) mice is shown. (F) Splenocytes from lymphoma-bearing SNF5fl/fl, DNMAML+/+, CD4-Cre+ (n=5) and SNF5fl/fl DNMAMLfl/fl or fl/+, CD4-Cre+ (n=4) mice were adoptively transferred into B6 recipients (n=4-5/biologic replicate) and mice were followed for event-free survival (EFS). (* P<0.05, ** P<0.01, ***P<0.001, ****P<0.0001)

References

    1. Iqbal J, Wright G, Wang C, Rosenwald A, Gascoyne RD, Weisenburger DD, Greiner TC, Smith L, Guo S, Wilcox RA, Teh BT, Lim ST, Tan SY, Rimsza LM, Jaffe ES, Campo E, Martinez A, Delabie J, Braziel RM, Cook JR, Tubbs RR, Ott G, Geissinger E, Gaulard P, Piccaluga PP, Pileri SA, Au WY, Nakamura S, Seto M, Berger F, de Leval L, Connors JM, Armitage J, Vose J, Chan WC, Staudt LM, Lymphoma Leukemia Molecular Profiling P, the International Peripheral TcLP. Gene expression signatures delineate biological and prognostic subgroups in peripheral T-cell lymphoma. Blood 2014;123:2915–2923. - PMC - PubMed
    1. Wang T, Feldman AL, Wada DA, Lu Y, Polk A, Briski R, Ristow K, Habermann TM, Thomas D, Ziesmer SC, Wellik LE, Lanigan TM, Witzig TE, Pittelkow MR, Bailey NG, Hristov AC, Lim MS, Ansell SM, Wilcox RA. GATA-3 expression identifies a high-risk subset of PTCL, NOS with distinct molecular and clinical features. Blood 2014;123:3007–3015. - PMC - PubMed
    1. Iqbal J, Wilcox R, Naushad H, Rohr J, Heavican TB, Wang C, Bouska A, Fu K, Chan WC, Vose JM. Genomic signatures in T-cell lymphoma: How can these improve precision in diagnosis and inform prognosis? Blood reviews 2016;30:89–100. - PubMed
    1. Heavican TB, Bouska A, Yu J, Lone W, Amador C, Gong Q, Zhang W, Li Y, Dave BJ, Nairismagi ML, Greiner TC, Vose J, Weisenburger DD, Lachel C, Wang C, Fu K, Stevens JM, Lim ST, Ong CK, Gascoyne RD, Missiaglia E, Lemonnier F, Haioun C, Hartmann S, Pedersen MB, Laginestra MA, Wilcox RA, Teh BT, Yoshida N, Ohshima K, Seto M, Rosenwald A, Ott G, Campo E, Rimsza LM, Jaffe ES, Braziel RM, d’Amore F, Inghirami G, Bertoni F, de Leval L, Gaulard P, Staudt LM, McKeithan TW, Pileri S, Chan WC, Iqbal J. Genetic drivers of oncogenic pathways in molecular subgroups of peripheral T-cell lymphoma. Blood 2019;133:1664–1676. - PMC - PubMed
    1. Wang T, Lu Y, Polk A, Chowdhury P, Zamalloa CM, Fujiwara H, Suemori K, Beyersdorf N, Hristov AC, Lim MS, Bailey NG, Wilcox RA. T-cell Receptor Signaling Activates an ITK/NF-kappaB/GATA-3 axis in T-cell Lymphomas Facilitating Resistance to Chemotherapy. Clin Cancer Res 2017;23:2506–2515. - PMC - PubMed

Publication types