. 2022 Aug 25;18(8):e1010301.
doi: 10.1371/journal.pcbi.1010301. eCollection 2022 Aug.

Archetypal Analysis for population genetics

Affiliations

Archetypal Analysis for population genetics

Julia Gimbernat-Mayol et al. PLoS Comput Biol. .

Abstract

The estimation of genetic clusters using genomic data has application from genome-wide association studies (GWAS) to demographic history to polygenic risk scores (PRS) and is expected to play an important role in the analyses of increasingly diverse, large-scale cohorts. However, existing methods are computationally-intensive, prohibitively so in the case of nationwide biobanks. Here we explore Archetypal Analysis as an efficient, unsupervised approach for identifying genetic clusters and for associating individuals with them. Such unsupervised approaches help avoid conflating socially constructed ethnic labels with genetic clusters by eliminating the need for exogenous training labels. We show that Archetypal Analysis yields similar cluster structure to existing unsupervised methods such as ADMIXTURE and provides interpretative advantages. More importantly, we show that since Archetypal Analysis can be used with lower-dimensional representations of genetic data, significant reductions in computational time and memory requirements are possible. When Archetypal Analysis is run in such a fashion, it takes several orders of magnitude less compute time than the current standard, ADMIXTURE. Finally, we demonstrate uses ranging across datasets from humans to canids.


Conflict of interest statement

I have read the journal’s policy and the authors of this manuscript have the following competing interests: CDB and AGI are co-founders of Galatea Bio Inc.

Figures

Fig 1
Fig 1. Archetypal Analysis pipeline.
The allele counts from both haplotypes of each of N individuals are averaged and then dimensionally-reduced from M SNPs to N − 1 element singular vectors via the SVD. Archetypal Analysis then implements an alternating non-negative matrix factorization algorithm that minimizes a constrained sum of squares to find ancestry proportions (α) and cluster centroids (Z′; archetypes, Z′ = ZVT). Archetypal analysis models the individual genotypes as originating from the admixture of K parental populations, where K is an input parameter. For visualization we create bar plots for proportions of archetype assignments given by the matrix α, and project archetypes Z into a 3D subspace using the first three principal components of the individual genotype sequences.
Fig 2
Fig 2. Principal component analysis and Archetypal Analysis compositional plots for human populations (K = 8).
a), 2-dimensional PCA plot of human continental populations, where groups of individuals are colored by the unique regional genetic components they possess (see legend) b), Compositional plot giving proportional archetype assignment for each individual (points). Points are coloured by the presence of regional genetic components (colored text) and a few example sub-populations are labeled in small black text. Clusters of individuals from the same population are observed on the vertices of the polygon while diagonals (and edges) between vertices indicate admixed individuals. For details on how to interpret compositional plots see Fig G in S1 Text. c), Similar compositional plot showing the results for ADMIXTURE. Note that several ADMIXTURE clusters (A4, A5, A7) are never attained by real samples. See Figs A and B in S1 Text for additional examples of Archetypal Analysis compositional plots for human continental populations.
Fig 3
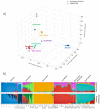
Fig 3. Comparison of ancestry estimates for human populations (K = 8).
a), three-dimensional PCA plot of individuals (small points) with projected archetypes (circles) and ADMIXTURE cluster centers (triangles). b), bar plot where individuals are represented along the horizontal axis as narrow bars ordered by population group. The height of the color for each bar shows the proportional colored cluster assignment for that individual sample. We compare the cluster assignments of ADMIXTURE (top) and Archetypal Analysis (bottom). Correspondence of numbers to labels can be found in Tables A and B in S1 Text.
Fig 4
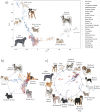
Fig 4. Principal component analysis and Archetypal Analysis compositional plots for domestic dog breeds.
a), two-dimensional PCA plot of domestic dog breeds where groups of dogs are colored by clade. b) and c), proportional composition of each cluster for each individual in coordinate space for K = 5 and K = 15 archetypes respectively. Data points are coloured by clade and archetype representatives are shown as drawings. Gradients between vertices indicate combinations between breeds. (We thank Ines de Vilallonga for her dog breed illustrations).
Fig 5
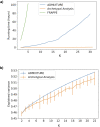
Fig 5. Performance metrics analysis.
a), runtime analysis for FRAPPE, ADMIXTURE and Archetypal Analysis for K = 2 to K = 30. Time is expressed in units of accumulated hours. Note that for FRAPPE we only include up to K = 5 due to computational limitations. b), explained variance analysis comparison for ADMIXTURE and Archetypal analysis for K = 2 to K = 22. Results are averaged over five distinct random seed values for each value of K and the ranges observed are shown as vertical bars.
Fig 6
Fig 6. Comparison of cluster centroids from different methods.
Cluster centers learned by ADMIXTURE, ADMIXTURE with sparsity regularization, Archetypal Analysis, K-Means, and K-Medoids for K = 4 are plotted as solid circles while the underlying samples are plotted as small blue points. Regularization in ADMIXTURE is introduced with lambda = 500 and epsilon = 0.1.

References

    1. Pritchard JK, Stephens M, Donnelly P. Inference of population structure using multilocus genotype data. Genetics. 2000;155(2):945–59. doi: 10.1093/genetics/155.2.945 - DOI - PMC - PubMed
    1. Tang H, Peng J, Wang P, Risch NJ. Estimation of individual admixture: analytical and study design considerations. Genetic epidemiology. 2005;28(4):289–301. doi: 10.1002/gepi.20064 - DOI - PubMed
    1. Alexander DH, Lange K. Enhancements to the ADMIXTURE algorithm for individual ancestry estimation. BMC Bioinformatics. 2011;12. doi: 10.1186/1471-2105-12-246 - DOI - PMC - PubMed
    1. Reich D, Price AL, Patterson N. Principal component analysis of genetic data. Nature Genetics. 2008;40. doi: 10.1038/ng0508-491 - DOI - PubMed
    1. Diaz-Papkovich A, Anderson-Trocmé L, Ben-Eghan C, Gravel S. UMAP reveals cryptic population structure and phenotype heterogeneity in large genomic cohorts. PLoS genetics. 2019;15(11):e1008432. doi: 10.1371/journal.pgen.1008432 - DOI - PMC - PubMed

Publication types