. 2022 Aug 25;17(8):e0273507.
doi: 10.1371/journal.pone.0273507. eCollection 2022.

Functions of block of proliferation 1 during anterior development in Xenopus laevis

Affiliations

Functions of block of proliferation 1 during anterior development in Xenopus laevis

Corinna Gärtner et al. PLoS One. .

Abstract

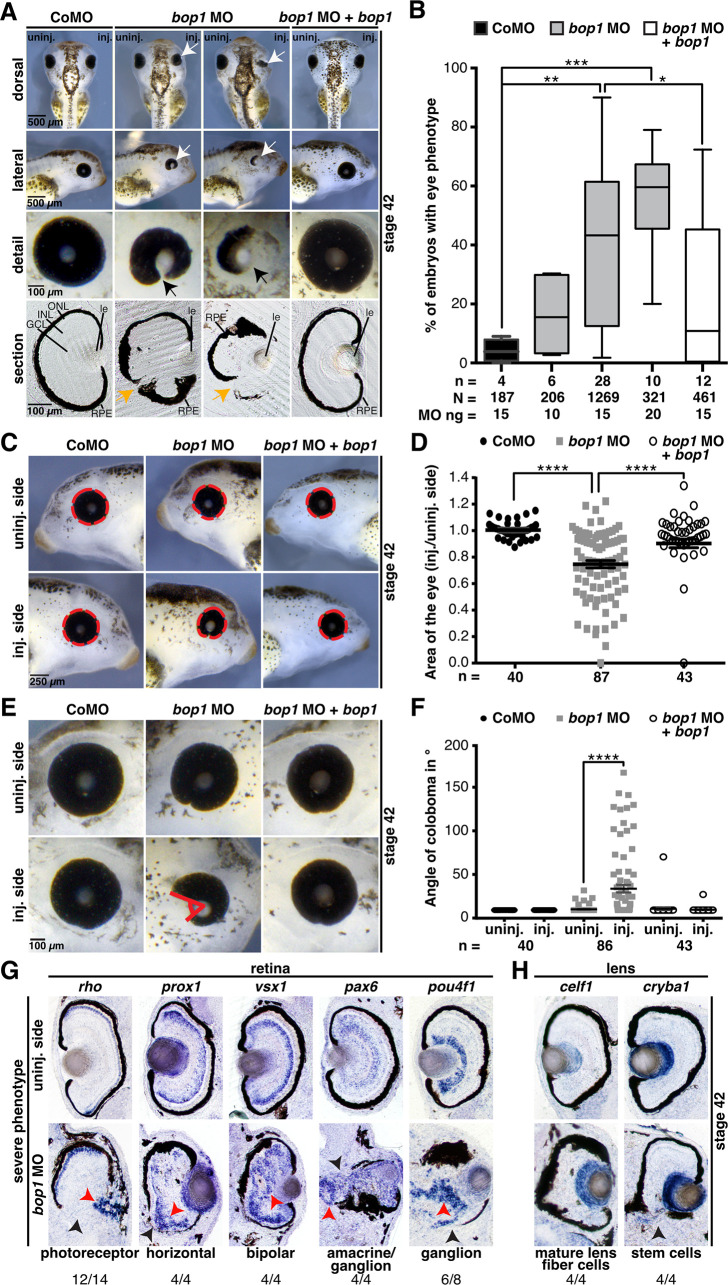
Block of proliferation 1 (Bop1) is a nucleolar protein known to be necessary for the assembly of the 60S subunit of ribosomes. Here, we show a specific bop1 expression in the developing anterior tissue of the South African clawed frog Xenopus laevis. Morpholino oligonucleotide-mediated knockdown approaches demonstrated that Bop1 is required for proper development of the cranial cartilage, brain, and the eyes. Furthermore, we show that bop1 knockdown leads to impaired retinal lamination with disorganized cell layers. Expression of neural crest-, brain-, and eye-specific marker genes was disturbed. Apoptotic and proliferative processes, which are known to be affected during ribosomal biogenesis defects, are not hindered upon bop1 knockdown. Because early Xenopus embryos contain a large store of maternal ribosomes, we considered if Bop1 might have a role independent of de novo ribosomal biogenesis. At early embryonic stages, pax6 expression was strongly reduced in bop1 morphants and synergy experiments indicate a common signaling pathway of the two molecules, Bop1 and Pax6. Our studies imply a novel function of Bop1 independent of ribosomal biogenesis.


Conflict of interest statement

NO authors have competing interests.

Figures

Fig 1
Fig 1. bop1 expression in Xenopus laevis embryos.
A bop1 expression visualized by whole mount in situ hybridization in embryos at the indicated stages. Animal (st. 1), lateral (st. 5), and vegetal (st. 11) views and a sagittal section (st. 11) are shown. At stage 1 and stage 5, bop1 was expressed at the animal pole (orange arrowhead). During gastrulation (st. 11), bop1 expression occurred in the mesoderm surrounding the blastoporus (yellow and blue arrow). B, C Anterior (st. 13 and 23) and lateral (st. 26, st. 30, and st. 35/36) views are shown. At stage 13, bop1 expression was found in the anterior neural plate (red arrowhead). Stage 23 and stage 26 embryos showed expression in the developing eye (black arrowhead), the migrating neural crest cells (NCCs) (black arrow), and the brain (red arrow). At tailbud stages, embryos expressed bop1 in the developing eye (black arrowhead), the brain (red arrow), the branchial (ba) and hyoid arches (ha), the otocyst (white arrow), the blood islands (white arrowhead), and the tail bud. D bop1 expression was shown in the developing eye (transversal section, orientation: Dorsal (upper part) to ventral (lower part)). E, G bop1 expression was shown in the branchial, hyoid, and mandibular arches (ma) (horizontal sections, orientation: Anterior (upper part) to posterior (lower part)). F Embryos expressed bop1 in the brain (b) and in the lens (le) (transversal section, orientation: Dorsal (upper part) to ventral (lower part)). H Expression of bop1 and the two eye-specific marker genes rax and pax6 at stage 13. The black dotted line indicates the level of sagittal sections in h1-h3 (section orientation is dorsal (upper part) to ventral (lower part)). bop1 expression was detected in the optic field (of) (red dotted circle), as was rax and pax6 expression. I Expression of bop1 and the NCC marker gene foxd3 at stage 17. The black dotted line in the left-hand panel represents the level of horizontal sections in i1 and i2 (section orientation is posterior (upper part) to anterior (lower part)). bop1 transcripts were located in the neural plate border positive for foxd3 (nbp) (red dotted line). The grey dotted line in the middle and right-hand panels represents the neural plate (np). J Expression of bop1 and the two eye-specific marker genes rax and prox1 at stage 30. The black dotted line indicates the level of transversal sections shown in j1-j3 (section orientation is dorsal (upper part) to ventral (lower part)). bop1 was expressed in the lens and the ciliary marginal zone (cmz), where retinal progenitor cells are located. Abbreviations: b, brain; ba, branchial arches; cmz, ciliary marginal zone; ev, eye vesicle; ha, hyoid arches; le, lens; ma, mandibular arches; NCC, neural crest cell; np, neural plate; nbp, neural plate border; of, optic field; r, retina; st., stage; WMISH, whole mount in situ hybridization.
Fig 2
Fig 2. bop1 knockdown leads to a cranial cartilage phenotype.
A The head width on the injected side (red line) of embryos at stage 42 injected with bop1 MO and Control MO was compared with the head width on the uninjected side (blue line). The head was significantly smaller upon bop1 knockdown. B Statistical evaluation of data given in A. The head phenotype was rescued by co-injecting bop1 MO with 0.5 ng of Δ5’UTR-bop1 RNA. C Ventral view of Alcian blue-stained cranial cartilages of stage 45 embryos showed a reduced cartilage upon bop1 knockdown. The middle cartilage depicts a mild phenotype and the right one, a severe phenotype. Branchial arches (ba), Meckel´s cartilage (mc), tectum anterius (ta) were severely affected (black arrows). D sox3 served as pan-neural marker gene at stage 13 and was analyzed upon bop1 and Control MO injection. Anterior view of embryos is given. The width of sox3 expression on the injected side (red line) of bop1 MO- and Control MO-injected embryos at stage 13 was compared with the width on the uninjected side (blue line). E sox3 expression significantly increased in Xenopus embryos upon bop1 MO injection. F Statistical evaluation of data given in D showing an increased width of sox3 expression in bop1 morphants. G sox3 expression was analyzed in stage 13 bop1 morphants and control embryos (anterior view is shown). Expression domain was photographed and area was measured via ImageJ. Black boxes indicate area where sox3 expression (red area) was measured. Injected side was compared to uninjected side. H sox3 expression is significantly increased in bop1 morphants. Control MO injection did not alter sox3 expression. I Relative sox3 gene expression was analyzed using real-time qPCR in bop1 MO and Control MO bilaterally injected embryos at stage 13. sox3 expression was normalized to gapdh, odc, and slc35b1 and was significantly increased upon bop1 knockdown compared to control MO injection. J Anterior view of embryos is given. Expression of sox2 was analyzed upon bop1 MO and Control MO injection at stage 13. Neither bop1 MO nor Control MO injection affected sox2 expression. K Statistical analysis of data shown in J. L Relative sox2 gene expression was analyzed using real-time qPCR in bop1 MO and Control MO bilaterally injected embryos at stage 13. sox2 expression was normalized to gapdh, odc, and slc35b1 and was not affected upon bop1 knockdown. M The marker gene foxd3 in anterior neural crest cells in stage 17 embryos injected with 20 ng of bop1 MO or Control MO (black arrow indicates location of altered gene expression). N Around 40% of bop1 MO-injected embryos showed a reduced expression of foxd3 upon bop1 MO injection, but Control MO injection did not show any effect on foxd3 expression. Abbreviations: ba, branchial arches; bop1 MO, block of proliferation 1 morpholino oligonucleotide; CoMO, Control MO; inj., injected side; mc, Meckel´s cartilage; MO, morpholino oligonucleotide; n, number of independent experiments; N, number of injected and analyzed embryos; n.s., non-significant; ta, tectum anterius; uninj., uninjected side. bop1 is the Δ5’UTR-bop1 RNA used for rescues. Error bars indicate standard error of the means; Whiskers indicate in I and L minimum and maximum. *, p ≤ 0.05; **, p ≤ 0.01; ***, p ≤ 0.001; ****, p ≤ 0.0001.
Fig 3
Fig 3. Bop1 is necessary for brain development in Xenopus laevis.
A Sides of embryo brains injected with bop1 MO and Control MO and uninjected sides were compared (ventral view). B Statistical evaluation showed that bop1 knockdown led to a significantly smaller area of the brain. C Xenopus embryos were injected with either 20 ng bop1 MO or Control MO, and pax6 expression in the anterior neural tube was investigated at stage 13 (black arrow indicates location of reduced gene expression). pax6 expression was decreased upon bop1 knockdown. D Statistical evaluation of data given in C. E Area of pax6 expression was investigated at stage 13 embryos via ImageJ. Expression domain was photographed and injected side was compared to uninjected side. Yellow boxes indicate area in which pax6 expression (red area) was measured. F Statistical analysis confirmed reduction of pax6 expression upon bop1 knockdown. G Brain-specific marker genes were analyzed in stage 23 embryos. Embryos were injected with 20 ng bop1 MO or Control MO. Black arrows indicate location of reduced gene expression. H As shown by statistical evaluation, upon bop1 knockdown expression of otx2, en2, egr2, and pax6 was significantly decreased. Control MO-injected embryos showed normal gene expression. Abbreviations: bop1 MO, block of proliferation 1 morpholino oligonucleotide; CoMO, Control MO; inj., injected side; n, number of independent experiments; N, number of injected and analyzed embryos; n.s., non-significant; uninj., uninjected side. Error bars indicate standard error of the means; *, p ≤ 0.05; ***, p ≤ 0.001; ****, p ≤ 0.0001.
Fig 4
Fig 4. bop1 knockdown impairs proper eye development.
A Sides injected with bop1 MO and Control MO were compared with uninjected sides of embryos. Knockdown of bop1 led to a severe eye phenotype with underdeveloped or malformed eyes (white arrows). A detailed view of the deformed eyes is depicted (black arrows). Vibratome sections showed a deformed retinal pigmented epithelium (RPE) (orange arrows). Control MO-injected embryos showed no eye phenotype. B Statistical evaluation of data given in A. Embryos with Bop1 suppression developed a significantly smaller eye than Control MO-injected embryos. The phenotype increased in a dose-dependent manner and was rescued by co-injecting 0.5 ng of Δ5’UTR-bop1 RNA. C The area of the eye was measured (red dotted circles). Control MO- and bop1 MO-injected sides were compared with uninjected sides. D bop1 knockdown led to significantly smaller eyes. The size of the eye was rescued by co-injecting Δ5’UTR-bop1 RNA. E Measurement of the angle of eye fissures (indicated by red angle). F Statistical analysis of the angle of eye fissures showed that bop1 MO-injected embryos developed colobomas. The coloboma phenotype was rescued by co-injecting bop1 MO with Δ5’UTR-bop1 RNA. G Vibratome sections of bop1 MO-injected embryos showing a severe eye phenotype. Red arrows point to disrupted cell layers of indicated cell types, and black arrows point to disrupted RPE. Specific marker genes for cell layers were used, as described in the main text. Most of the cell types were displaced and disorganized. H Lens-specific cells were unimpaired upon suppression of Bop1. Vibratome sections of embryos showing a severe eye phenotype. The lens-specific marker genes celf1 and cryba1 were used. Some lens fiber cells and stem cells were mildly displaced, but they showed no reduction in expression. Numbers below the columns indicate the number of embryos showing the depicted phenotypes per number of embryos analyzed. Abbreviations: bop1 MO, block of proliferation 1 morpholino oligonucleotide; CoMO, Control MO; GCL, ganglion cell layer; inj., injected side; INL, inner nuclear cell layer; le, lens; n, number of independent experiments; N, number of injected and analyzed embryos; ONL, outer nuclear cell layer; RPE, retinal pigmented epithelium; uninj., uninjected side. bop1 is the Δ5’UTR-bop1 RNA used for rescues. Error bars indicate standard error of the means; Whiskers in B indicate minimum and maximum. *, p ≤ 0.05; **, p ≤ 0.01; ***, p ≤ 0.001; ****, p ≤ 0.0001.
Fig 5
Fig 5. bop1 knockout using the CIRSPR/Cas9 system.
A Experimental setup of CRISPR/Cas9 gene editing experiments. Cas9 protein was pre-assembled with bop1 gRNA #1 to build ribonucleoprotein (RNP) complex. Embryos were injected at one-cell stage for sequencing analysis. Embryos were injected at two-cell stage for phenotypic analysis. B Target site of gRNA #1 on bop1 exon 8. Here shown for chromosome 6L –off note, there are no mismatches between target site on homeologue L and S. C DNA pools of 10 wildtype embryos or 10 bop1 CRISPants were sequenced. Target site of bop1 gRNA #1 is highlighted in blue, protospacer adjacent motif (PAM) sequence in grey, and heterogenous sequence in CRISPants DNA pool in red. CRISPR/Cas9 system successfully introduced mutations. D Injection of bop1 gRNA #1 resulted in smaller eyes (indicated with black arrow) and smaller heads on the injected side, whereas injection of Cas9 protein alone did not affect anterior development. E Statistical analysis of data shown in D. F The head width of the injected side (red line) was compared to the width of the uninjected side (blue line). Black line indicates the midline of the embryo. G Knockout of bop1 led to significantly narrower heads on the injected side. H Area of the eye on the injected side was compared to the area of the eye on the uninjected side. Measured area is indicated by red dotted line. I bop1 CRISPants showed a significantly reduced eye area. Cas9 protein alone did not affect the area of the eye. Abbreviations: bop1 gRNA #1, block of proliferation 1 guide RNA #1; Cas9, CRISPR-associated protein 9; CRISPR, clustered regularly interspaced short palindromic repeats; inj., injected side; n, number of independent experiments; N, number of injected and analyzed embryos; PAM, protospacer adjacent motif; PCR, polymerase chain reaction; RNP, ribonucleoprotein; uninj., uninjected side. Error bars indicate standard error of the means; Whiskers in G and H indicate minimum and maximum. ***, p ≤ 0.001; ****, p ≤ 0.0001.
Fig 6
Fig 6. Eye-specific marker genes upon Bop1 deficiency.
A Xenopus laevis embryos at stage 13 injected with 20 ng bop1 MO or Control MO and analyzed by whole mount in situ hybridization. rax and pax6 served as eye-specific marker genes (black arrow indicates location of altered gene expression). Anterior view of embryos is given. B Quantitative representation of data given in A. C pax6 expression was analyzed in stage 13 bop1 morphants (anterior view is shown). Expression domain was photographed and area was measured via ImageJ. Injected side was compared to uninjected side. Yellow boxes indicate area where pax6 expression (red colored area) was measured. D pax6 expression is significantly reduced on the injected side of bop1 MO-injected embryos. E Stage 23 embryos injected with 20 ng bop1 MO or Control MO. Anterior view is given. rax, otx2, and pax6 were used as eye-specific marker genes (black arrows indicate the location of the altered gene expression). F The expression of all three marker genes was significantly reduced in bop1 morphants. Abbreviations: bop1 MO, block of proliferation 1 morpholino oligonucleotide; CoMO, Control MO; inj., injected side; n, number of independent experiments; N, number of injected and analyzed embryos; n.s., non-significant; uninj., uninjected side. Error bars indicate standard error of the means; *, p ≤ 0.05; **, p ≤ 0.001.
Fig 7
Fig 7. bop1 knockdown affects neither cell proliferation nor apoptosis.
A Embryos were injected with Control or bop1 MO together with 1 ng GFP RNA. At stage 15, embryos were photographed using a fluorescence microscope (8-bit greyscale). Intensity of GFP was analyzed by measuring the mean grey value in the indicated areas (white boxes). Mean intensities were normalized to the control group. Anterior view of embryos is given. B GFP intensity did not differ between Control MO and bop1 MO-injected embryos. C Anterior view of embryos is shown. Phospho histone 3 (pH3) staining of stage 23 embryos showed no difference upon injection of Control MO or bop1 MO. D Statistical analysis of data given in C. E Anterior view of embryos is shown. Terminal deoxynucleotidyl transferase dUTP nick end labeling (TUNEL) staining of stage 23 embryos revealed no difference between Control MO- and bop1 MO-injected embryos. F Statistical evaluation of data given in E. G Embryos were injected with Control MO, bop1 MO, or bop1 MO + 0.5 ng c-myc RNA. At stage 42, embryos were analyzed regarding a phenotype of the anterior tissue. Injected side was compared to uninjected side. White arrows indicate smaller eyes. H Statistical analysis of data shown in G reveals that a rescue of the bop1 MO-induced phenotype is not possible by co-injection of 0.5 ng c-myc RNA. I Embryos were injected with Control MO, bop1 MO, or bop1 MO + tp53 MO and analyzed at stage 42 regarding a phenotype of the anterior tissue. Co-suppression of Bop1 and Tp53 did not rescue the bop1 knockdown-associated phenotype. J Statistical analysis of data given in I. Abbreviations: bop1 MO, block of proliferation 1 morpholino oligonucleotide; c-myc, MYC proto-oncogene; CoMO, Control MO; GFP, green fluorescent protein; inj., injected side; MO, morpholino oligonucleotide; n, number of independent experiments; N, number of injected embryos and analyzed; n.s., non-significant; pH3, phospho histone 3; tp53, tumor protein p53; TUNEL, terminal deoxynucleotidyl transferase dUTP nick end labeling; uninj., uninjected side. Error bars indicate standard error of the means; *, p ≤ 0.05; ****, p ≤ 0.0001.
Fig 8
Fig 8. Pax6 and Bop1 act in the same signaling pathway.
A Xenopus laevis embryos were injected with 30 ng Control MO and 15 ng or 30 ng pax6 MO at eight-cell stage into one animal-dorsal blastomere. At stage 42, embryos were analyzed regarding a phenotype of the anterior tissue. pax6 MO injection resulted in smaller heads and eyes (white arrows). B Statistical evaluation of data given in A. C Embryos were injected at eight-cell stage with bop1 MO alone or in combination with pax6 RNA. Embryos were fixed at stage 42 and analyzed phenotypically. Smaller eyes are indicated with white arrow. D Injection of bop1 MO alone or in combination with pax6 RNA resulted in severe eye phenotypes. E Injection of 5 ng bop1 MO or 5 ng pax6 MO led to a mild eye phenotype in 15% and 27% of the embryos, respectively. The co-injection of both 5 ng bop1 MO and 5 ng pax6 MO resulted in a severe eye phenotype in a more than additive manner (73%). F Statistical analysis of data given in E. Black dotted line indicates sum of embryos showing an eye or head phenotype injected with 5 ng bop1 MO and 5 ng pax6 MO. Abbreviations: bop1 MO, block of proliferation 1 morpholino oligonucleotide; CoMO, Control MO; inj., injected side; MO, morpholino oligonucleotide; n, number of independent experiments; N, number of injected and analyzed embryos; n.s., non-significant; pax6 MO, paired box 6 morpholino oligonucleotide; uninj., uninjected side. Error bars indicate standard error of the means; *, p ≤ 0.05; **, p ≤ 0.01.

Similar articles

Cited by

References

    1. Melnikov S, Ben-Shem A, Garreau de Loubresse N, Jenner L, Yusupova G, Yusupov M. One core, two shells: bacterial and eukaryotic ribosomes. Nat Struct Mol Biol. 2012;19: 560–567. doi: 10.1038/nsmb.2313 - DOI - PubMed
    1. Farley-Barnes KI, Ogawa LM, Baserga SJ. Ribosomopathies: Old Concepts, New Controversies. Trends Genet. 2019;35: 754–767. doi: 10.1016/j.tig.2019.07.004 - DOI - PMC - PubMed
    1. Narla A, Ebert BL. Ribosomopathies: human disorders of ribosome dysfunction. Blood. 2010;115: 3196–3205. doi: 10.1182/blood-2009-10-178129 - DOI - PMC - PubMed
    1. Jenner L, Melnikov S, de Loubresse NG, Ben-Shem A, Iskakova M, Urzhumtsev A, et al.. Crystal structure of the 80S yeast ribosome. Curr Opin Struct Biol. 2012;22: 759–767. doi: 10.1016/j.sbi.2012.07.013 - DOI - PubMed
    1. Kressler D, Hurt E, Baßler J. A Puzzle of Life: Crafting Ribosomal Subunits. Trends Biochem Sci. 2017;42: 640–654. doi: 10.1016/j.tibs.2017.05.005 - DOI - PubMed

Publication types