Meta-Analysis
. 2022 Aug 25;19(8):e1004079.
doi: 10.1371/journal.pmed.1004079. eCollection 2022 Aug.

Urban-rural differences in hypertension prevalence in low-income and middle-income countries, 1990-2020: A systematic review and meta-analysis

Affiliations
Meta-Analysis

Urban-rural differences in hypertension prevalence in low-income and middle-income countries, 1990-2020: A systematic review and meta-analysis

Otavio T Ranzani et al. PLoS Med. .

Abstract

Background: The influence of urbanicity on hypertension prevalence remains poorly understood. We conducted a systematic review and meta-analysis to assess the difference in hypertension prevalence between urban and rural areas in low-income and middle-income countries (LMICs), where the most pronounced urbanisation is underway.

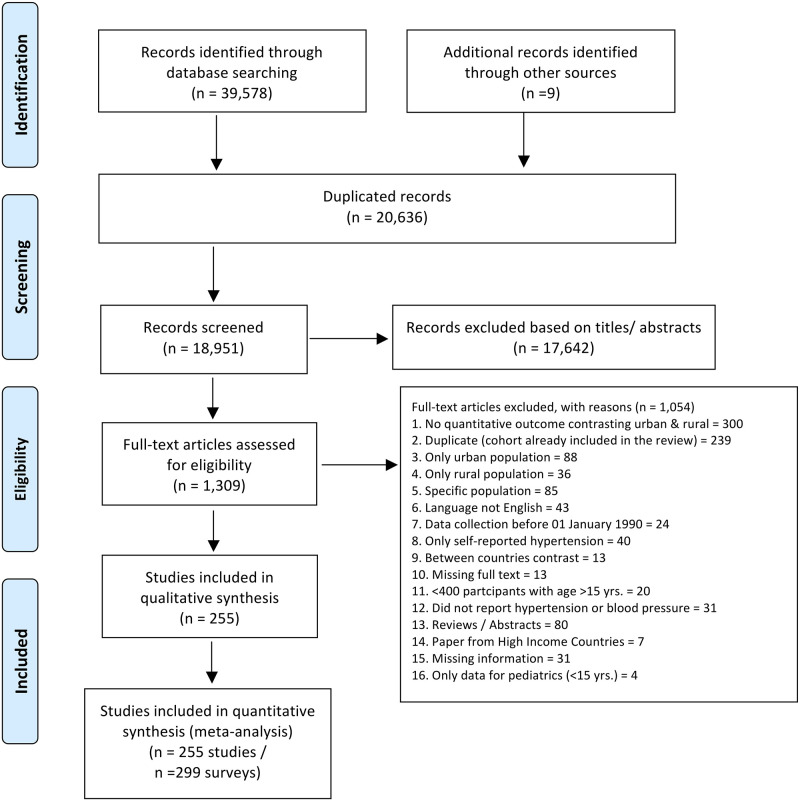
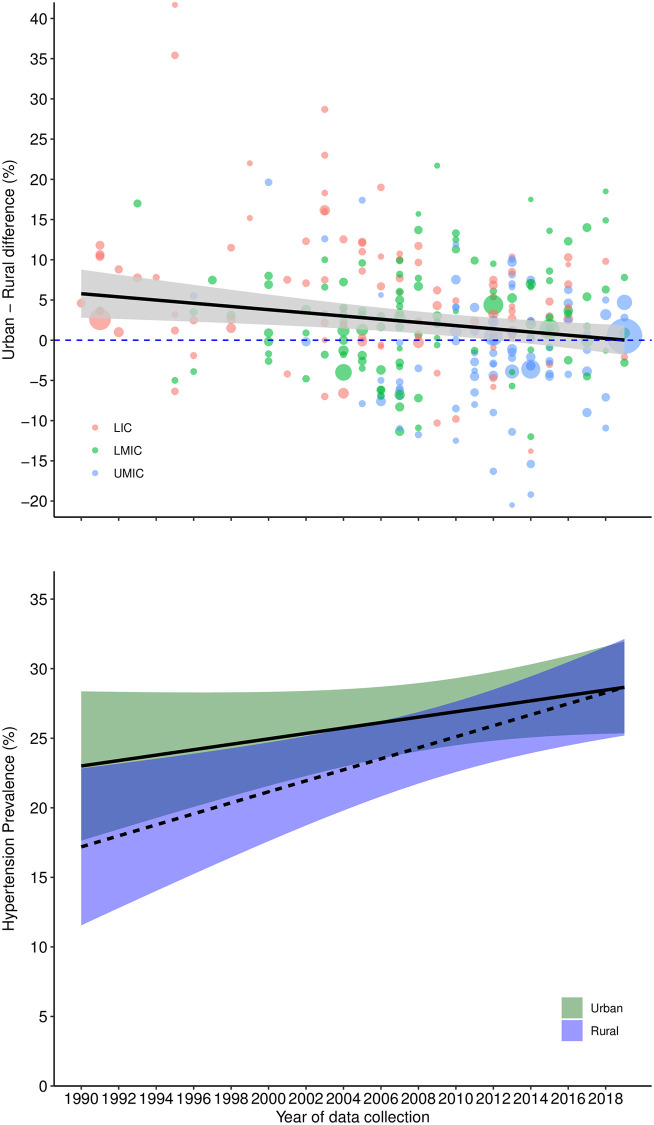
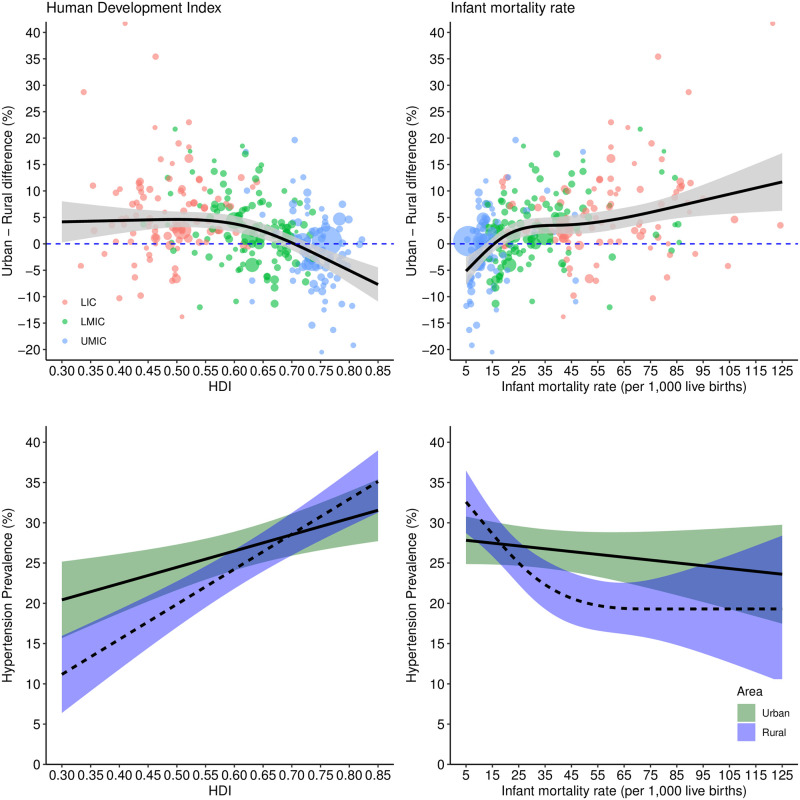
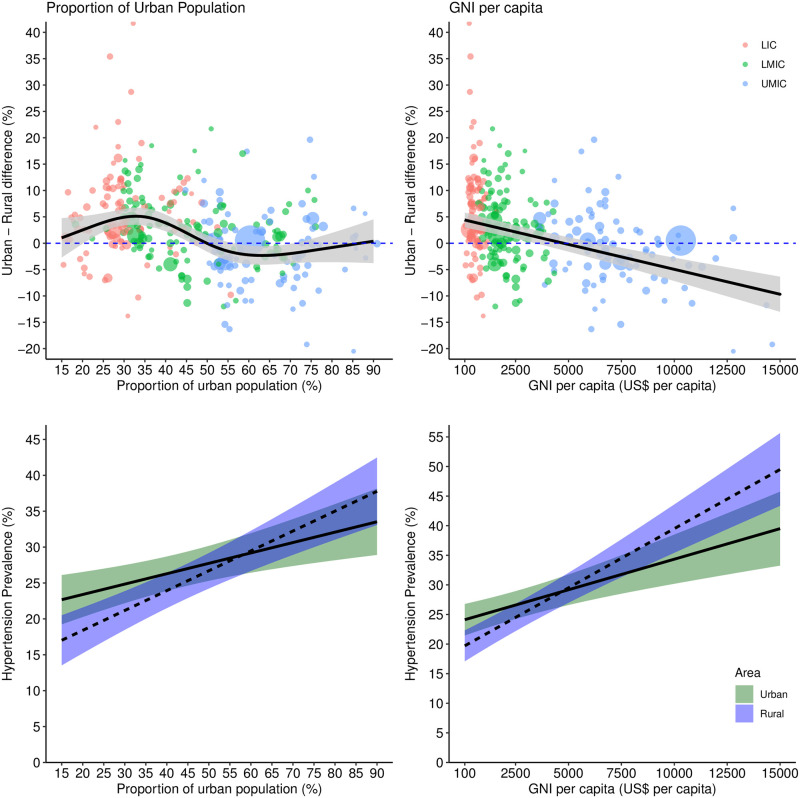
Methods and findings: We searched PubMed, Web of Science, Scopus, and Embase, from 01/01/1990 to 10/03/2022. We included population-based studies with ≥400 participants 15 years and older, selected by using a valid sampling technique, from LMICs that reported the urban-rural difference in hypertension prevalence using similar blood pressure measurements. We excluded abstracts, reviews, non-English studies, and those with exclusively self-reported hypertension prevalence. Study selection, quality assessment, and data extraction were performed by 2 independent reviewers following a standardised protocol. Our primary outcome was the urban minus rural prevalence of hypertension. Hypertension was defined as systolic blood pressure ≥140 mm Hg and/or diastolic blood pressure as ≥90 mm Hg and could include use of antihypertensive medication, self-reported diagnosis, or both. We investigated heterogeneity using study-level and socioeconomic country-level indicators. We conducted meta-analysis and meta-regression using random-effects models. This systematic review and meta-analysis has been registered with PROSPERO (CRD42018091671). We included 299 surveys from 66 LMICs, including 19,770,946 participants (mean age 45.4 ± SD = 9 years, 53.0% females and 63.1% from rural areas). The pooled prevalence of hypertension was 30.5% (95% CI, 28.9, 32.0) in urban areas and 27.9% (95% CI, 26.3, 29.6) in rural areas, resulting in a pooled urban-rural difference of 2.45% (95% CI, 1.57, 3.33, I-square: 99.71%, tau-square: 0.00524, Pheterogeneity < 0.001). Hypertension prevalence increased over time and the rate of change was greater in rural compared to urban areas, resulting in a pooled urban-rural difference of 5.75% (95% CI, 4.02, 7.48) in the period 1990 to 2004 and 1.38% (95% CI, 0.40, 2.37) in the period 2005 to 2020, p < 0.001 for time period. We observed substantial heterogeneity in the urban-rural difference of hypertension, which was partially explained by urban-rural definition, probably high risk of bias in sampling, country income status, region, and socioeconomic indicators. The urban-rural difference was 5.67% (95% CI, 4.22, 7.13) in low, 2.74% (95% CI, 1.41, 4.07) in lower-middle and -1.22% (95% CI, -2.73, 0.28) in upper-middle-income countries in the period 1990 to 2020, p < 0.001 for country income. The urban-rural difference was highest for South Asia (7.50%, 95% CI, 5.73, 9.26), followed by sub-Saharan Africa (4.24%, 95% CI, 2.62, 5.86) and reversed for Europe and Central Asia (-6.04%, 95% CI, -9.06, -3.01), in the period 1990 to 2020, p < 0.001 for region. Finally, the urban-rural difference in hypertension prevalence decreased nonlinearly with improvements in Human Development Index and infant mortality rate. Limitations included lack of data available from all LMICs and variability in urban and rural definitions in the literature.

Conclusions: The prevalence of hypertension in LMICs increased between 1990 and 2020 in both urban and rural areas, but with a stronger trend in rural areas. The urban minus rural hypertension difference decreased with time, and with country-level socioeconomic development. Focused action, particularly in rural areas, is needed to tackle the burden of hypertension in LMICs.


Conflict of interest statement

The authors have declared that no competing interests exist.

Figures

Fig 1
Fig 1. PRISMA flowchart.
Study flowchart after systematic search between 01/01/1990 and 10/03/2022 in the PubMed, Web of Science, Scopus, and Embase databases.
Fig 2
Fig 2. Urban-rural difference in hypertension prevalence from 1990 to 2020.
Predicted urban-rural differences from a meta-regression model with year of start of data collection and 5 study-level features: use of population groups to define urban and rural areas, number of blood pressure readings, sampling bias, detection bias (urban/rural), and prevalence adjusted by age/sex/sampling weights. The plot shows the prediction (marginal mean from model-5) of this model varying year from 1990 to 2019 (year starting data collection) and setting the 5 study-level features to the least biased category (no use of groups, ≥2 readings, probably low risk of sampling bias, probably low risk of detection bias (urban/rural), and adjusted prevalence). Income country status is only to illustrate each survey, and it is not adjusted in the model. Shaded areas represent 95% confidence interval and circle sizes proportional to inverse of variance. In the bottom panel, the solid lines represent urban areas and dashed lines represent rural areas. LIC, low-income country; LMIC, lower-middle-income country; UMIC, upper-middle-income country.
Fig 3
Fig 3. Urban-rural difference in hypertension prevalence and prevalence of hypertension in urban and rural areas according to HDI and infant mortality rate.
Predicted urban-rural differences and prevalence from meta-regression models with HDI or infant mortality rate, and 5 study-level features: use of population groups to define urban and rural areas, number of blood pressure readings, sampling bias, detection bias (urban/rural), and prevalence adjusted by age/sex/sampling weights. The plot shows the prediction (marginal mean from models 10 and 12) of this model varying HDI from 0.3 to 0.85 and infant mortality rate from 5 to 125 (range from observed data) and setting the 5 study-level features to the least biased category (no use of groups, ≥2 readings, probably low risk of sampling bias, probably low risk of detection bias (urban/rural), and adjusted prevalence). Income country status is only to illustrate each survey, and it is not adjusted in the model. Shaded areas represent 95% confidence interval and circle sizes proportional to inverse of variance. In the bottom panel, the solid lines represent urban areas and dashed lines represent rural areas. HDI, Human Development Index (higher values denote more development); LIC, low-income country; LMIC, lower-middle-income country; UMIC, upper-middle-income country.
Fig 4
Fig 4. Urban-rural difference in hypertension prevalence and prevalence of hypertension in urban and rural areas according to proportion of urban population and GNI per capita.
Predicted urban-rural differences and prevalence from meta-regression models with proportion of urban population or GNI per capita, and 5 study-level features: use of population groups to define urban and rural areas, number of blood pressure readings, sampling bias, detection bias (urban/rural), and prevalence adjusted by age/sex/sampling weights. The plot shows the prediction (marginal mean from models 9 and 11) of this model varying proportion of urban population from 15% to 90% and GNI per capita from $100 to $15,000 (range from observed data) and setting the 5 study-level features to the least biased category (no use of groups, ≥2 readings, probably low risk of sampling bias, probably low risk of detection bias (urban/rural), and adjusted prevalence). Income country status is only to illustrate each survey, and it is not adjusted in the model. Shaded areas represent 95% confidence interval and circle sizes proportional to inverse of variance. In the bottom panel, the solid lines represent urban areas and dashed lines represent rural areas. GNI, gross national income; LIC, low-income country; LMIC, lower-middle-income country; UMIC, upper-middle-income country.

Similar articles

Cited by

References

    1. Global burden of 87 risk factors in 204 countries and territories, 1990–2019: a systematic analysis for the Global Burden of Disease Study 2019. Lancet. [cited 2020 Nov 26]. https://www.thelancet.com/journals/lancet/article/PIIS0140-6736(20)30752... - PMC - PubMed
    1. Global burden of 369 diseases and injuries in 204 countries and territories, 1990–2019: a systematic analysis for the Global Burden of Disease Study 2019. Lancet. [cited 2020 Nov 26]. https://www.thelancet.com/journals/lancet/article/PIIS0140-6736(20)30925... - PMC - PubMed
    1. Mills KT, Bundy JD, Kelly TN, Reed JE, Kearney PM, Reynolds K, et al.. Global Disparities of Hypertension Prevalence and Control: A Systematic Analysis of Population-Based Studies From 90 Countries. Circulation. 2016;134:441–450. doi: 10.1161/CIRCULATIONAHA.115.018912 - DOI - PMC - PubMed
    1. Zhou B, Bentham J, Di Cesare M, Bixby H, Danaei G, Cowan MJ, et al.. Worldwide trends in blood pressure from 1975 to 2015: a pooled analysis of 1479 population-based measurement studies with 19·1 million participants. Lancet. 2017;389:37–55. doi: 10.1016/S0140-6736(16)31919-5 - DOI - PMC - PubMed
    1. Ibrahim MM, Damasceno A. Hypertension in developing countries. Lancet. 2012;380:611–619. doi: 10.1016/S0140-6736(12)60861-7 - DOI - PubMed

Publication types