Review
. 2023 Jan 1;103(1):787-854.
doi: 10.1152/physrev.00013.2022. Epub 2022 Aug 25.

Ion channels and channelopathies in glomeruli

Affiliations
Review

Ion channels and channelopathies in glomeruli

Alexander Staruschenko et al. Physiol Rev. .

Abstract

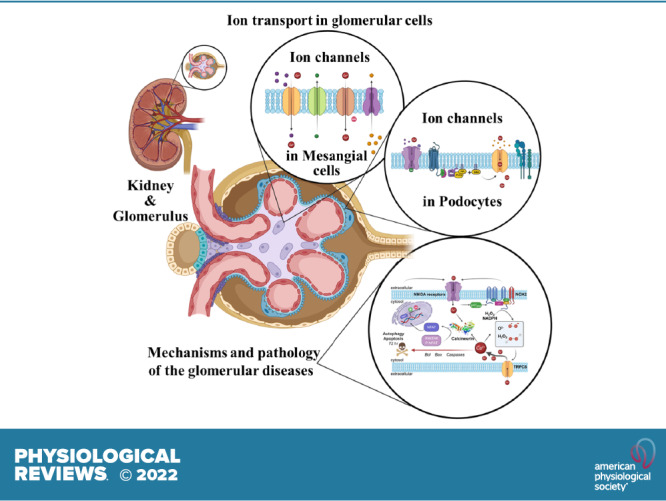
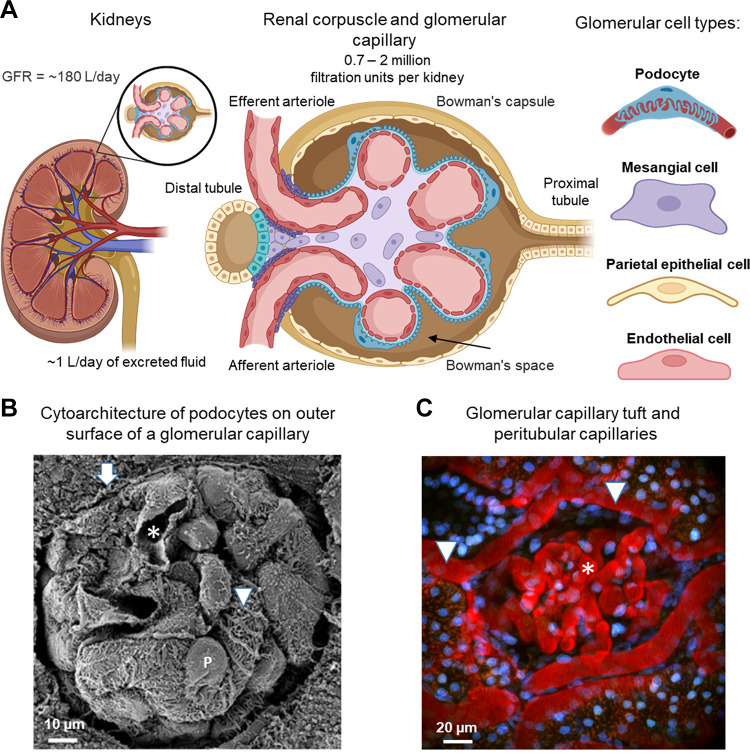
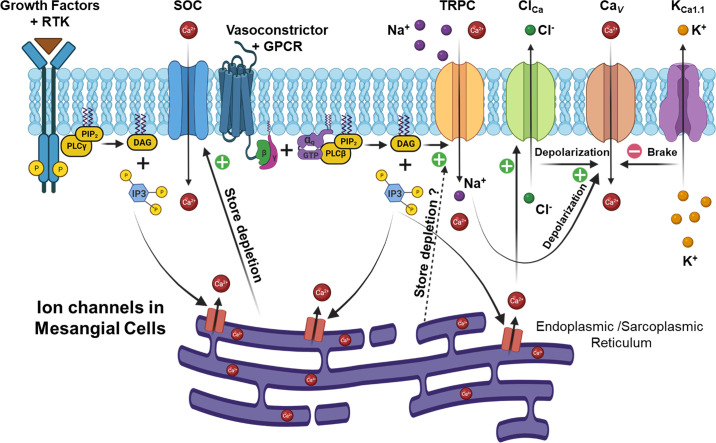
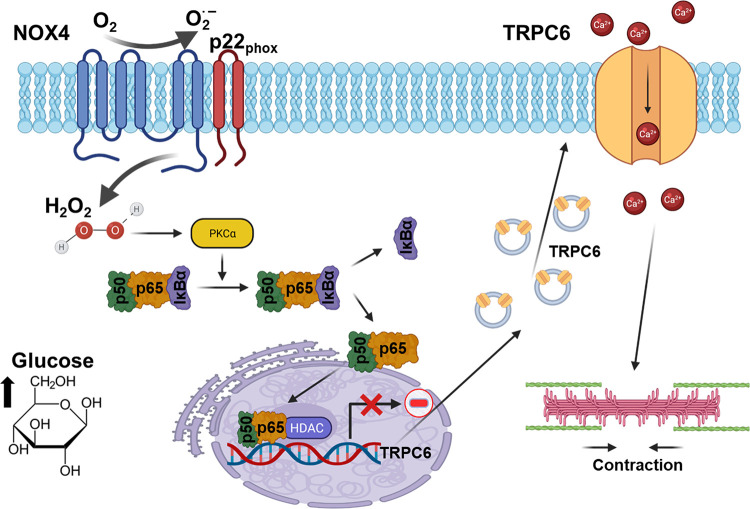
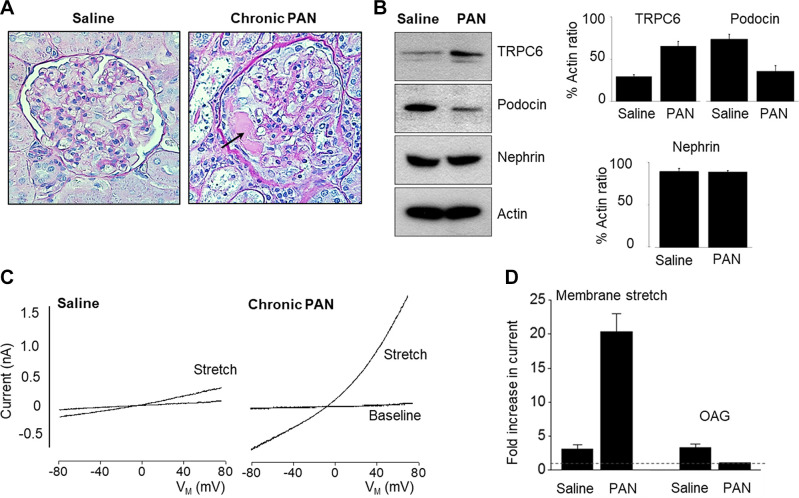
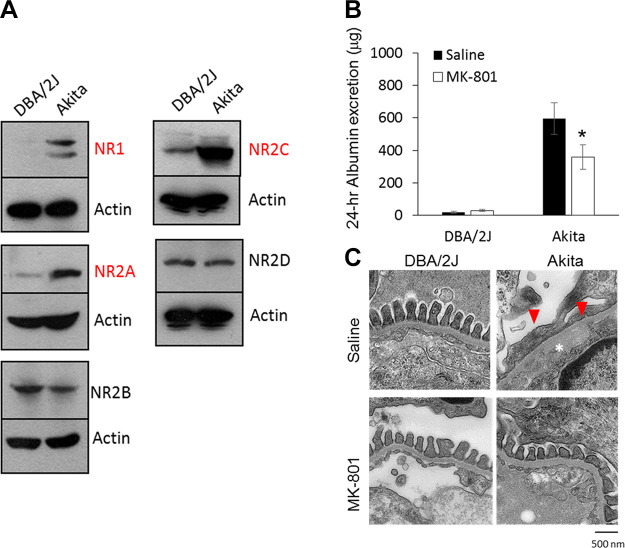
An essential step in renal function entails the formation of an ultrafiltrate that is delivered to the renal tubules for subsequent processing. This process, known as glomerular filtration, is controlled by intrinsic regulatory systems and by paracrine, neuronal, and endocrine signals that converge onto glomerular cells. In addition, the characteristics of glomerular fluid flow, such as the glomerular filtration rate and the glomerular filtration fraction, play an important role in determining blood flow to the rest of the kidney. Consequently, disease processes that initially affect glomeruli are the most likely to lead to end-stage kidney failure. The cells that comprise the glomerular filter, especially podocytes and mesangial cells, express many different types of ion channels that regulate intrinsic aspects of cell function and cellular responses to the local environment, such as changes in glomerular capillary pressure. Dysregulation of glomerular ion channels, such as changes in TRPC6, can lead to devastating glomerular diseases, and a number of channels, including TRPC6, TRPC5, and various ionotropic receptors, are promising targets for drug development. This review discusses glomerular structure and glomerular disease processes. It also describes the types of plasma membrane ion channels that have been identified in glomerular cells, the physiological and pathophysiological contexts in which they operate, and the pathways by which they are regulated and dysregulated. The contributions of these channels to glomerular disease processes, such as focal segmental glomerulosclerosis (FSGS) and diabetic nephropathy, as well as the development of drugs that target these channels are also discussed.

Keywords: KCa1.1 channels; NMDA receptors; TRPC channels; focal segmental glomerulosclerosis; glomerular filtration rate; store-operated calcium channels.


Conflict of interest statement

S.E.D. has received research contracts from Pfizer Inc. and Walden Biosciences Inc. He has received speakers honoraria from Amgen Inc., Walden Bioscience Inc., and Aredelyx Inc., and serves on the scientific advisory board of Actio Biosciences Inc. No other authors have any conflicts of interest, financial or otherwise, to disclose.

Figures

None
Graphical abstract
FIGURE 1.
FIGURE 1.
Organization of glomeruli. A: schematic representation of the glomerulus. The glomerulus is located in the renal cortex and consists of a network of blood capillaries located within Bowman’s capsule. Blood enters the capillaries through the afferent arteriole and leaves through the efferent arteriole and moves from there into various peritubular capillaries. Glomeruli contain 4 different cell types: podocytes, mesangial cells (MCs), endothelial cells, and parietal epithelial cells of Bowman’s capsule. B: scanning electron micrograph showing a mouse glomerulus with several capillary loops, a capillary lumen (asterisk), podocytes with their cell body (marked P), and the primary processes that emanate from the cell body (marked with an arrowhead). Bowman’s capsule can also be seen (arrow). Image adapted from Ref. with permission. C: intravital imaging of the superficial glomerulus in the rat kidney. Texas Red rat-labeled serum albumin shows the organization of peritubular capillaries (arrowheads) and glomerular capillaries (asterisk). Nuclei are stained with a blue dye (Hoechst). See glossary for abbreviations.
FIGURE 2.
FIGURE 2.
Higher-resolution images of glomeruli seen from different locations. A: helium ion microscopic imaging of glomerular endothelial cells. Two adjacent endothelial cells from a glomerular capillary as seen from the luminal side. Adapted from Ref. with permission. B: scanning ion-conductance microscopy (SICM) 3-dimensional image of a region of denuded glomerular basement membrane (GBM) in a glomerulus isolated from a rat with an advanced stage of diabetic nephropathy. The corresponding high-magnification inset shows adjacent endothelial cells imaged from the GBM side (color corresponds to the z-axis profile scale shown on the side). Adapted from Ref. with permission. C: helium ion microscopy imaging shows the interior of Bowman’s capsule containing a layer of squamous epithelial parietal cells. Each parietal epithelial cell displays a single, long central cilium. Adapted from Ref. . D: the glomerular capillary loop shows complex interdigitations of podocytes and their foot processes. Adapted from Ref. 69). E: 3-dimensional topographic SICM image of a glomerular capillary isolated from a normotensive rat. The corresponding high-magnification inset reveals interdigitated foot processes that wrap around the glomerular capillaries (color corresponds to the z-axis profile scale shown on the side). Adapted from Ref. with permission.
FIGURE 3.
FIGURE 3.
Distribution and activation of major ion channels in glomerular mesangial cells (MCs). Cav, voltage-activated Ca2+ channel; ClCa, Ca2+ activated Cl channel; DAG, diacylglycerol; ER, endoplasmic reticulum; GPCR, G protein-coupled receptor; IP3, inositol 1,4,5-trisphosphate; KCa1.1, large-conductance Ca2+-activated K+ channel (also known as BK or Slo1); PIP2, phosphatidylinositol 4,5-bisphosphate; PLC, phospholipase C; RTK, receptor tyrosine kinase; SOC, store-operated Ca2+ channel; SR, sarcoplasmic reticulum; TRPC, canonical transient receptor potential channel.
FIGURE 4.
FIGURE 4.
Activation of TRPC1 channels in glomerular mesangial cells (MCs) and its role in the regulation of the glomerular filtration rate (GFR). A: representative cell-attached single-channel currents evoked by application of 1 µM ANG II to cultured MCs in the presence or absence of rabbit (Rb IgG) or TRPC1 antibodies (Abs). Arrows indicate the closed state of the channels. Downward deflections indicate inward currents. The recording electrode was held at −80 mV. The bottom trace (inside the dashed rectangle) is the time-expanded portion of the trace indicated by a small dashed rectangle above. B: single-channel TRPC1 activity (NPO) before and after application of ANG II in untreated, Rb IgG-, and TRPC1 Ab-treated MCs. C: GFR, evaluated by inulin clearance, before and during infusion of ANG II [1.7 ng/min per 100 g body weight (BW)] in the presence or absence of an inactivating TRPC1 or Rb IgG antibodies. *P <0.05 between the indicated groups. Adapted from Ref. with permission.
FIGURE 5.
FIGURE 5.
In vivo knockdown of Orai1 with small interfering RNA/cyclodextrin-containing polymer nanoparticles (siRNA/NPs) in mesangial cells (MCs) resulted in an increase in glomerular ECM protein deposition in mice. A: schematic assembly of a siRNA/NP. When mixed in an aqueous solution (5% dextrose), the cationic cyclodextrins (CDP) assemble with the negatively charged siRNA molecules. As a result, 5-kDa polyethylene glycol (PEG) molecules are covalently linked to the small molecule adamantane (AD) and form guest/host interactions with the nanoparticle’s CDP component stabilizing the nanoparticles. In addition, the distal end of the AD-PEG molecules can be covalently linked to targeting ligands (TL) that facilitate cellular internalization of the nanoparticles (adapted from Ref. with permission). B: schematic of nanoparticle deposition in glomerular MCs and in the mesangium. ECM, mesangial extracellular matrix; GBM, glomerular basement membrane; NP, nanoparticle. C: representative images show localization of nanoparticles containing Cy3-tagged Orai1 siRNA (NP-Cy3-siOrai1) (red signals) in glomeruli (indicated by arrows) but not in tubules. D: localization of NP-Cy3-siOrai1 in MCs (left) but not in podocytes (right). MCs and podocytes were stained with integrin-8 (green) and synaptopodin (green), respectively. NP-Cy3-siOrai1 is shown as red signals. E and F: expression of fibronectin (E) and collagen IV (Col IV) (F) in glomeruli of mice treated with NP containing scrambled siRNA (NP-Con) and NP-Cys-siOrai1. Both fibronectin and Col IV are shown as green signals. A bright-field image of the kidney section was captured in NP-Con-treated mice to show the glomerulus. In NP-Cy3-siOrai1, the distribution of NP-Cy3-siOrai1 is indicated by Cy3 signals (red). Arrows indicate glomeruli. Original magnification ×200. C, E, and F are adapted from Ref. , and D is adapted from Ref. with permission.
FIGURE 6.
FIGURE 6.
Structure of P2X and P2Y receptors. A: ionotropic P2X receptors are trimeric proteins formed by subunits with 2 membrane-spanning domains. The amino and carboxy termini extend into the cytosol. B: metabotropic P2Y receptors have 7 membrane-spanning domains and are coupled to heterotrimeric G proteins.
FIGURE 7.
FIGURE 7.
Polymodal gating of TRPC6 channels in podocytes. A: activation of podocyte GPCRs leads to activation of PLC, generation of DAG, and Rac1-dependent activation of the NADPH oxidase NOX2, leading to a localized increase in ROS generation in the immediate vicinity of TRPC6. The catalytic subunits of NOX2 form a complex with podocin and TRPC6. These interactions with podocin are essential for TRPC6 activation by GPCRs. B: activation of podocyte TRPC6 channels by mechanical stimuli, which does not require activation of any cellular GTPases or generation of ROS. Podocin functions to suppress activation of podocyte TRPC6 by mechanical stimuli, possibly by regulating membrane stiffness or by modulating interactions of the channel complex with cytoskeletal elements. Podocin has a cholesterol-binding domain and functions as a scaffold to hold its binding partners within lipid raft domains in foot processes. See glossary for abbreviations.
FIGURE 8.
FIGURE 8.
Membrane topology of KCa1.1 pore-forming subunits (α-subunits) and auxiliary subunits. A: endogenous channels contain 4 pore-forming KCa1.1 subunits, which can assemble with various auxiliary β- and γ-subunits. The cytosolic domain of KCa1.1 is composed of 2 high-affinity Ca2+ binding sites known as RCK1 and RCK2 (regulator of Ca2+ conductance). The β-subunits have 2 membrane-spanning domains with the amino- and carboxy-terminal domains extending into the cytosol. The γ-subunits have a single membrane-spanning domain. B: immunofluorescence showing the distribution of KCa1.1 α-subunits in a mouse glomerulus. Note extensive colocalization with synaptopodin, a marker for podocyte cell bodies and foot processes. Adapted from Ref. with permission.
FIGURE 9.
FIGURE 9.
Interaction of KCa1.1 and TRPC6 channels and its functional significance. A: interaction of native podocyte KCa1.1 and TRPC6 subunits as revealed by reciprocal coimmunoprecipitation (IP). Adapted from Ref. with permission. B: whole cell recordings of K+ currents in cultured mouse podocytes evoked by a series of depolarizing voltage steps made from a holding potential of −60 mV. The 2 sets of current traces at top were made from the same cell with recording electrodes containing the Ca2+ buffer EGTA. Note that the currents get larger after the application of OAG, a membrane-permeable analog of DAG that activates TRPC6. Traces on the bottom were recorded from a different cell with electrodes containing the Ca2+ buffer BAPTA, which has much faster Ca2+ binding kinetics than EGTA but has a similar Ca2+-binding affinity. Under those conditions application of OAG was no longer able to induce an increase in macroscopic K+ currents. The bar graph on right shows the summary analysis of these experiments. Error bars represent SE using immunoblotting (IB). Im, membrane current; n.s., non significant; *P < 0.05. C: this diagram shows 1 interpretation of this result, namely that TRPC6 provides a Ca2+ source for activation of KCa1.1 but that this requires colocalization of the channels within the nanodomain of elevated Ca2+ surrounding an active TRPC6 channel for KCa1.1 to become active. In the presence of BAPTA, this nanodomain of elevated Ca2+ will be reduced in size because of its more rapid quenching of free Ca2+, and the coupling between the channels will be less efficient. See glossary for abbreviations.
FIGURE 10.
FIGURE 10.
Structure and agonist binding sites of NMDA receptor subunits and responses of podocytes to NMDA and other agonists. A: NMDA receptors are formed from NR1 and NR2 subunits. NMDA and other diacidic agonists bind to NR2 subunits, whereas glycine and d-serine bind to NR1 subunits. Both types of subunits must be occupied by their respective agonists for receptor activation. Each subunit has 4 semiautonomous domains, including an amino-terminal domain (ATD), an agonist-binding domain (ABD), a series of 3 helical membrane-spanning domains (M1, M2, and M4), a membrane reentrant loop (M2), and the intracellular COOH-terminal domains. The ABD is formed by 2 polypeptide segments that fold into a bilobed structure with an upper and a lower lobe. B: schematic showing the experimental design to analyze whole cell responses to NMDA and other agonists in podocytes. C: summary of prototypical agonists (left) and antagonists (right) that act on NR2 and NR1 subunits of NMDA receptors. Note that the NMDA receptor pore exhibits voltage-dependent blockade by Mg2+, which is relieved by membrane depolarization. D-APV, D-2-amino-5-phosphonovalerate; HCA, L-homocysteic acid; Quin, quinolinate. D: currents evoked by NMDA application in a cultured podocyte at a holding potential of −60 mV. NMDA-mediated currents in podocytes differ from most neuronal responses in that they can be evoked repeatedly and show no tendency to inactivate, even with a sustained application of NMDA lasting for 1 min. E: responses to NMDA are potentiated after bath application of d-serine. Adapted from Ref. with permission.
FIGURE 11.
FIGURE 11.
A: schematic of pathways to cell death in podocytes through sustained activation of NMDA receptors. Exposure of cultured podocytes to NMDA or other NMDA agonists triggers apoptotic cell death after 72 h. Certain products of tryptophan and methionine metabolism, such as L-homocysteic acid and quinolinic acid, are NMDA receptor agonists and can potentially trigger podocyte apoptosis. Activation of NFAT transcription factors in kidney podocytes is driven by Ca2+-calcineurin and could drive the loss of podocytes. B: sustained exposure to NMDA receptors can result in elevated cell surface expression of TRPC6 channels via increased production of ROS as well as by activation of NFAT signaling. See glossary for abbreviations.
FIGURE 12.
FIGURE 12.
Signaling mechanisms in disease states can lead to excessive signaling through TRPC6 channels in podocytes. Circulating permeability factors such as suPAR can bind to αVβ3-integrin, triggering increased generation of ROS and stimulating the trafficking of TRPC6 channels to the cell surface. This effect occurs within 6−24 h. A similar effect is seen in podocytes exposed to elevated external glucose concentrations. Sustained elevation of a metabotropic pathway through ANG II receptors [AT1 receptor (AT1R)] or P2Y receptors (P2YRs) would also be expected to cause chronic hyperactivation of TRPC6. ROS plays a critical role in TRPC6 activation by GPCRs and stimulates both trafficking and gating, as shown in the inset. See glossary for other abbreviations.
FIGURE 13.
FIGURE 13.
Modulation of Ca2+ signaling in podocytes and glomerular volume by ANG II pathway. A: a representative current trace from the cells transfected with AT1 receptor (AT1R) and TRPC6 before and after application of 1 μM ANG II, during a washout, and after a second ANG II application. This recording has a total length of 30 min. An expanded region shows 10 s of channel activity. B: representative current traces of a TRPC6 channel in a cell-attached patch on a podocyte from a freshly isolated wild-type (WT) mouse glomerulus. A continuous current trace (top) and addition of ANG II (1 μM) to the external bath solution (bottom) are shown. c and oi denote closed and open current levels, respectively. A summary graph for the channel open probability (Po) before and after application of ANG II is shown on right. *P < 0.01 vs. before ANG II. C: a representative recording made from the podocytes in a glomerulus freshly isolated from a TRPC6 knockout mouse. No channel activity was recorded in any of the patches before or after application of ANG II. A–C adapted from Ref. with permission. D: the effects of activation of TRPC6 channels by flufenamic acid (FFA, 100 µM) or TRPC6 inhibition by SAR7334 (1 µM) on ANG II-induced glomerulus volume dynamics (top) and a summary plot for the end point of glomerular volume (bottom). *P < 0.05 vs. control. D adapted from Ref. with permission.
FIGURE 14.
FIGURE 14.
Effects of ATP on podocytes and changes in purinergic signaling in diabetes. A: representative images of a glomerulus freshly isolated from a 12-wk-old rat with type 2 diabetes. Measurements of free Ca2+ with fluo-4 (green pseudocolor) and fura red AM (red pseudocolor) before and after application of ATP. Scale bar = 25 μm. B: examples of ATP-induced intracellular Ca2+ concentration ([Ca2+]i) transients simultaneously recorded from several podocytes in glomeruli isolated from age-matched Wistar or type 2 diabetic nephropathy (T2DN) rats. Note the much slower decay of [Ca2+]i transient observed in podocytes of diabetic stain. a.u., Arbitrary units. C: expression of P2 receptors in renal cortex of nondiabetic (Wistar), diabetic without DN (Goto-Kakizaki, GK), and T2DN rats. Note significant shift from metabotropic (P2Y1) to ionotropic (P2X4, P2X7) signaling in diabetes. A–C adapted from Ref. with permission. D: schematic of ATP-mediated purinergic pathways in podocytes under normal and pathophysiological conditions.
FIGURE 15.
FIGURE 15.
TRPC6 mutations associated with familial focal segmental glomerulosclerosis (FSGS). Domain structure of the TRPC6 channel. Human mutations associated with FSGS are shown in boxes. All of the known disease-causing mutations are located in the amino- and carboxy-terminal portions of TRPC6 that extend into the cytosol. Adapted from Ref. with permission.
FIGURE 16.
FIGURE 16.
Modulation of TRPC6 function by podocin and alpha-actinin (ACTN4). A: whole cell currents activated by membrane stretch in cultured podocytes treated with a control siRNA or an siRNA targeting TRPC6, as indicated. Knockdown of TRPC6 nearly eliminates stretch-evoked cationic currents in fully differentiated podocytes. VM, membrane potential. B: knockdown of podocin in cultured podocytes resulted in a large increase in stretch-evoked cation currents. A and B adapted from Ref. with permission. C: effect of ACTN4 K255E mutant on the organization of the actin cytoskeleton. CHO cells were transiently transfected with plasmids encoding wild-type (WT) or mutant K255E ACTN4. Scale bars, 50 μm. a: Rhodamine-phalloidin emission (red). Merged image of rhodamine-phalloidin (red), GFP-labeled α-actinin-4 (green), and Hoechst-33342 (nuclei, blue) emissions. d and e are zoomed areas from c (marked by white square) for rhodamine-phalloidine and GFP-labeled α-actinin-4, respectively. D: summary graphs of the channel activity (NPo) of the TRPC6 channels recorded in CHO cells cotransfected with TRPC6 and ACTN4 or ACTN4 K255E before and after OAG (100 µM) stimulation; *P <0.05. C and D adapted from Ref. with permission.
FIGURE 17.
FIGURE 17.
Schematic illustration of a signaling pathway for downregulation of TRPC6 expression in the presence of elevated external glucose in MCs. High glucose stimulates the production of ROS via activation of the NADPH oxidase NOX4. Activation of PKCα by H2O2 causes activation of NF-κB (p50 and p65 subunits), which binds to the NF-κB binding site within the TRPC6 promoter resulting in repression of its transcription. A decrease in TRPC6 channel proteins in the plasma membrane reduces TRPC6-mediated Ca2+ entry and impairs the contractile function of MCs. See glossary for abbreviations.
FIGURE 18.
FIGURE 18.
Dysregulation of TRPC6 in the chronic PAN nephrosis model of adaptive FSGS in rats. The experiment in this diagram used 2 injections of PAN given at a 30-day interval. A: at 60 days after an initial injection of PAN, marked glomerulosclerosis can be observed with periodic acid-Schiff staining in rats treated with PAN but not in saline-treated control rats. Arrow indicates segmental sclerotic lesions. B: TRPC6 abundance is markedly increased in glomeruli isolated from PAN-treated rats compared with saline-treated control rats. However, podocin expression is markedly decreased, whereas nephrin is not changed. C: cationic currents recorded from podocytes in acutely isolated glomeruli showing responses to membrane-stretch. Stretch-evoked currents are much more prominent in podocytes from PAN-treated rats. However, responses to a membrane-permeable DAG analog (OAG) are decreased. Vm, membrane voltage. D: summary of responses to stretch and OAG in podocytes from saline- or PAN-treated animals. See glossary for abbreviations. C and D adapted from Ref. with permission.
FIGURE 19.
FIGURE 19.
Structures of TRPC inhibitors. A: TRPC6 [BI 749327 (570), SAR7334 (420), larixyl acetate (571), and GSK 2833503A (572)] inhibitors. B: TRPC5 [AC-1903 (40) and GFB-8438 (573)] inhibitors.
FIGURE 20.
FIGURE 20.
Pharmacological inhibition of NMDA receptors reduces DN in the Akita mouse model of type 1 diabetes. A: diabetic mice exhibit marked increases in renal cortical NMDA receptor subunit expression compared with wild-type normoglycemic control mice (DBA/2J). B: treatment with the NMDA antagonist MK-801 for 28 days resulted in a decrease in urine albumin excretion accompanied by a decrease in podocyte foot process effacement. *P < 0.05. C: representative electron microscopy (EM) images of foot process effacement (arrowheads) and GBM thickening (asterisk) in Akita mice treated with saline. The ultrastructure was markedly improved in Akita mice treated with MK-801. See glossary for abbreviations. Adapted from Ref. with permission.
FIGURE 21.
FIGURE 21.
The signaling pathway for suppressing extracellular matrix protein production by Orai1-mediated store-operated Ca2+ entry (SOCE) in glomerular mesangial cells (MCs). ECM, extracellular matrix; P-Smad1, phosphorylated Smad1; P-Smad2/3, phosphorylated Smad2/3; TGF-β1: transforming growth factor β.

Similar articles

Cited by

References

    1. Vallon V. Glucose transporters in the kidney in health and disease. Pflugers Arch 472: 1345–1370, 2020. doi:10.1007/s00424-020-02361-w. - DOI - PMC - PubMed
    1. Hoorn EJ, Gritter M, Cuevas CA, Fenton RA. Regulation of the renal NaCl cotransporter and its role in potassium homeostasis. Physiol Rev 100: 321–356, 2020. doi:10.1152/physrev.00044.2018. - DOI - PubMed
    1. Bröer S. Amino acid transport across mammalian intestinal and renal epithelia. Physiol Rev 88: 249–286, 2008. doi:10.1152/physrev.00018.2006. - DOI - PubMed
    1. Ellison DH, Welling P. Insights into salt handling and blood pressure. N Engl J Med 385: 1981–1993, 2021. doi:10.1056/NEJMra2030212. - DOI - PubMed
    1. Rossier BC, Baker ME, Studer RA. Epithelial sodium transport and its control by aldosterone: the story of our internal environment revisited. Physiol Rev 95: 297–340, 2015. doi:10.1152/physrev.00011.2014. - DOI - PubMed

Publication types

MeSH terms