. 2022 Nov 1;323(5):F590-F601.
doi: 10.1152/ajprenal.00162.2022. Epub 2022 Aug 25.

Role of coagulation in persistent renal ischemia following reperfusion in an animal model

Affiliations

Role of coagulation in persistent renal ischemia following reperfusion in an animal model

Jesus H Dominguez et al. Am J Physiol Renal Physiol. .

Abstract

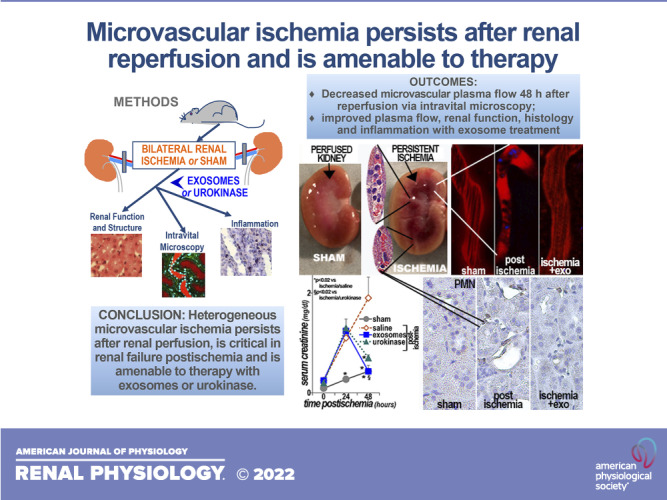
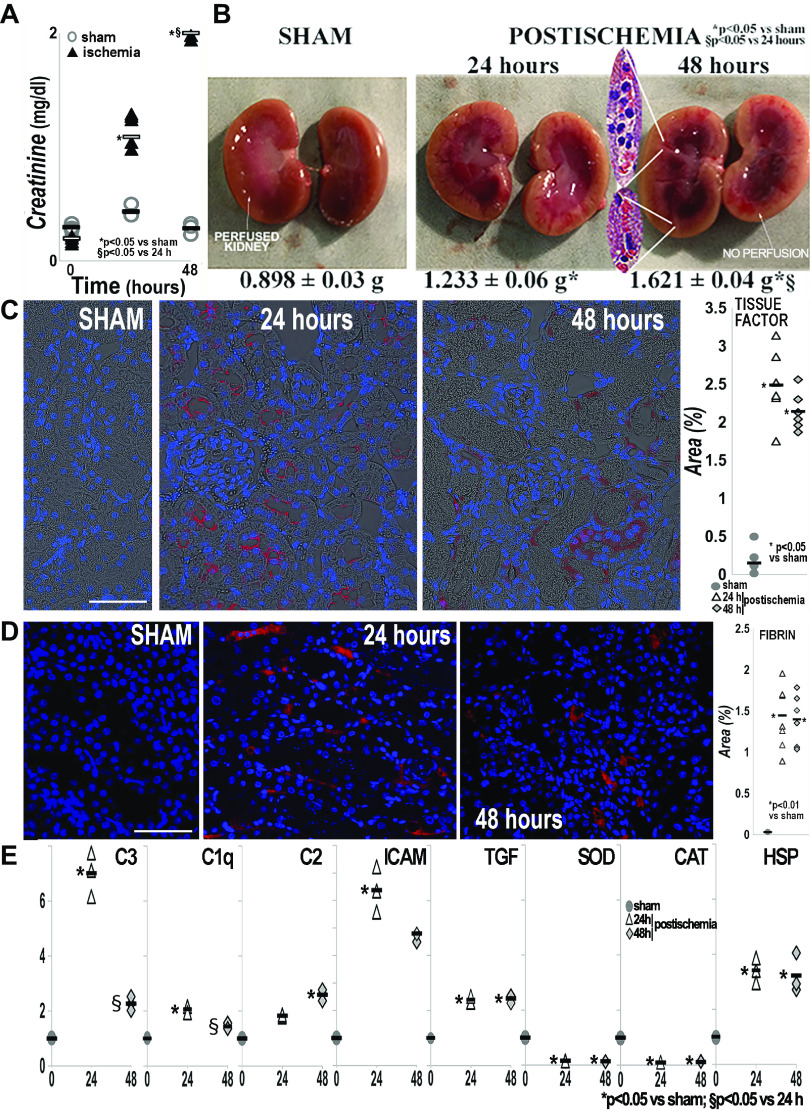
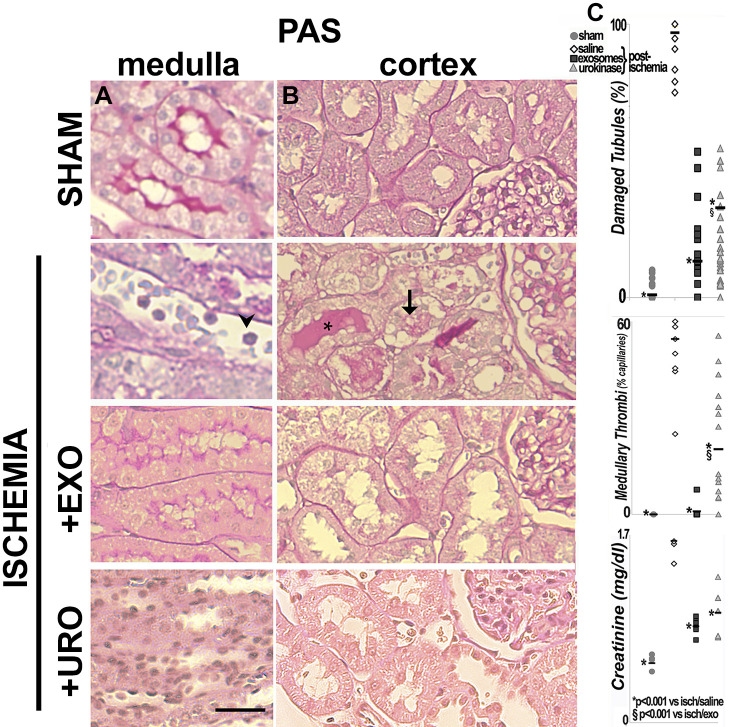
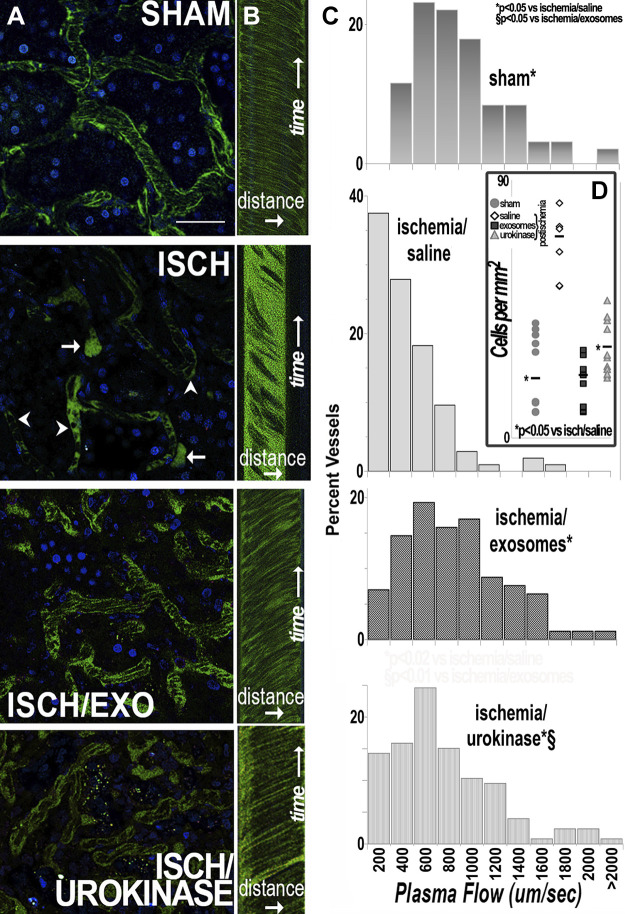
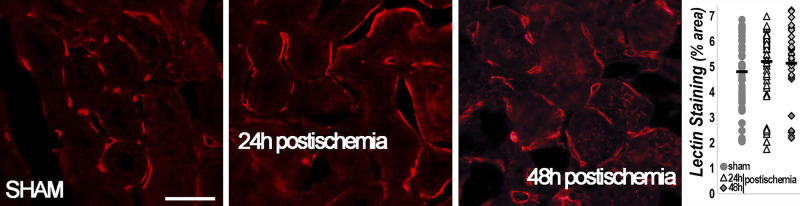
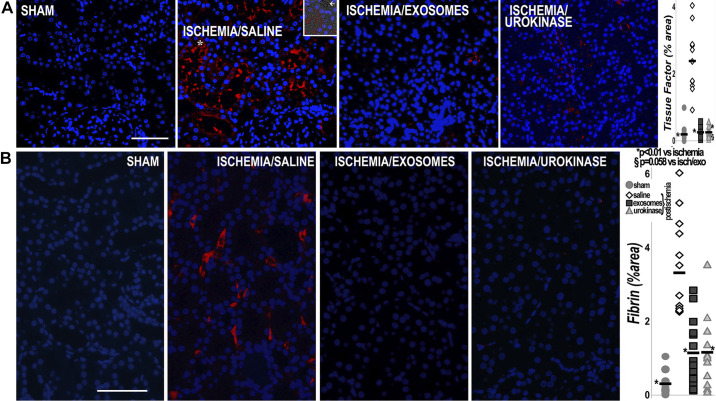
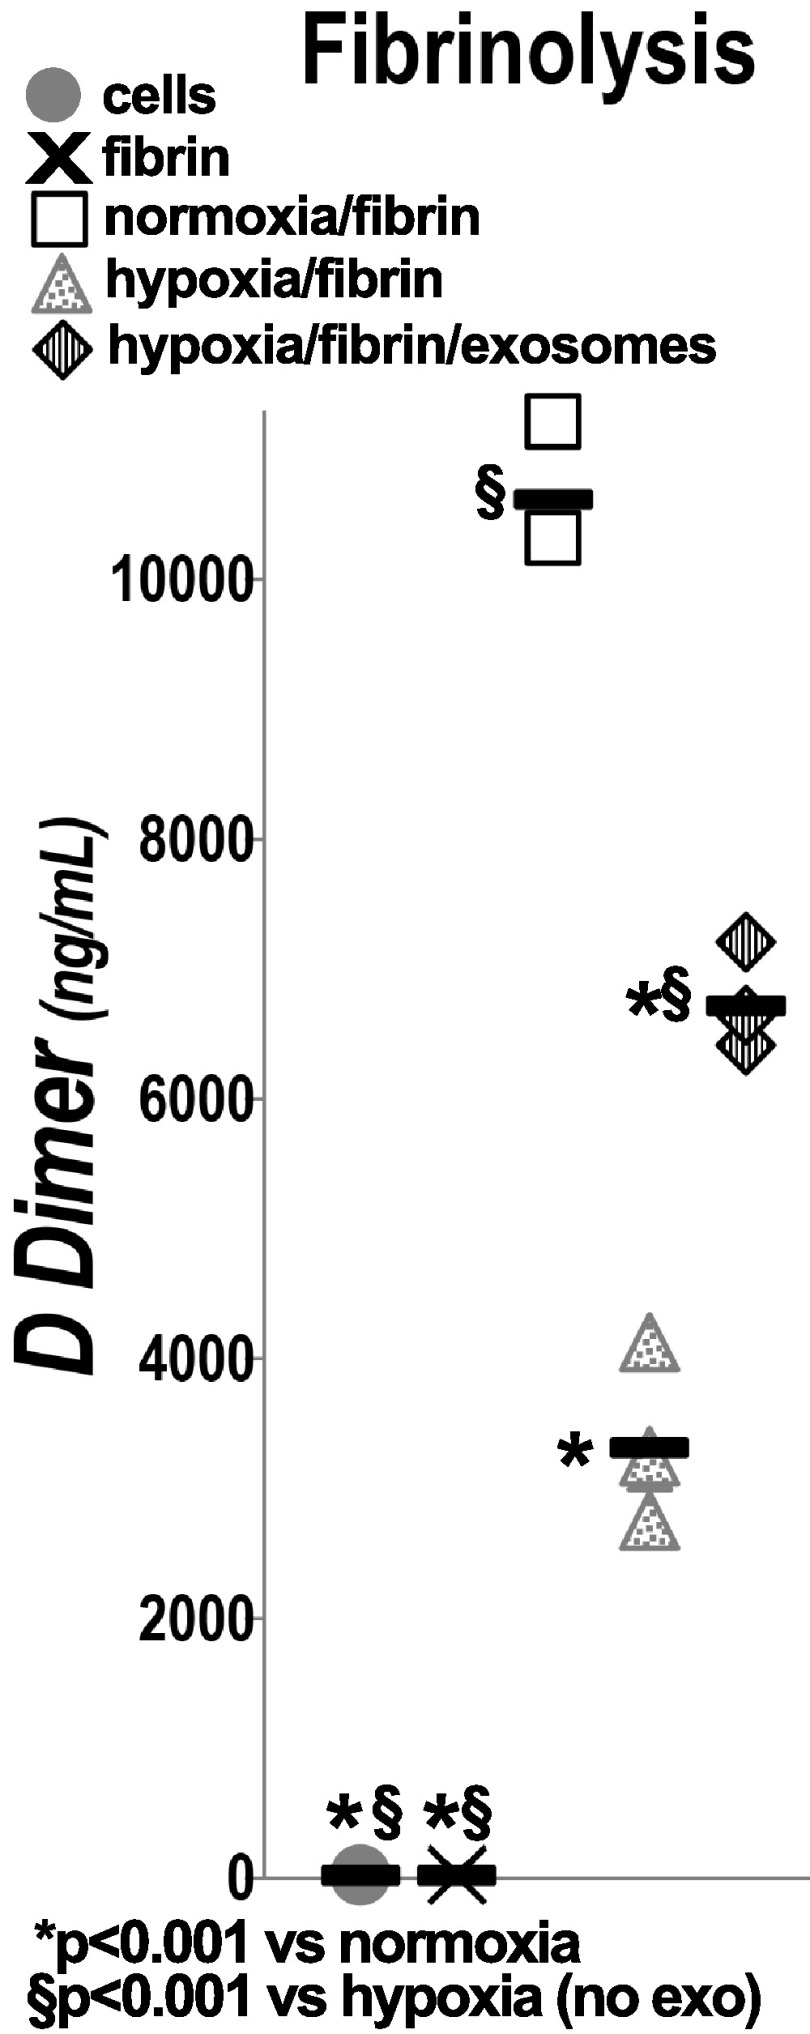
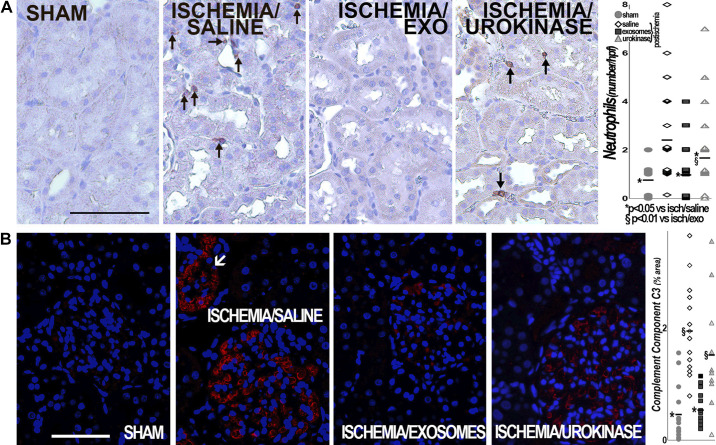
Ischemic acute kidney injury is common, deadly, and accelerates the progression of chronic kidney disease, yet has no specific therapy. After ischemia, reperfusion is patchy with early and persistent impairment in regional renal blood flow and cellular injury. We tested the hypothesis that intrarenal coagulation results in sustained renal ischemia following reperfusion, using a well-characterized model. Markedly decreased, but heterogeneous, microvascular plasma flow with microthrombi was found postischemia by intravital microscopy. Widespread tissue factor expression and fibrin deposition were also apparent. Clotting was accompanied by complement activation and inflammation. Treatment with exosomes derived from renal tubular cells or with the fibrinolytic urokinase, given 24 h postischemia when renal failure was established, significantly improved microvascular flow, coagulation, serum creatinine, and histological evidence of injury. These data support the hypothesis that intrarenal clotting occurs early and the resultant sustained ischemia is a critical determinant of renal failure following ischemia; they demonstrate that the coagulation abnormalities are amenable to therapy and that therapy results in improvement in both function and postischemic inflammation.NEW & NOTEWORTHY Ischemic renal injury carries very high morbidity and mortality, yet has no specific therapy. We found markedly decreased, heterogeneous microvascular plasma flow, tissue factor induction, fibrin deposition, and microthrombi after renal ischemia-reperfusion using a well-characterized model. Renal exosomes or the fibrinolytic urokinase, administered after renal failure was established, improved microvascular flow, coagulation, renal function, and histology. Data demonstrate that intrarenal clotting results in sustained ischemia amenable to therapy that improves both function and postischemic inflammation.

Keywords: acute kidney injury; exosomes; fibrinolysis; ischemia-reperfusion; microvasculature.


Conflict of interest statement

No conflicts of interest, financial or otherwise, are declared by the authors.

Figures

None
Graphical abstract
Figure 1.
Figure 1.
Postischemic renal failure and coagulation. A: serum creatinine levels (n = 5 male rats) were stable in sham rats but increased rapidly in rats after bilateral renal artery occlusion for 50 min (ischemia, time 0). B: bisected kidneys showed bloody streaks representing microthrombi postischemia. The insets show aggregated red blood cells proximate to intravascular white blood cells in a periodic acid-Schiff-stained section. The red blood cell aggregates were seen in both capillaries and arterioles. Means (±SE) kidney weights are shown on the bottom (n = 3 male rats). C: kidneys of control (sham) rats did not express tissue factor (F3). However, renal epithelial F3 was induced within 24 h following bilateral renal ischemia for 50 min (24 h) and remained upregulated for at least another 24 h (48 h). The graph shows the quantification of F3 induction as the percent area of the F3 immunofluorescence signal in 42 microscopic fields (n = 3 male rats/group). In this and subsequent graphs, the horizontal bars show mean values. Nuclei were counterstained blue with Hoechst (*P < 0.05 vs. sham). Scale bar = 100 µm. D: fibrin was absent from the kidneys of control (sham) rats. However, renal fibrin was broadly deposited in capillaries within 24 h following bilateral renal ischemia for 50 min (24 h) and persisted for at least another day (48 h). The graph shows the quantification of the fibrin immunofluorescence signal in 53 microscopic fields (n = 3 male rats/group). Scale bar = 100 µm. Nuclei were counterstained blue with Hoechst (P < 0.01 vs. sham). E: kidney mRNA fold changes, by RT-PCR, between sham rats (0 h) and rats that sustained bilateral renal ischemia for 50 min and 24 or 48 h (24 and 48 h) reperfusion postischemia are shown. mRNA encoding complement components C3, C1q, and C2, intercellular adhesion molecule 1 (ICAM), and transforming growth factor-β1 (TGF) were elevated 24 and/or 48 h postischemia. In contrast, transcripts for the antioxidants superoxide dismutase-1 (SOD) and catalase (CAT) were suppressed 24 and 48 h postischemia. Stress heat shock protein 27 (HSP) also increased 24 and 48 h postischemia (n = 3 male rats/group). *Significantly different than sham; §significantly different than 24 h (P < 0.05 for both). Statistical analyses were determined using ANOVA.
Figure 2.
Figure 2.
Histology. Representative periodic acid-Schiff (PAS)-stained kidney sections from four groups are shown. The left images (A) show the medulla and the right images (B) show the cortex in control (sham), untreated ischemic, and ischemic rats treated with exosomes (+EXO) or urokinase (+URO). Tubular damage (example at arrow), cast formation (*), and microthrombi and neutrophils (arrowhead) were seen in postischemic (untreated) kidneys. C: the graphs show the percentage of damaged tubules (top), medullary capillaries with thrombi (middle) (n = 8–150 fields/group), and serum creatinine 48 h following surgery (bottom, n = 5 male rats/group) with mean values as bars. *P < 0.05 vs. ischemia/saline (for creatinine); *P < 0.001 vs. ischemia/saline for damaged tubules and medullary thrombi; §P < 0.001 vs. ischemia/exosomes. Scale bar = 100 µm. Statistical analyses were determined using ANOVA.
Figure 3.
Figure 3.
Microvascular plasma flow following reperfusion. Representative multiphoton intravital images and quantitation of capillary plasma flow 48 h after reperfusion or sham surgery are shown (A). Fluorescein-conjugated dextran (150 kDa) and Hoechst were used to label the vascular space and nuclei, respectively. The top left image shows unobstructed plasma flow following sham surgery. In contrast, areas of no flow (absence of green signal), dye extravasation (arrows), and adherent leukocytes (arrowheads) are seen following untreated ischemia (ISCH; middle top). Plasma flow was improved in the groups treated with exosomes (ISCH/EXO; middle bottom) or urokinase (ISCH/UROKINASE; bottom) after ischemia. Scale bar = 100 µm. The middle images (B) show representative line scans, which illustrate the red blood cell (RBC) trajectories used to calculate plasma flow. The right images (C) show the distribution of capillary flow velocities. In sham kidneys, RBC velocities were normally distributed and ranged between 400 and 2,000 µM/s, with mean peaks at ∼600 and 800 µM/s (n = 96 unconnected vessels). In contrast, renal RBC velocity in untreated ischemic rats (ischemia/saline) was significantly slower, with a peak in the lowest range of 200 µM/s (n = 104). RBC velocities in exosome-treated (ischemia/exosomes, n = 171) or urokinase-treated (ischemia/urokinase, n = 126), ischemic rats showed normal distributions, peaking at ∼600 µM/s. *Significantly different than ischemia/saline; §significantly different than ischemia/exosomes (P <0.01). The inset (D) shows the mean number of intravascular leukocytes per mm2 (with means as horizontal bars). *Significantly lower than ischemia/saline (P <0.05). n = 5 male rats/group. Statistical analyses were determined using Fisher’s exact test (distribution of capillary flow) and ANOVA (leukocyte numbers).
Figure 4.
Figure 4.
Preserved microvascular structure postischemia. Representative images and quantification of renal peritubular microvasculature labeled with rhodamine (red)-conjugated Lycopersicon esculentum (tomato) lectin are shown. The microvascular structure is largely preserved 48 h following 50 min of renal ischemia. Quantification of the labeled area (n = 180 microscopic fields, 3 male rats/group) showed no significant differences between sham surgery and postischemia. These data demonstrate that relief of coagulation has the potential to restore perfusion/relieve hypoxia as the microvascular structure to carry blood flow is intact. Scale bar = 100 µm. Statistical analysis was determined using ANOVA.
Figure 5.
Figure 5.
Tissue factor and fibrin. A: immunoreactive tissue factor (F3; red) was undetectable in the kidneys of control (SHAM) rats, but it was widely distributed in renal tubules of untreated ischemic rats (ISCHEMIA/SALINE). *Area amplified in the inset depicting F3 expression in the vicinity of a microthrombus (arrow). In contrast, F3 expression was barely detectable in ischemic rats treated with exosomes (ISCHEMIA/EXOSOMES) or in ischemic rats treated with urokinase (ISCHEMIA/UROKINASE). The graph shows the percent area of the F3 immunofluorescence signal in each group (n = 9–11 fields and 3 male rats/group), with mean values as horizontal bars. Nuclei were counterstained blue with Hoechst (P < 0.01 vs. sham and §P = 0.058 vs. ischemia/exosomes). B: representative images showing immunoreactive fibrin in kidneys harvested 48 h after surgery. Fibrin (red) was undetectable in the kidneys of control (SHAM) rats, but it was broadly deposited in peritubular capillaries of untreated ischemic rats (ISCHEMIA/SALINE). In contrast, fibrin deposition was markedly reduced in the kidneys of ischemic rats infused with exosomes (ISCHEMIA/EXOSOMES) or urokinase (ISCHEMIA/UROKINASE). The graph shows the percent area of the fibrin immunofluorescence signal in all microscopic fields (n = 12–14 microscope fields and 3 male rats/group). Nuclei were counterstained blue with Hoechst (*P < 0.01 vs. ischemia/saline). Scale bars = 100 µm. Statistical analysis was determined using ANOVA.
Figure 6.
Figure 6.
Fibrinolytic activity. Human tubular cells were cultured under normoxic (48 h) or hypoxic (<1% O2 for 24 h/reoxygenation for 24 h) conditions in the presence of fibrin. In the hypoxia/exosome group, exosomes were added during the reoxygenation period. Confluent human renal tubular cells cultured without fibrin (cells) and fibrin alone (without cells, to measure nonenzymatic fibrin degradation) were included as controls. *Significantly different than normoxia (P < 0.001); §significantly different than hypoxia (P < 0.001). n = 4 replicates/group. The horizontal bars represent mean values. Statistical analysis was determined using ANOVA.
Figure 7.
Figure 7.
Renal inflammation. A: neutrophils (polymorphonuclear neutrophils, PMN; top images, brown) were very rare after sham (SHAM) surgery but significantly increased after ischemia (ISCHEMIA/SALINE). Exosomes and, to a lesser extent, urokinase given 24 h postischemia resulted in significantly fewer renal PMN. Scale bar = 100 µm. B: similarly, immunoreactive C3 (red, bottom images) was markedly increased postischemia (ISCHEMIA/SALINE) and significantly improved in the ischemia/exosome (EXO) and ischemia/urokinase groups. The results (number of PMN and percent area C3) are quantified in the graphs on the right, with horizontal bars showing mean values. Scale bar = 50 µm. n = 30–40 fields/group for PMN and 11–16 fields/group for C3, 3 or 4 male rats/group. Nuclei were counterstained blue with hematoxylin (top images) or Hoechst (bottom images). hpf, high-power field. For PMN, *P < 0.05 vs. ischemia/saline and §P < 0.01 vs. ischemia/exosomes; for C3, *P < 0.01 vs. ischemia/saline and §P < 0.01 vs. ischemia/exosomes). Statistical analysis was determined using ANOVA.

Similar articles

Cited by

References

    1. Havasi A, Borkan SC. Apoptosis and acute kidney injury. Kidney Int 80: 29–40, 2011. doi:10.1038/ki.2011.120. - DOI - PMC - PubMed
    1. Agarwal A, Dong Z, Harris R, Murray P, Parikh SM, Rosner MH, Kellum JA, Ronco C; Acute Dialysis Quality Initiative XIII Working Group. Cellular and molecular mechanisms of AKI. J Am Soc Nephrol 27: 1288–1299, 2016. doi:10.1681/ASN.2015070740. - DOI - PMC - PubMed
    1. Faubel S, Chawla LS, Chertow GM, Goldstein SL, Jaber BL, Liu KD; Acute Kidney Injury Advisory Group of the American Society of Nephrology. Ongoing clinical trials in AKI. Clin J Am Soc Nephrol 7: 861–873, 2012. doi:10.2215/CJN.12191111. - DOI - PubMed
    1. Kwon O, Ahn K, Zhang B, Lockwood T, Dhamija R, Anderson D, Saqib N. Simultaneous monitoring of multiple urinary cytokines may predict renal and patient outcome in ischemic AKI. Ren Fail 32: 699–708, 2010. doi:10.3109/0886022X.2010.486496. - DOI - PubMed
    1. Lameire N, Vanmassenhove J, Lewington A. Did KDIGO guidelines on acute kidney injury improve patient outcome? Intensive Care Med 43: 921–923, 2017. doi:10.1007/s00134-017-4740-1. - DOI - PubMed

Publication types

LinkOut - more resources