. 2022 Aug 26;50(15):8580-8598.
doi: 10.1093/nar/gkac664.

The convergent xenogeneic silencer MucR predisposes α-proteobacteria to integrate AT-rich symbiosis genes

Affiliations

The convergent xenogeneic silencer MucR predisposes α-proteobacteria to integrate AT-rich symbiosis genes

Wen-Tao Shi et al. Nucleic Acids Res. .

Abstract

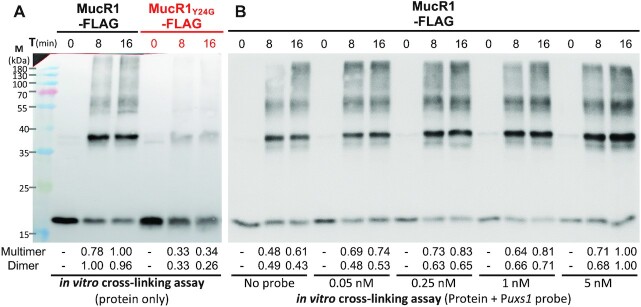
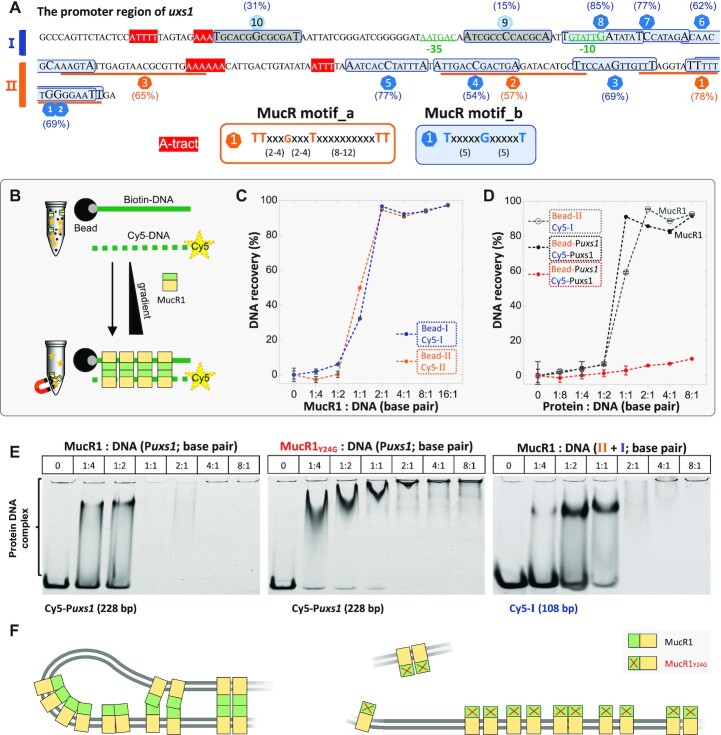
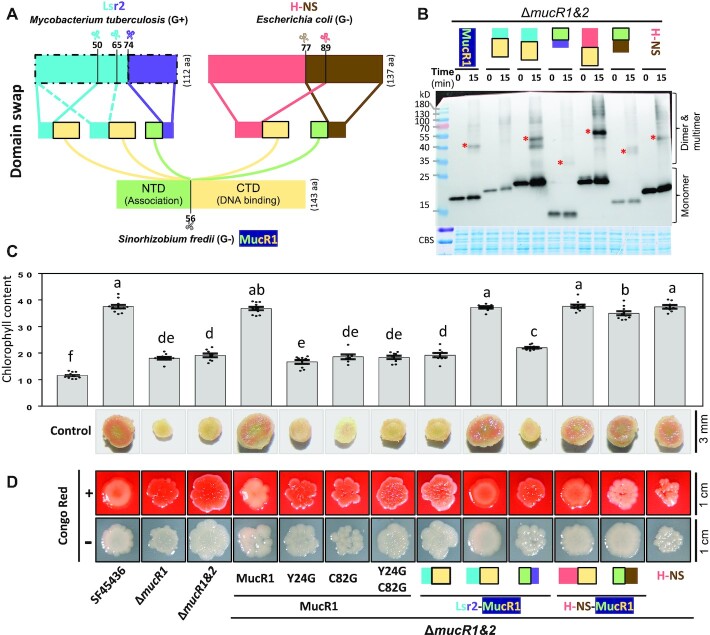
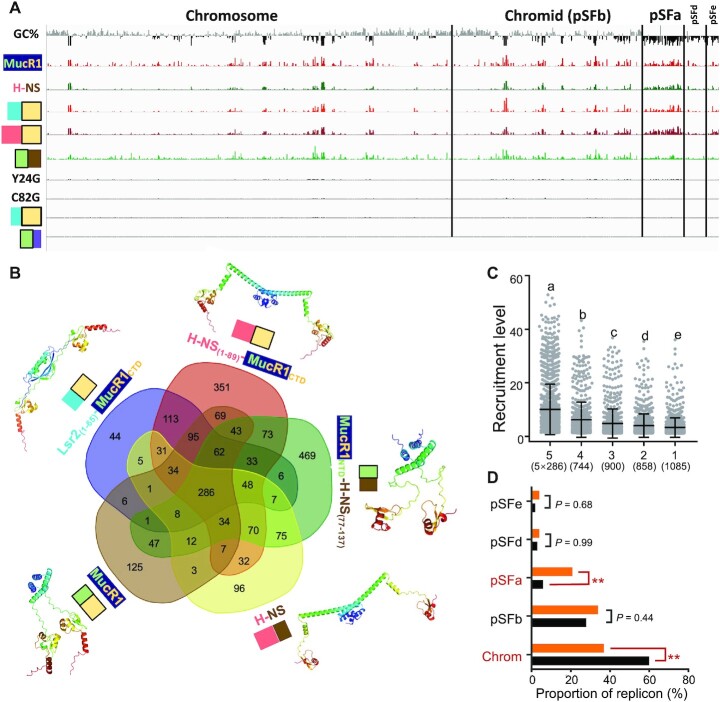
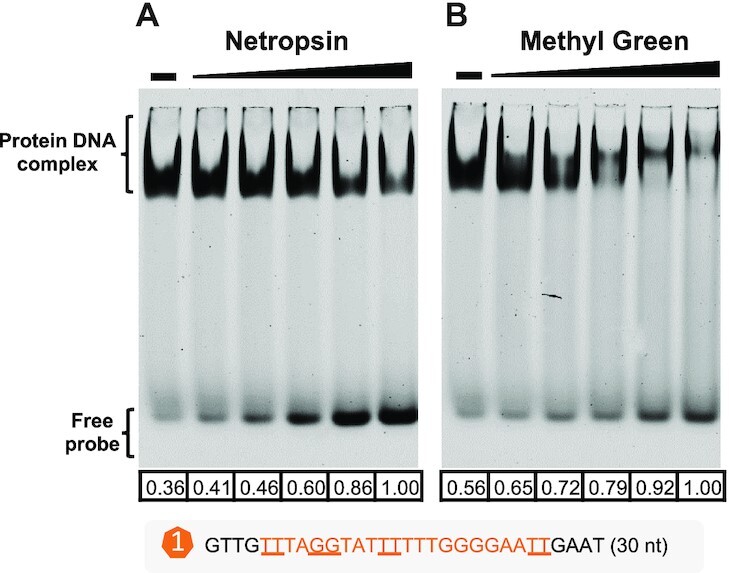
Bacterial adaptation is largely shaped by horizontal gene transfer, xenogeneic silencing mediated by lineage-specific DNA bridgers (H-NS, Lsr2, MvaT and Rok), and various anti-silencing mechanisms. No xenogeneic silencing DNA bridger is known for α-proteobacteria, from which mitochondria evolved. By investigating α-proteobacterium Sinorhizobium fredii, a facultative legume microsymbiont, here we report the conserved zinc-finger bearing MucR as a novel xenogeneic silencing DNA bridger. Self-association mediated by its N-terminal domain (NTD) is required for DNA-MucR-DNA bridging complex formation, maximizing MucR stability, transcriptional silencing, and efficient symbiosis in legume nodules. Essential roles of NTD, CTD (C-terminal DNA-binding domain), or full-length MucR in symbiosis can be replaced by non-homologous NTD, CTD, or full-length protein of H-NS from γ-proteobacterium Escherichia coli, while NTD rather than CTD of Lsr2 from Gram-positive Mycobacterium tuberculosis can replace the corresponding domain of MucR in symbiosis. Chromatin immunoprecipitation sequencing reveals similar recruitment profiles of H-NS, MucR and various functional chimeric xenogeneic silencers across the multipartite genome of S. fredii, i.e. preferring AT-rich genomic islands and symbiosis plasmid with key symbiosis genes as shared targets. Collectively, the convergently evolved DNA bridger MucR predisposed α-proteobacteria to integrate AT-rich foreign DNA including symbiosis genes, horizontal transfer of which is strongly selected in nature.


Figures

Figure 1.
Figure 1.
MucR1 self-association and its interaction with MucR2 mediated by the N-terminal domain. (A) Schematic representation of MucR1 and MucR2. MucR2 is not a functional DNA binding regulator due to a frameshift mutation at 114th aa. (B) Predicted protein structure of homo-dimer of the full MucR1 protein by Alphafold2. LDDT, local-distance difference test measuring the accuracy of prediction. Structure for the top 1 model is shown. (C) The yeast-two-hybrid assay identifies the N-terminal domain (NTD) involved in MucR1-MucR1 and MucR1-MucR2 interactions. MucR2 is indicated in red border. (D) The smallest fragment of NTD involved in self-association is MucR1(17–47). The same fragments were cloned in AD (pGADT7) and BD (pGBKT7). (C, D) AD, pGADT7 derived constructs; BD, pGBKT7 derived constructs. The colony growth and blue color on the medium lacking Trp/Leu/His but supplemented with X-α-gal indicate protein interaction. Results of positive (SV40-p53; blue colonies) and negative (SV40-Lam; no colonies formed) controls in the yeast-two-hybrid assay are shown for comparison.
Figure 2.
Figure 2.
Identification of key residues and their spacers in NTD involved in self-association. (A) The yeast-two-hybrid assay of MucR1(1–56) derivatives (the same fragments were cloned in AD and BD). The HMM logo is based on 2201 MucR/Ros homologs in the Pfam database (871 species). The key residues (1st) were substituted by G, N or the secondly conserved residue (2nd). ‘Dup’, duplication; ‘Del’, deletion. Six spacers between conserved branched-chain Ile/Val/Leu are indicated by blue and purple numbers. (B) Summary for proteins with substitutions at conserved residues. Red and blue arrows represent loss and maintenance of self-association ability, respectively. (C) Summary for proteins with duplication (+1) or deletion (−1) of the same residue ‘X’ in spacers. (B, C) The numbers in brackets (x/y) indicate x out of y test proteins maintained self-association ability. (A–C) Hydrophobic, amphipathic, and hydrophilic residues are indicated in different colors. (D) MucR1NTD dimer predicted by Alphafold2. Orange, conserved residues. Side chains of conserved residues and/or interface residues (ΔASA > 1.0) are shown in stick mode. ΔASA, changes in accessible surface area.
Figure 3.
Figure 3.
In vivo cross-linking assay of MucR1 and its derivatives, and predicted homo-multimers of MucR1. (A) Late log phase cultures (OD600= 1.2) were subject to cross-linking by glutaraldehyde for 15 min and resolved by SDS-PAGE. The anti-FLAG antibody was used to detect MucR1 and its derivatives (substitutions and deletions). Samples were normalized by bacterial OD600. *, red asterisk indicates dimer. (B, C) Predicted protein structure of homo-multimers of the NTD (B) or homo-tetramer of full MucR1 (C) by Alphafold2. Structure for the top 1 model is shown (based on local-distance difference test; Supplementary Figure S1 for details). The color scheme in (B). Blue, Y24; yellow, conserved branched-chain residues; cyan, spacers ID1-3; magenta, spacers ID4-6. Low complex linker region is indicated in (C).
Figure 4.
Figure 4.
Post translation stability of MucR1 depends on its NTD. (A) Growth curves of test strains. (B) Dynamic protein levels of MucR1 and its derivatives. The 1st sampling point is indicated in (A). (C) Dynamic transcription levels of mucR1 and its derivatives (relative to 16S rRNA gene). Error bars represent SD of three biological replicates. The 1st sampling is indicated in (A). (D) EMSA showing impaired bandshift of the PmucR1 (the promoter of mucR1) in the treatment of MucR1Y24G compared to MucR1. The PmucR1 probe, 12.3 nM. Protein concentration: 0.5, 1.5, 4.5, 13.5, 27 and 54 μM. ‘–’, 0 μM. (E) Protein stability assay of MucR1 and MucR1Y24G in the ΔmucR1 mutant carrying pBR-MucR1-FLAG or pBR-MucR1Y24G-FLAG post translation inhibition by chloramphenicol treatment of mid-log phase culture (OD600 = 0.8).
Figure 5.
Figure 5.
In vitro self-association of MucR1 depends on NTD and enhanced by target DNA. (A) In vitro cross-linking assay of MucR1-FLAG and MucR1Y24G-FLAG. (B) In vitro cross-linking assay of MucR1-FLAG with various concentrations of DNA probe Puxs1. The numbers below the picture refer to the quantified band intensity values of dimers or multimers in each lane. Multimers of different oligomerization levels were collectively quantified.
Figure 6.
Figure 6.
DNA bridging mediated by MucR1 requires a functional NTD. (A) Distribution of two putative high-affinity binding motifs (with AT content indicated in brackets) and −10/−35 boxes inside the Puxs1. The fragments I (108 bp) and II (120 bp) are indicated. EMSA for 16 fragments fully covering the 228-bp Puxs1 is shown in Supplementary Figures S5-S7. The fragments corresponding to motif_b_10 and motif_b_9 show low binding affinity by MucR1 (Supplementary Figure S5-S7). (B) Schematic view of protein-DNA bridging assay. Black ball, streptavidin magnetic bead; gray-ball-labeled green solid line, biotin-labeled DNA probe; yellow-star-labeled green dashed line, Cy5-labeled DNA probe. (C) MucR1 can bridge the fragment I anchored on beads (Bead-I) and Cy5-labeled I in the supernatant (Cy5-I) (108 bp), or ‘Bead-II’ and ‘Cy5-II’. (D) MucR1 can bridge the 228-bp Puxs1 (filled black circles), or ‘Bead-II + Cy5-I’ (open grey circles) while MucR1Y24G almost loses the bridging function on the 228-bp Puxs1 (filled red circles). Error bars represent SD of four measurements for two biological replicates from one out of two independent experiments. (E) EMSA of the supernatant sample in bridge reaction system showing the dosage dependent interactions between MucR1 or MucR1Y24G and Cy5-labeled DNA probes. (F) Working model for DNA bridging mediated by MucR1 NTD (green). MucR1Y24G is not able to efficiently mediate DNA bridging.
Figure 7.
Figure 7.
Convergent xenogeneic silencers can rescue symbiotic defects of the ΔmucR1&2 mutant. (A) Schematic diagram of domain swap among convergent xenogeneic silencers Lsr2, H-NS and MucR1. (B) In vivo cross-linking experiment of the ΔmucR1&2 mutant derivatives carrying MucR1-FLAG, Lsr2(1–50)-MucR1CTD-FLAG, Lsr2(1–65)-MucR1CTD-FLAG, MucR1NTD-Lsr2(74–112)-FLAG, H-NS(1–89)-MucR1CTD-FLAG, MucR1NTD-H-NS(77–137)-FLAG or H-NS-FLAG. (C) Symbiotic performance of the ΔmucR1&2 mutant derivatives on wild soybean plants. Leaf chlorophyll content and vertical section of nodules are displayed. Different letters indicate significant differences between means (mean ± SEM; ANOVA followed by Duncan's test, alpha = 0.05) of 7–12 plants. (D) Colony phenotypes of test strains on MOPS-buffered MM medium with or without Congo Red.
Figure 8.
Figure 8.
ChIP-seq of the ΔmucR1&2 mutant derivatives harboring convergent xenogeneic silencers. (A) ChIP-seq analysis showing recruitment levels of MucR1-FLAG, H-NS-FLAG, Lsr2(1–65)-MucR1CTD-FLAG, H-NS(1–89)-MucR1CTD-FLAG, MucR1NTD-H-NS(77–137)-FLAG, MucR1Y24G-FLAG, MucR1C82G-FLAG, Lsr2(1–50)-MucR1CTD-FLAG, or MucR1NTD-Lsr2(74–112)-FLAG in the ΔmucR1&2 mutant derivatives. The pooled ChIP-seq data from three independent biological replicates (Supplementary Figure S10) are shown. GC% below (black) and above (gray) the genome average is indicated (window size 5000 bp). (B) Venn diagram showing the number of ChIP-seq peaks specific to each silencer or shared by different silencers. Predicted protein structures of homo-dimer by Alphafold2 are shown (the top 1 model based on local-distance difference test). (C) Silencer recruitment levels of ChIP-seq peaks specific to one strain (1) or shared by different strains (2–5). The number of peaks is shown in brackets. Different letters indicate significant differences between medians (Dunn's test, α = 0.05). Error bars represent SD of mean. Results for individual strains are shown in Supplementary Figure S11. (D) Enrichment analysis of 286 common peak-associated genes regarding replicons. Orange and black bars represent proportions of common peak-associated genes and genome size, respectively. Significant enrichment/depletion is indicated (**P value < 0.01; chi-square test).
Figure 9.
Figure 9.
EMSA showing that MucR1 binds both minor and major grooves of DNA. Release of free probe from MucR1–DNA complex by minor-groove binding reagent netropsin (A) or major-groove binding reagent methyl green (B). Netropsin/methyl green concentration: 10, 20, 40, 80, 160 nM; ‘–’, 0 nM. MucR1 concentration: 10 μM; DNA probe harboring motif_a1 of Puxs1: 10 nM. The numbers below each lane refer to quantified band intensity values of free probes that were calculated by Evolution-Capt Edge software.

Similar articles

Cited by

References

    1. López-García P., Moreira D.. Cultured Asgard archaea shed light on eukaryogenesis. Cell. 2020; 181:232–235. - PubMed
    1. Imachi H., Nobu M.K., Nakahara N., Morono Y., Ogawara M., Takaki Y., Takano Y., Uematsu K., Ikuta T., Ito M.et al. .. Isolation of an archaeon at the prokaryote–eukaryote interface. Nature. 2020; 577:519–525. - PMC - PubMed
    1. Lane N. How energy flow shapes cell evolution. Curr. Biol. 2020; 30:R471–R476. - PubMed
    1. Ryan D.G., Frezza C., Neill L.A.J.O.. TCA cycle signalling and the evolution of eukaryotes. Curr. Opin. Biotechnol. 2021; 68:72–88. - PMC - PubMed
    1. Brunk C.F., Martin W.F.. Archaeal histone contributions to the origin of eukaryotes. Trends Microbiol. 2019; 27:703–714. - PubMed

Publication types

LinkOut - more resources