. 2022 Aug 25;5(11):e202201502.
doi: 10.26508/lsa.202201502. Print 2022 Nov.

Magel2 knockdown in hypothalamic POMC neurons innervating the medial amygdala reduces susceptibility to diet-induced obesity

Affiliations

Magel2 knockdown in hypothalamic POMC neurons innervating the medial amygdala reduces susceptibility to diet-induced obesity

Yuna Choi et al. Life Sci Alliance. .

Abstract

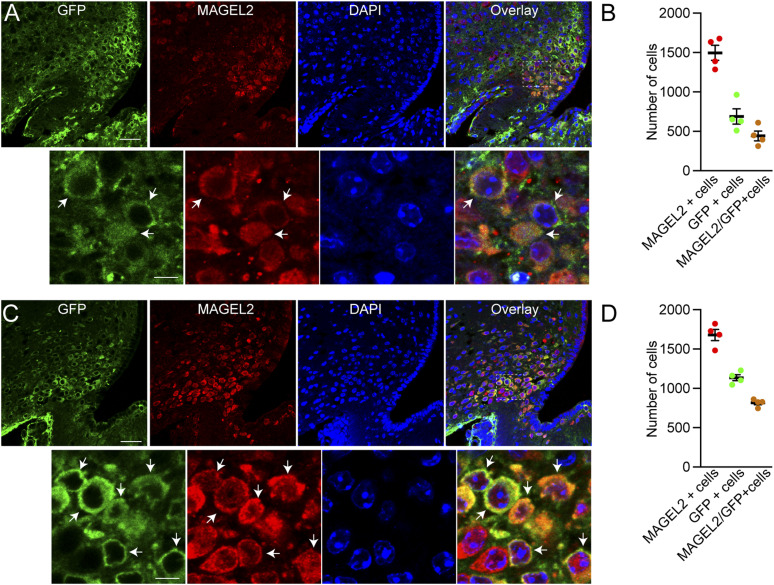
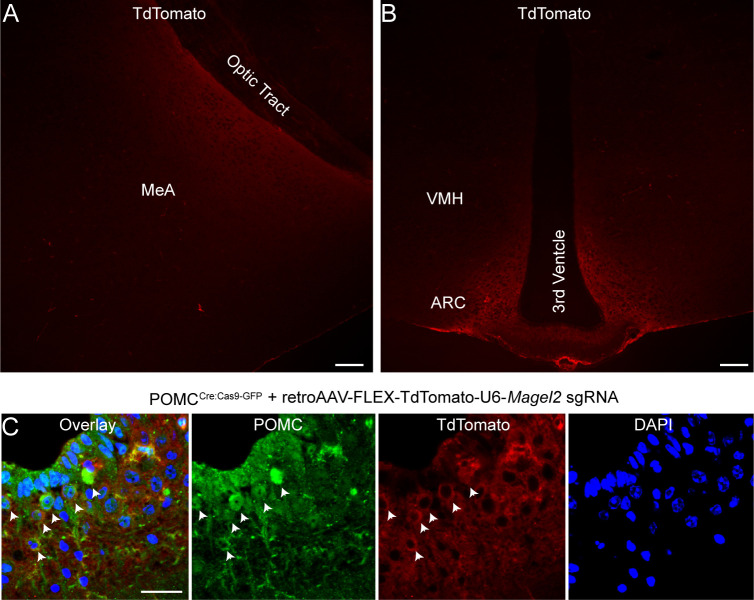
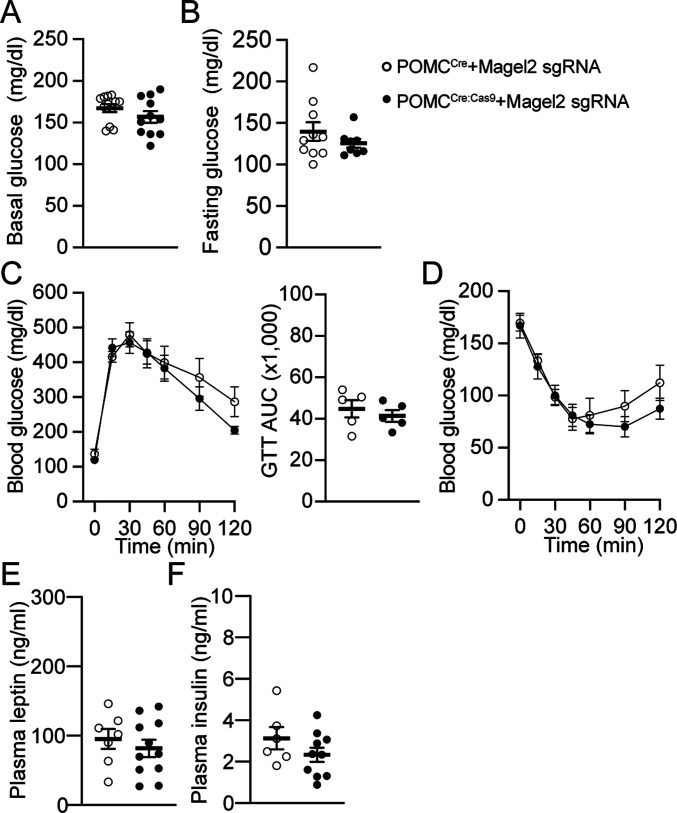
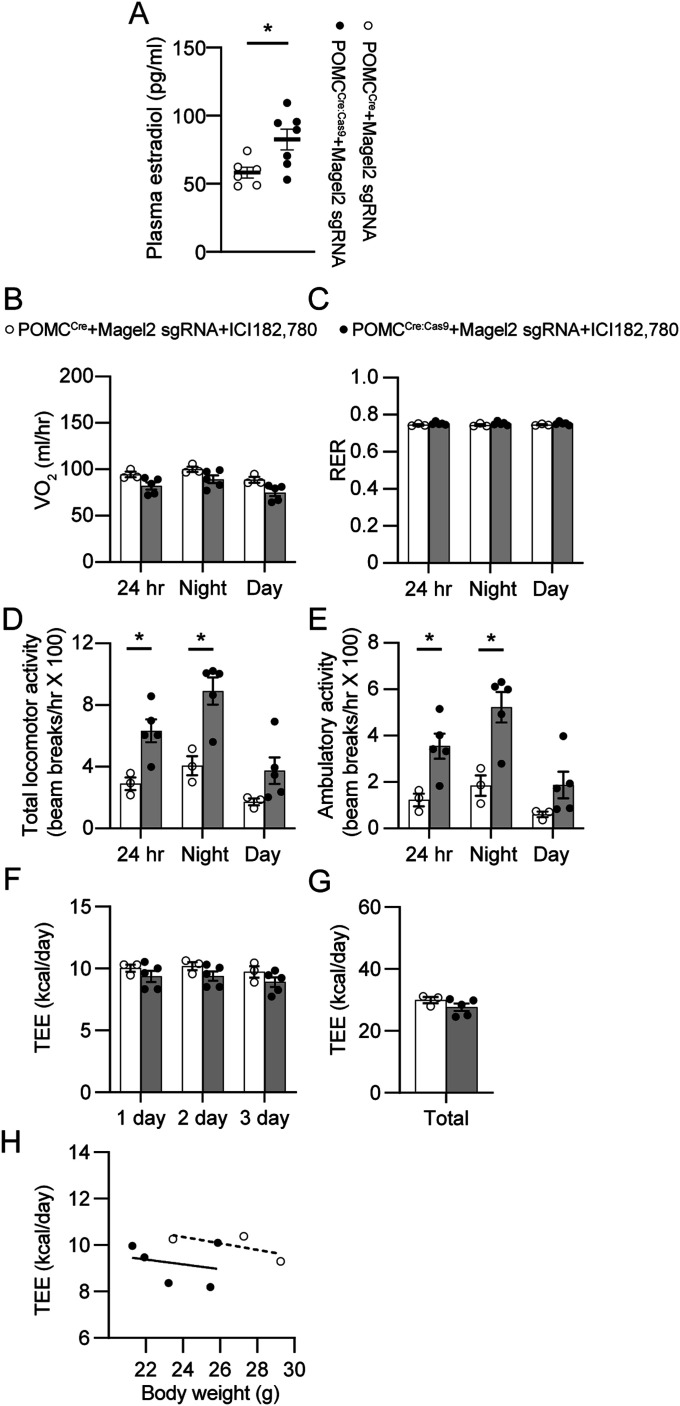
Hyperphagia and obesity profoundly affect the health of children with Prader-Willi syndrome (PWS). The Magel2 gene among the genes in the Prader-Willi syndrome deletion region is expressed in proopiomelanocortin (POMC) neurons in the arcuate nucleus of the hypothalamus (ARC). Knockout of the Magel2 gene disrupts POMC neuronal circuits and functions. Here, we report that loss of the Magel2 gene exclusively in ARCPOMC neurons innervating the medial amygdala (MeA) causes a reduction in body weight in both male and female mice fed with a high-fat diet. This anti-obesity effect is associated with an increased locomotor activity. There are no significant differences in glucose and insulin tolerance in mice without the Magel2 gene in ARCPOMC neurons innervating the MeA. Plasma estrogen levels are higher in female mutant mice than in controls. Blockade of the G protein-coupled estrogen receptor (GPER), but not estrogen receptor-α (ER-α), reduces locomotor activity in female mutant mice. Hence, our study provides evidence that knockdown of the Magel2 gene in ARCPOMC neurons innervating the MeA reduces susceptibility to diet-induced obesity with increased locomotor activity through activation of central GPER.


Conflict of interest statement

The authors declare that they have no conflict of interest.

Figures

Figure 1.
Figure 1.. ARCPOMC neurons express MAGEL2.
(A) Images of confocal fluorescence microscopy showing double immunostaining with anti-GFP (green) and anti-MAGEL2 (red) antibodies in the ARC of male POMCCre:GFP mice. Scale bar: 30 μm. Bottom panel: higher magnification view of neurons co-expressing GFP and MAGEL2 (white arrows). Scale bar: 10 μm. (B) Summary plot showing the number of MAGEL2-positive POMC neurons in the ARC of POMCCre:GFP mice (n = 4 mice). (C) Images of confocal fluorescence microscopy showing double immunostaining with anti-GFP (green) and anti-MAGEL2 (red) antibodies in the ARC of female POMCCre:GFP mice. Scale bar: 30 μm. Bottom panel: higher magnification view of neurons co-expressing GFP and MAGEL2 (white arrows). Scale bar: 10 μm. (D) Summary plot showing the number of MAGEL2-positive POMC neurons in the ARC of POMCCre:GFP mice (n = 4 mice).
Figure 2.
Figure 2.. Loss of the Magel2 gene in ARCPOMC neurons innervating the MeA causes a reduction in body weight while increasing locomotor activity in male mice fed with HFD.
(A) Schematic diagram of the experimental configuration. Retrograde AAV-Magel2 sgRNA viruses were bilaterally injected into the MeA of POMCCre and POMCCre:Cas9-GFP mice. Left panel: Summary plot showing relative expression of the Magel2 gene in the ARC of POMCCre (open circle; n = 10 mice) and POMCCre:Cas9-GFP (closed circle; n = 11 mice) mice receiving retrograde AAV-Magel2 sgRNA viral injection to the MeA. There was a significant difference in Magel2 expression between the two groups. Two-tailed t test, ***P < 0.001. (B) Images of confocal fluorescence microscopy showing MAGEL2 expression in the ARC of POMCCre (left) and POMCCre:Cas9-GFP (right) mice receiving retrograde AAV-Magel2 sgRNA viral injection to the MeA. Scale bar, 30 μm. Right panel: Summary plot showing the number of MAGEL2-positive cells in the ARC of POMCCre (left; n = 4 mice) and POMCCre:Cas9-GFP (right; n = 4 mice) mice receiving retrograde AAV-Magel2 sgRNA viral injection. (C) Pooled data of body weight obtained from POMCCre (open circle; n = 17 mice) and POMCCre:Cas9-GFP (closed circle; n = 14 mice) mice receiving retrograde AAV-Magel2 sgRNA viral injection to the MeA. The loss of the Magel2 gene in ARCPOMC neurons innervating the MeA resulted in body weight loss in male mice fed with HFD for 10 wk. Two-way repeated measures ANOVA followed by Sidak multiple comparisons test (between the groups, F(1, 16) = 8.1, *P < 0.05). (D, E) Pooled data of body composition from POMCCre (n = 13 mice) and POMCCre:Cas9-GFP (n = 12 mice) mice receiving retrograde AAV-Magel2 sgRNA viral injection to the MeA. Two-tailed t test, *P < 0.05. (F) Pooled data showing no significant difference in food intake between the groups (POMCCre, n = 5 mice; POMCCre:Cas9-GFP, n = 8 mice). (G, H) Summary plot showing VO2 (G) and respiratory exchange ratio (H) between the groups. (POMCCre, n = 8 mice, POMCCre:Cas9-GFP, n = 5 mice). (I, J) Pooled data showing increased total and ambulatory activity in mice without the Magel2 gene in ARCPOMC neurons innervating the MeA (POMCCre, n = 8 mice, POMCCre:Cas9-GFP, n = 5 mice). Two-tailed t test, *P < 0.05. (K, L, M) Summary plot showing TEE between the experimental groups. Regression plot showing TEE versus body weight (M).
Figure S1.
Figure S1.. Neuroanatomical specificity of the ARCPOMC→MeA Magel2 KO approach.
(A, B) Images showing tdTomato-expressing structures such as the MeA and ARC in the brain of POMCCre:Cas9 mice receiving Magel2 sgRNA injection in the MeA. Scale bar, 100 μm. (C) Images showing ARCPOMC neurons infected with retroAAV-FLEX-tdTomato-U6-Magel2 sgRNA (white arrowheads). Scale bar, 30 μm.
Figure 3.
Figure 3.. Loss of the Magel2 gene in ARCPOMC neurons innervating the MeA does not alter glucose homeostasis in male mice fed with HFD.
(A, B) Summary plots showing non-fasting (n = 12 mice versus 11 mice) and fasting (n = 10 mice versus 8 mice) blood glucose levels in POMCCre (open circle) and POMCCre:Cas9-GFP (closed circle) mice receiving retrograde AAV-Magel2 sgRNA viral injection to the MeA. (C) Pooled data showing GTT in mice with and without the Magel2 gene in ARCPOMC neurons innervating the MeA (left). Right panel: graphs showing areas under the curves (AUC) values obtained from GTT experiments (two-tailed t test, POMCCre, n = 5 mice, POMCCre:Cas9-GFP, n = 5 mice). (D) Pooled data showing ITT in mice with and without the Magel2 gene in ARCPOMC neurons innervating the MeA. No significant difference was observed between the groups (POMCCre, n = 7 mice, POMCCre:Cas9-GFP, n = 5 mice). Two-way ANOVA followed by Sidak multiple comparisons test, F(1,10) = 0.37. (E, F) Summary plots showing levels of plasma leptin and insulin in mice with and without the Magel2 gene in ARCPOMC neurons innervating the MeA (POMCCre, n = 7 mice, POMCCre:Cas9-GFP, n = 11 mice for leptin; POMCCre, n = 6 mice, POMCCre:Cas9-GFP, n = 10 mice for insulin).
Figure 4.
Figure 4.. Loss of the Magel2 gene in ARCPOMC neurons innervating the MeA causes a reduction in body weight while increasing locomotor activity in female mice fed with HFD.
(A) Summary plot showing relative expression of the Magel2 gene in the ARC of POMCCre (open circle; n = 13 mice) and POMCCre:Cas9-GFP (closed circle; n = 11 mice) mice receiving retrograde AAV-Magel2 sgRNA viral injection to the MeA. Two-tailed t test, ***P < 0.001. (B) Images of confocal fluorescence microscopy showing MAGEL2 expression in the ARC of mice with (left) and without (right) the Magel2 gene in ARCPOMC neurons innervating the MeA. Scale bar, 30 μm. Right panel: Summary plot showing the number of MAGEL2-positive cells in the ARC. *P < 0.05. (C) Pooled data of body weight obtained from POMCCre (open circle, n = 24 mice) and POMCCre:Cas9-GFP (closed circle, n = 18 mice) mice receiving retrograde AAV-Magel2 sgRNA viral injection to the MeA. A significant difference in body weight was observed between the groups. Two-way repeated measures ANOVA followed by Sidak multiple comparisons test (between the groups, F(1, 40) = 8.39, **P < 0.01). (D, E) Pooled data of body composition from POMCCre (n = 13 mice) and POMCCre:Cas9-GFP (n = 12 mice) mice receiving retrograde AAV-Magel2 sgRNA viral injection to the MeA. Two-tailed t test, *P < 0.05. (F) Pooled data showing no significant difference in food intake between the groups (POMCCre, n = 8 mice; POMCCre:Cas9-GFP, n = 6 mice). (G, H) Summary plot showing VO2 (G) and respiratory exchange ratio (H) between the groups. No significant difference in VO2 and respiratory exchange ratio was observed in mice without the Magel2 gene in ARCPOMC neurons innervating the MeA (POMCCre, n = 5 mice; POMCCre:Cas9-GFP, n = 6 mice). (I) Pooled data showing increased total and ambulatory activity in mice without the Magel2 gene in ARCPOMC neurons innervating the MeA (POMCCre, n = 5 mice; POMCCre:Cas9-GFP, n = 6 mice). Two-tailed t test, *P < 0.05; **P < 0.01. (K, L, M) Summary plot showing TEE between the experimental groups. Regression plot showing TEE versus body weight (M).
Figure 5.
Figure 5.. Loss of the Magel2 gene in ARCPOMC neurons innervating the MeA does not change glucose homeostasis in female mice fed with HFD.
(A, B) Summary plots showing non-fasting and fasting blood glucose levels in POMCCre (open circle) and POMCCre:Cas9-GFP (closed circle) mice receiving retrograde AAV-Magel2 sgRNA viral injection to the MeA (POMCCre, n = 19 mice and POMCCre:Cas9-GFP, n = 8 mice for non-fasting blood glucose; POMCCre, n = 17 mice and POMCCre:Cas9-GFP, n = 9 mice for fasting blood glucose). (C) Pooled data showing GTT in mice with and without the Magel2 gene in ARCPOMC neurons innervating the MeA (left). Right panel: graphs showing AUC values obtained from GTT experiments (two-tailed t test, POMCCre, n = 6 mice; POMCCre:Cas9-GFP, n = 6 mice). (D) Pooled data showing ITT in mice with and without the Magel2 gene in ARCPOMC neurons innervating the MeA. No significant difference was observed between the groups. (E, F) Summary plots showing levels of plasma leptin and insulin in mice with and without the Magel2 gene in ARCPOMC neurons innervating the MeA (POMCCre, n = 5 mice, POMCCre:Cas9-GFP, n = 7 mice for leptin; POMCCre, n = 5 mice, POMCCre:Cas9-GFP, n = 6 mice for insulin).
Figure 6.
Figure 6.. Central ER-α does not contribute to the regulation of locomotor activity in female mice without the Magel2 gene in ARCPOMC neurons innervating the MeA.
(A) Pooled data showing plasma estradiol levels between the groups. Estradiol levels were higher in female mice without the Magel2 gene in ARCPOMC neurons innervating the MeA than in controls (POMCCre, n = 6 mice; POMCCre:Cas9-GFP, n = 7 mice). Two-tailed test, *P < 0.05. (B, C) Summary plots showing VO2 and respiratory exchange ratio between the experimental groups with ICI 182,780 infusion. At 10 wk of viral injection, the ER-α antagonist ICI 182,780 (40 ng/day) was infused into the LV via osmotic pumps at a rate of 0.25 μl/hour. (D, E) Pooled data showing total and ambulatory activity between the experimental groups with ICI 182,780 infusion. An increase in locomotor activity was still observed in mice without the Magel2 gene in ARCPOMC neurons innervating the MeA after treatment with ICI 182,780 (two-tailed t test, night, *P < 0.05; 24 h, *P < 0.05). (F, G, H) Summary plot showing TEE between the experimental groups. Regression plot showing TEE versus body weight (H).
Figure 7.
Figure 7.. Central GPER is critical in regulating locomotor activity in female mice without the Magel2 gene in ARCPOMC neurons innervating the MeA.
(A) Images of confocal fluorescence microscopy showing expression of GPER in the VMH (middle) and MeA (right) in female mice. Scale bar: 100 μm. (B, C) Summary plots showing VO2 and respiratory exchange ratio between the experimental groups with G-15 infusion. At 10 wk of viral injection, the GPER antagonist G15 (5 μg/day [Mallet et al, 2021]) was infused into the LV via osmotic pumps at a rate of 0.25 μl/hour. There were no significant differences in VO2 and respiratory exchange ratio between the experimental groups. (D, E) Pooled data showing total and ambulatory activity between the experimental groups with G-15 infusion. An increase in locomotor activity was not observed in mice without the Magel2 gene in ARCPOMC neurons innervating the MeA following treatment with G-15 infusion. (F, G, H) Summary plot showing TEE between the experimental groups. Regression plot showing TEE versus body weight (H).

Similar articles

Cited by

References

    1. Alfaro DL, Lemoine P, Ehlinger V, Molinas C, Diene G, Valette M, Pinto G, Coupaye M, Poitou-Bernert C, Thuilleaux D, et al. (2019) Causes of death in prader-willi syndrome: Lessons from 11 years’ experience of a national reference center. Orphanet J Rare Dis 14: 238. 10.1186/s13023-019-1214-2 - DOI - PMC - PubMed
    1. Balthasar N, Dalgaard LT, Lee CE, Yu J, Funahashi H, Williams T, Ferreira M, Tang V, McGovern RA, Kenny CD, et al. (2005) Divergence of melanocortin pathways in the control of food intake and energy expenditure. Cell 123: 493–505. 10.1016/j.cell.2005.08.035 - DOI - PubMed
    1. Biglari N, Gaziano I, Schumacher J, Radermacher J, Paeger L, Klemm P, Chen W, Corneliussen S, Wunderlich CM, Sue M, et al. (2021) Functionally distinct pomc-expressing neuron subpopulations in hypothalamus revealed by intersectional targeting. Nat Neurosci 24: 913–929. 10.1038/s41593-021-00854-0 - DOI - PMC - PubMed
    1. Bischof JM, Stewart CL, Wevrick R (2007) Inactivation of the mouse magel2 gene results in growth abnormalities similar to prader-willi syndrome. Hum Mol Genet 16: 2713–2719. 10.1093/hmg/ddm225 - DOI - PubMed
    1. Boccaccio I, Glatt-Deeley H, Watrin F, Roeckel N, Lalande M, Muscatelli F (1999) The human magel2 gene and its mouse homologue are paternally expressed and mapped to the prader-willi region. Hum Mol Genet 8: 2497–2505. 10.1093/hmg/8.13.2497 - DOI - PubMed

Publication types

Associated data