Review
. 2022 Sep;43(9):1230-1243.
doi: 10.3174/ajnr.A7613. Epub 2022 Aug 25.

Multimodality Imaging in Primary Progressive Aphasia

Affiliations
Review

Multimodality Imaging in Primary Progressive Aphasia

M Roytman et al. AJNR Am J Neuroradiol. 2022 Sep.

Abstract

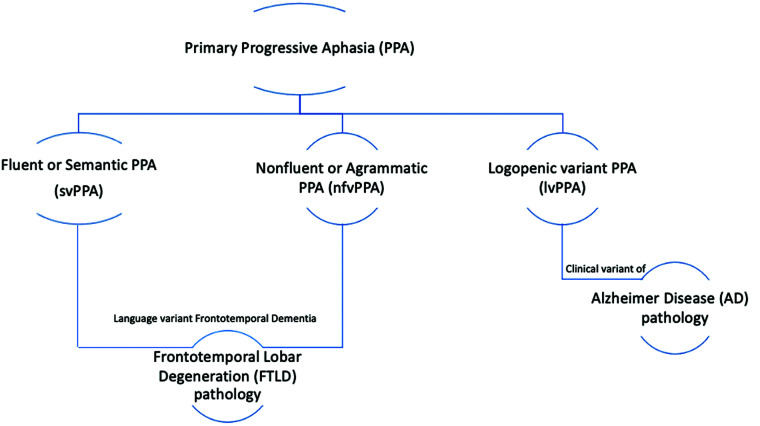
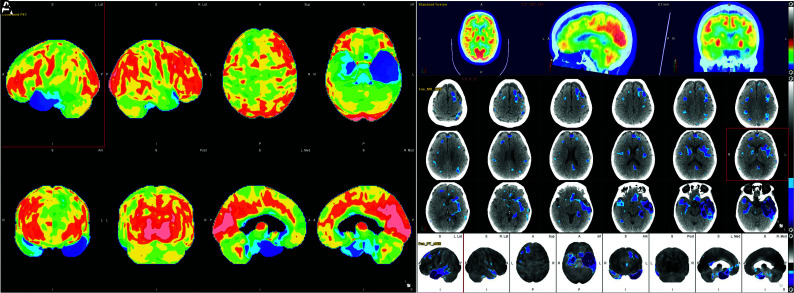
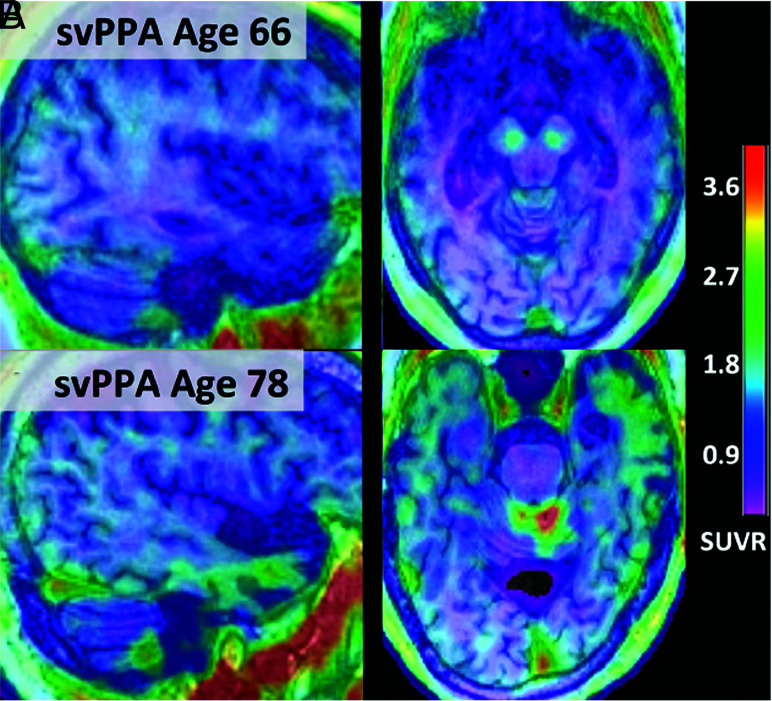
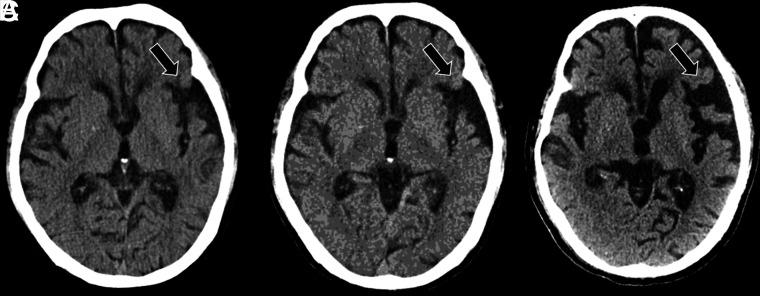
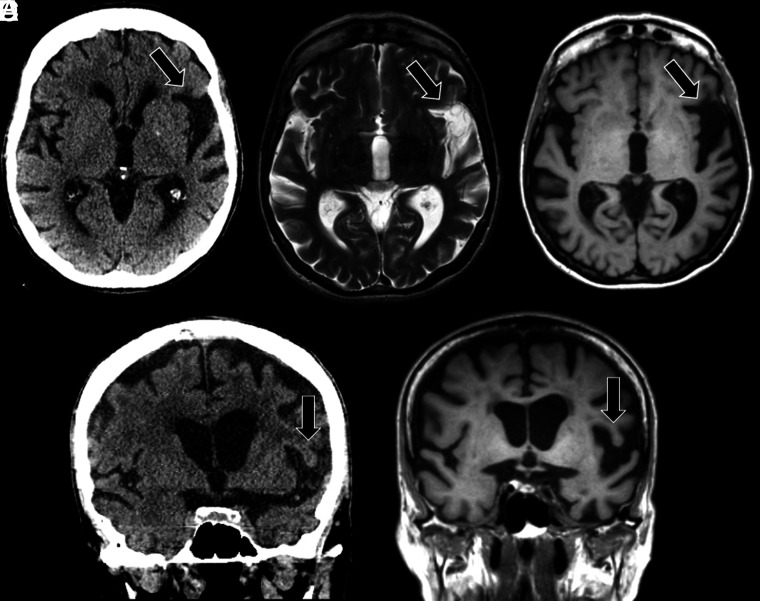
Primary progressive aphasia is a clinically and neuropathologically heterogeneous group of progressive neurodegenerative disorders, characterized by language-predominant impairment and commonly associated with atrophy of the dominant language hemisphere. While this clinical entity has been recognized dating back to the 19th century, important advances have been made in defining our current understanding of primary progressive aphasia, with 3 recognized subtypes to date: logopenic variant, semantic variant, and nonfluent/agrammatic variant. Given the ongoing progress in our understanding of the neurobiology and genomics of these rare neurodegenerative conditions, accurate imaging diagnoses are of the utmost importance and carry implications for future therapeutic triaging. This review covers the diverse spectrum of primary progressive aphasia and its multimodal imaging features, including structural, functional, and molecular neuroimaging findings; it also highlights currently recognized diagnostic criteria, clinical presentations, histopathologic biomarkers, and treatment options of these 3 primary progressive aphasia subtypes.


Figures

FIG 1.
FIG 1.
PPA is divided into 3 recognized variants: svPPA, nfvPPA, and lvPPA. svPPA and nfvPPA exhibit FTLD pathology; svPPA and nfvPPA are considered to be language-variant frontotemporal dementias. lvPPA is a clinical variant of AD.
FIG 2.
FIG 2.
Coronal T1-weighted MR imaging (A), axial T1-weighted MR imaging (B), and sagittal T1-weighted MR imaging (C) in a right-handed individual with impaired repetition of phrases demonstrate asymmetric widening of the left Sylvian fissure with left posterior peri-Sylvian and temporoparietal atrophy (white arrows, A–C), suspicious for lvPPA.
FIG 3.
FIG 3.
Voxel-level imaging findings in lvPPA and dementia of the Alzheimer type (DAT) compared with controls. 3D renderings show regions of reduced FDG metabolism and GM volume in lvPPA compared with controls and in DAT compared with controls. Note, lvPPA demonstrates hypometabolism and focal atrophy primarily in the left lateral temporal and inferior parietal lobes (including the left angular and supramarginal gyri) and left precuneus and left posterior cingulate gyrus. Adapted with permission from Madhavan et al. R indicates right; L, left.
FIG 4.
FIG 4.
[18F] FDG-PET cortical surface maps demonstrate an abnormal FDG distribution pattern with moderate-to-severe hypometabolism in the left, lateral temporoparietal lobes including in the left precuneus and posterior cingulate gyrus (A), with corresponding disproportionate cortical atrophy in the lateral left temporoparietal region visualized on brain CT (B), findings are further supported by a semiquantitative FDG-PET analysis using z scores calculated in comparison with age-matched cognitively healthy controls, demonstrating markedly decreased values in the left parietal and left lateral temporal regions, including in the precuneus and posterior cingulate gyrus (B).
FIG 5.
FIG 5.
[18F] florbetaben PET axial gray-scale (A), axial color map fused to a T1-weighted MR image (B), and left lateral 3D stereotactic surface projection (C) demonstrate focal areas of increased cortical β-amyloid deposition in the left temporal lobe (arrows).
FIG 6.
FIG 6.
Coronal T1-weighted MR imaging (A), axial T1-weighted MR imaging (B), and axial T2-weighted MR imaging (C) in a right-handed individual with impaired single-word comprehension demonstrate marked asymmetric atrophy of the anterior left temporal lobe (white arrows, A–C), suspicious for svPPA.
FIG 7.
FIG 7.
Axial T1-weighted MR imaging (A) and axial and coronal T1-weighted MR imaging fused with [18F] FDG-PET (B and C) in a left-handed individual with impaired single-word comprehension demonstrate marked asymmetric atrophy of the anterior right temporal lobe (black arrow, A) with corresponding marked hypometabolism (white asterisks, B and C) due to svPPA.
FIG 8.
FIG 8.
[18F] FDG-PET (A), axial T1 (B), and PET MR imaging (C) views demonstrate an abnormal FDG distribution pattern with markedly decreased tracer uptake in the temporal lobes, particularly in the left temporal pole. There is corresponding advanced cortical atrophy with a “knife-blade” appearance in the left anterior temporal lobe on the axial T1 sequence.
FIG 9.
FIG 9.
[18F] FDG-PET cortical surface maps demonstrate an abnormal FDG distribution pattern with severe left and moderate right hypometabolism in the anterior temporal lobes (A), with corresponding disproportionate cortical atrophy, particularly pronounced in the left temporal pole visualized on brain CT images (B), findings further supported by semiquantitative FDG-PET analysis using z scores calculated in comparison with findings in age-matched cognitively healthy controls, semiquantitative FDG-PET analysis demonstrate markedly decreased values in the temporal lobes including the temporal poles (left > right) (B).
FIG 10.
FIG 10.
Fused [18F] PI-2620 τ-PET and T1 MPRAGE MR imaging from subjects 66 (A) and 78 years of age (B) with semantic PPA. Notably, [18F] PI-2620 has a low affinity for monoamine oxidase, and subject A demonstrates no focal increased tracer uptake. However, subject B shows binding spanning the anterior and lateral temporal lobes (left greater than right) with corresponding atrophy on MR imaging. Adapted with permission from Mormino et al.
FIG 11.
FIG 11.
Serial axial CT scans at presentation (A), 2 years post-initial presentation (B), and 4 years post-initial presentation (C) in a right-handed individual with progressive language deficits demonstrate progressive widening of the left-greater-than-right Sylvian fissures (black arrows, A–C), suspicious for nfvPPA.
FIG 12.
FIG 12.
Axial CT (A), axial T2-weighted MR imaging (B), axial T1-weighted MR imaging (C), coronal CT (D), and coronal T1-weighted MR imaging (E) in a right-handed individual with apraxia of speech demonstrate asymmetric widening of the left Sylvian fissure with predominant left posterior frontoinsular atrophy (black arrows, A–E), suspicious for nfvPPA.
FIG 13.
FIG 13.
[18F] FDG-PET cortical surface maps demonstrate an abnormal FDG distribution pattern with severe left-greater-than-right hypometabolism, most pronounced in the dorsal frontal lobes and left peri-insular region (A), with corresponding disproportionate cortical atrophy particularly pronounced in the left insular region visualized on brain MR views (B), findings further supported by semiquantitative FDG-PET analysis using z scores calculated in comparison with age-matched cognitively healthy controls, demonstrating markedly decreased values in the left > right peri-insular region, including in the pars opercularis and pars triangularis of the left inferior frontal gyrus, corresponding to the expected Broca area (B).
FIG 14.
FIG 14.
[18F] flortaucipir in nfvPPA. A, On voxelwise comparison with healthy controls, agPPA demonstrates increased uptake in the left-greater-than-right frontal operculum; middle and inferior frontal gyri; and left superior frontal gyrus (pFWE < .05). B, The W score frequency map demonstrates elevated W scores above 1.65 in the bilateral middle frontal gyri and frontal operculum in approximately two-thirds of patients scanned, with voxels above 1.65 in 8 of 11 patients in peak areas. C, ROI analyses reveals group differences in those with in nfvPPA compared with controls in the bilateral pars opercularis (left, P = .0001; right, P = .0018), pars triangularis (left, P = .0016; right, P = .0029), precentral gyrus (left, P = .003; right. P = .0112), and superior frontal gyrus (left, P = .03; right, P = .045). Adapted with permission from Tsai et al.
FIG 15.
FIG 15.
Representative [18F] flortaucipir images from 11 patients with nfvPPA and corresponding single-subject W score maps. Tracer retention in the frontal operculum and inferior or middle frontal gyrus is seen in all scans to varying degrees and is more pronounced on the left side. Patients 1–7 show additional bilateral-but-asymmetric frontal WM binding, while patients 8–11 demonstrate mild uptake in the prefrontal cortex. All scans show varying degrees of uptake in the bilateral basal ganglia. Adapted with permission from Tsai et al.

References

    1. Patel KP, Wymer DT, Bhatia VK, et al. . Multimodality imaging of dementia: clinical importance and role of integrated anatomic and molecular imaging. Radiographics 2020;40:200–22 10.1148/rg.2020190070 - DOI - PMC - PubMed
    1. Brown RKJ, Bohnen NI, Wong KK, et al. . Brain PET in suspected dementia: patterns of altered FDG metabolism. Radiographics 2014;34:684–701 10.1148/rg.343135065 - DOI - PubMed
    1. Irwin DJ. Tauopathies as clinicopathological entities. Parkinsonism Relat Disord 2016;22:S29–33 10.1016/j.parkreldis.2015.09.020 - DOI - PMC - PubMed
    1. Montembeault M, Brambati SM, Gorno-Tempini ML, et al. . Clinical, anatomical, and pathological features in the three variants of primary progressive aphasia: a review. Front Neurol 2018;9:692 10.3389/fneur.2018.00692 - DOI - PMC - PubMed
    1. Spinelli EG, Mandelli ML, Miller ZA, et al. . Typical and atypical pathology in primary progressive aphasia variants. Ann Neurol 2017;81:430–43 10.1002/ana.24885 - DOI - PMC - PubMed

Publication types

LinkOut - more resources