. 2022 Aug 25;13(1):4975.
doi: 10.1038/s41467-022-32523-6.

Epithelial-mesenchymal plasticity determines estrogen receptor positive breast cancer dormancy and epithelial reconversion drives recurrence

Affiliations

Epithelial-mesenchymal plasticity determines estrogen receptor positive breast cancer dormancy and epithelial reconversion drives recurrence

Patrick Aouad et al. Nat Commun. .

Abstract

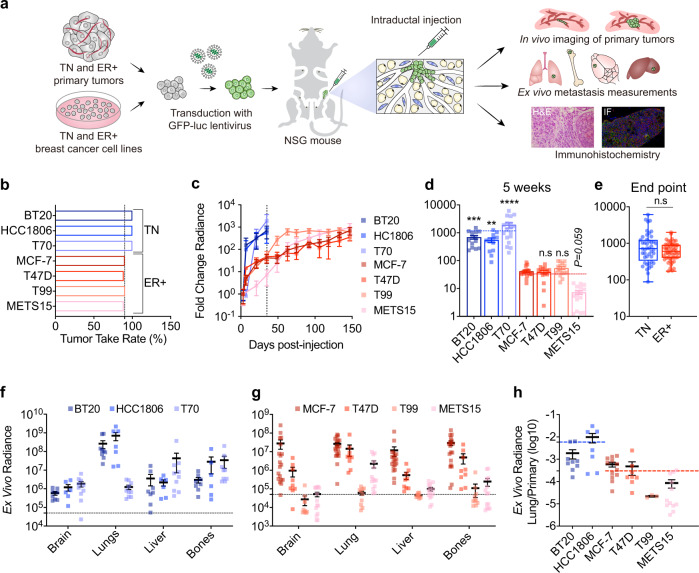
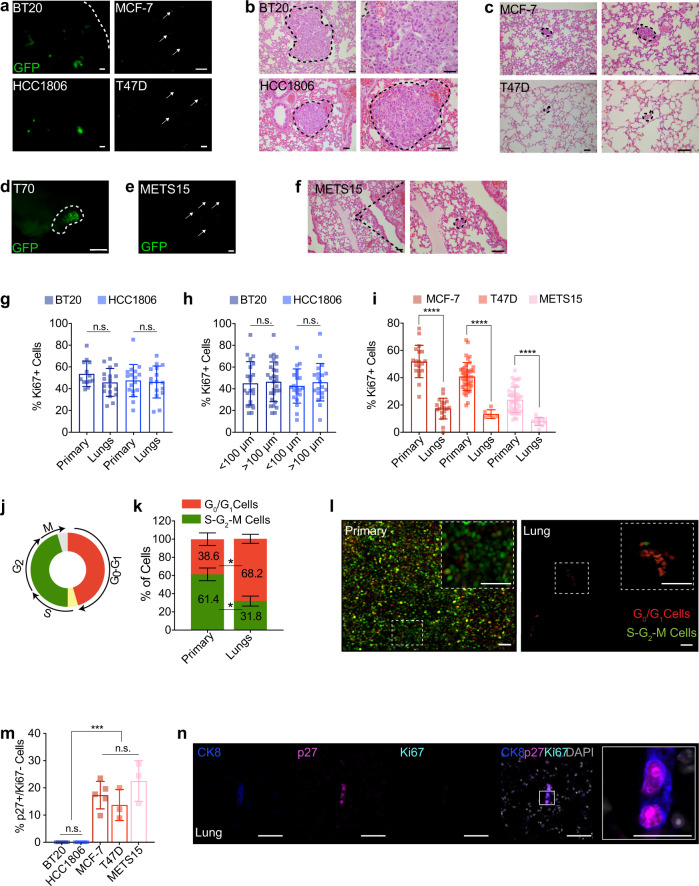
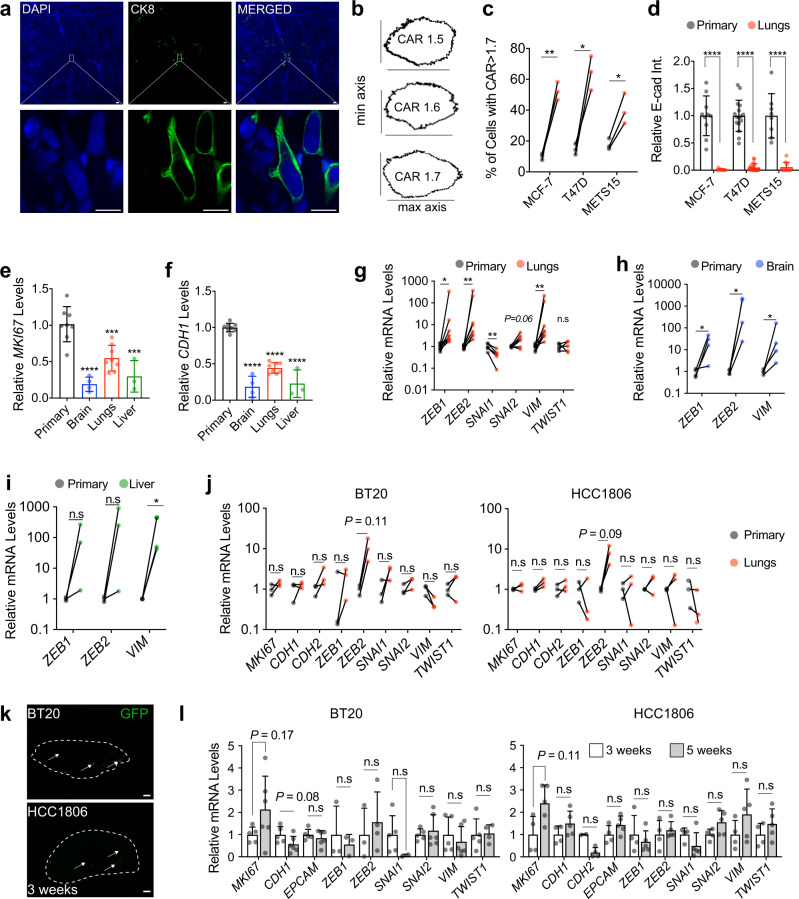
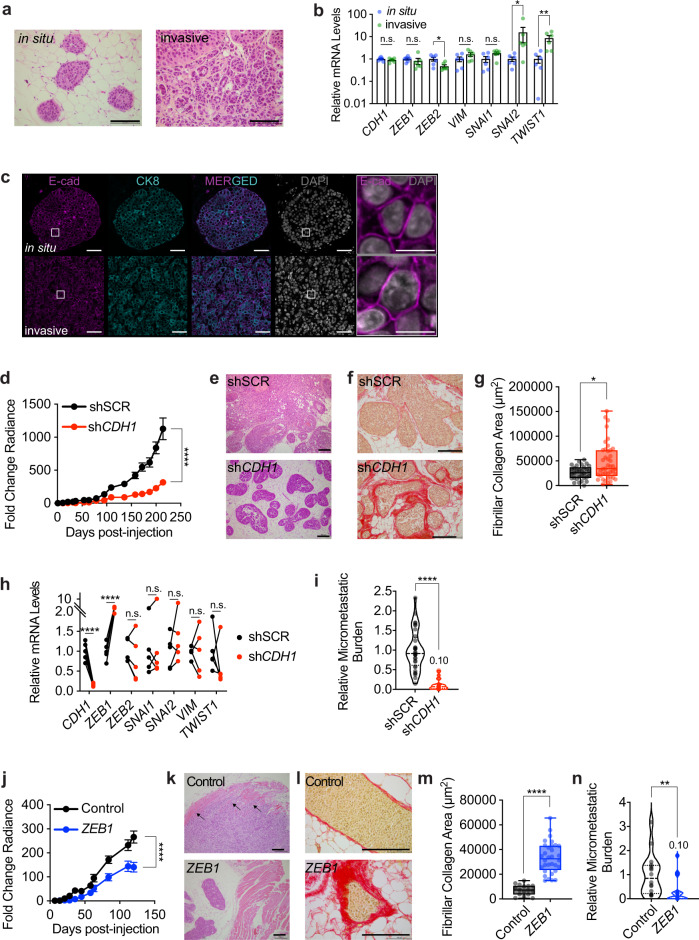
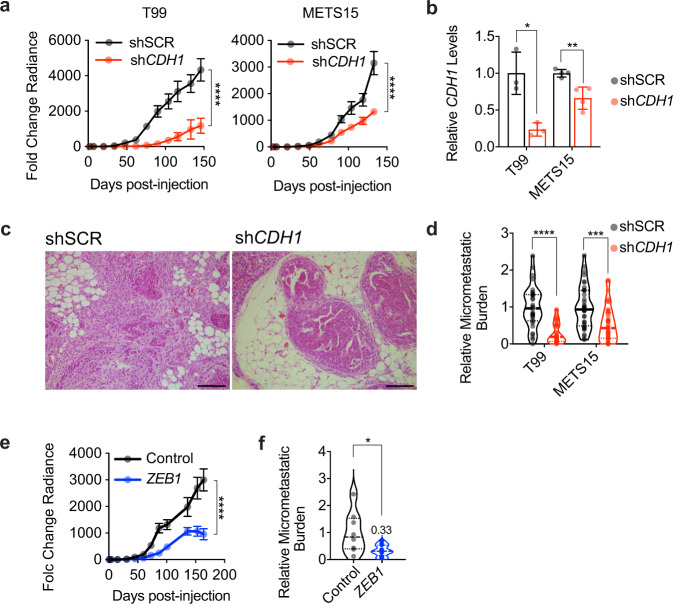
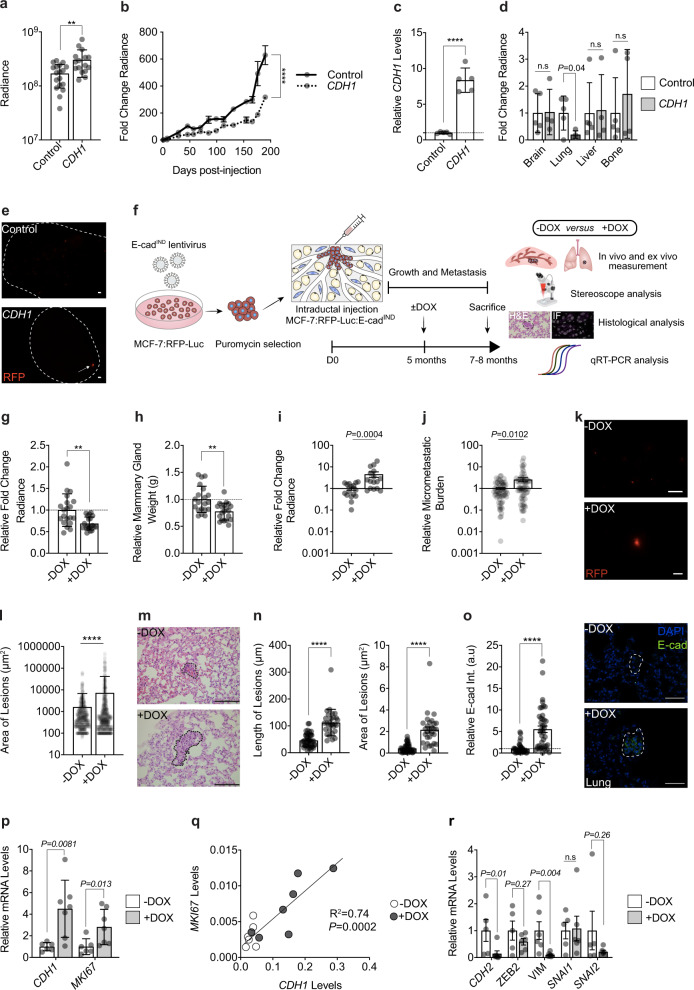
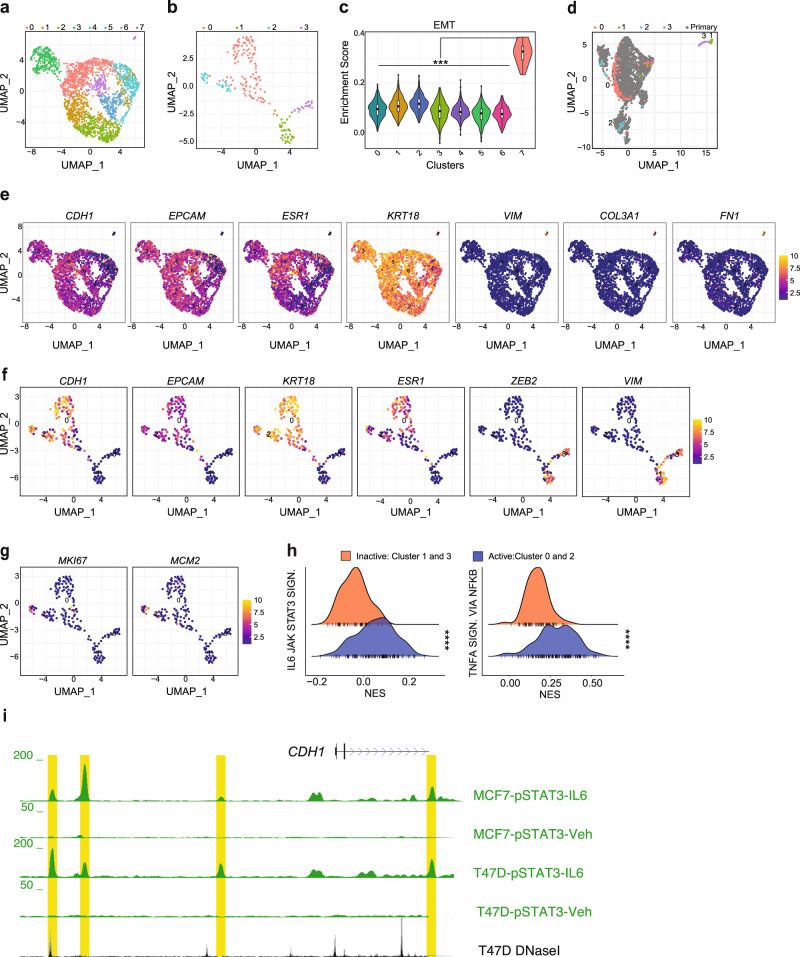
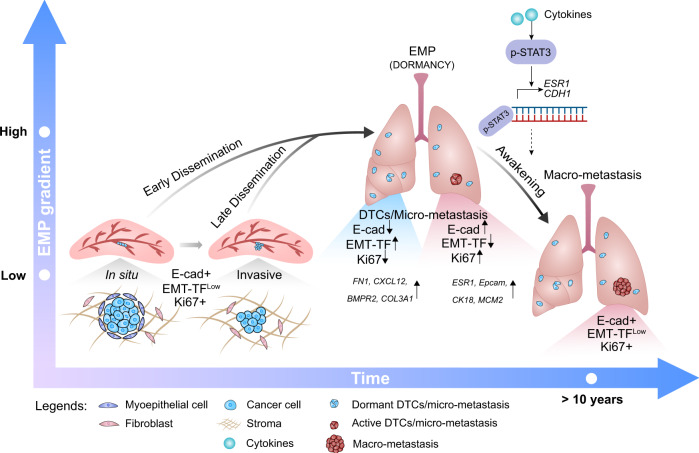
More than 70% of human breast cancers (BCs) are estrogen receptor α-positive (ER+). A clinical challenge of ER+ BC is that they can recur decades after initial treatments. Mechanisms governing latent disease remain elusive due to lack of adequate in vivo models. We compare intraductal xenografts of ER+ and triple-negative (TN) BC cells and demonstrate that disseminated TNBC cells proliferate similarly as TNBC cells at the primary site whereas disseminated ER+ BC cells proliferate slower, they decrease CDH1 and increase ZEB1,2 expressions, and exhibit characteristics of epithelial-mesenchymal plasticity (EMP) and dormancy. Forced E-cadherin expression overcomes ER+ BC dormancy. Cytokine signalings are enriched in more active versus inactive disseminated tumour cells, suggesting microenvironmental triggers for awakening. We conclude that intraductal xenografts model ER + BC dormancy and reveal that EMP is essential for the generation of a dormant cell state and that targeting exit from EMP has therapeutic potential.


Conflict of interest statement

The authors declare no competing interests.

Figures

Fig. 1
Fig. 1. ER+ and TN BC cells show distinct growth and metastatic behavior.
a Scheme illustrating the intraductal xenografting approach used in this study. Η&E: Haematoxylin & Eosin, IF: Immunofluorescence. b Bar graph showing take rates for TN (blue) and ER+ (red) BC cells injected intraductally, 13–19 mammary glands of 5–9 mice injected in each group. The vertical dashed line indicates 90%. c Graph showing the fold-change of bioluminescence over time for all intraductal xenografts. Data represent mean ± SEM of 13-19 mammary glands from 5–9 mice in each group. The dashed line indicates the experimental end-point for TNBC xenografts. d Fold-change of bioluminescence at 5 weeks after intraductal injection. Data represent mean ± SEM of 13–19 mammary glands from 5 to 9 mice in each group. Blue and red dashed lines represent the average change bioluminescence of TN (1148 fold) and ER+ BC (32 fold), respectively. One-way ANOVA, Kruskal-Wallis test relative to MCF-7 (control). e Box plot showing the fold-change of bioluminescence at endpoint for TN (5 weeks) and ER+ (5-6 months) BC cells from Fig. 1c. Boxes span the 25th to 75th percentile, whiskers 1.5 times the interquartile range. Boxplot whiskers show minimum and maximum values. Two-tailed Mann-Whitney test. f, g Bar plot showing ex vivo bioluminescence of resected organs from 9, 7, and 6 mice bearing BT20, HCC1806, and T70 xenografts, respectively, f and 20, 9, 10, and 14 mice bearing MCF-7, T47D, T99, METS15 xenografts, respectively, g Data represent mean ± SEM. h Dot plot showing the ratio of bioluminescence in lungs over primary tumor. Data represent mean ± SEM of n = 9 (BT20), 7 (HCC1806), 12 (MCF-7), 8 (T47D), 3 (T99) and 12 (METS15) mice. Blue and red dashed lines represent the average ratio for TN and ER + BC cells, respectively.
Fig. 2
Fig. 2. ER+ metastatic lesions are dormant.
a Representative fluorescence stereo micrographs of lungs from ≥ 3 mice with BT20, HCC1806, MCF-7, or T47D intraductal xenografts, arrows point to DTCs. Scale bar, 1 mm. b, c Representative micrographs of H&E stained lung sections from 3 mice bearing BT20 and HCC1806 (b) or MCF-7 and T47D (c) intraductal xenografts. Scale bar, 50 µm. d, e Representative fluorescence stereo micrographs of the liver (d) and lungs (e) from ≥3 mice bearing T70 and METS15 MIND xenografts. Scale bars, 1 mm. f Representative micrographs of H&E stained lung sections from 3 mice bearing METS15 intraductal xenografts. Scale bars, 50 µm. g Percentage of Ki67+ cells in matched primary and lung sections from mice 5 weeks after intraductal injection of BT20 and HCC1806 cells, n ≥ 14 sections. h Bar graph showing Ki67 index of BT20 and HCC1806 lung lesions of different sizes. i Ki67+ index in matched primary tumor and lung sections from mice 5 months after intraductal injection of MCF-7, T47D, and METS15 cells as indicated. In g and i each data point represents ≥ 1,000 and 100 cells analyzed, mean ± SD from ≥3 mice/condition, respectively. gh Data represent mean ± SD from 3 different hosts. Student’s unpaired t-test, two-tailed. j Scheme of FUCCI reporter. k Bar plot showing percentage of cycling and non-cycling cells in primary tumors and in lung micro-metastases in MCF-7 intraductal xenografts-bearing mice. Data represent mean ± SD from 3 host mice. Paired t-test. l Representative fluorescence micrographs of MCF-7:FUCCI cells in matched primary tumor (left) and lung (right). Scale bars, 50 µm. m Bar plot showing the percentage of p27+Ki67- cells over total human cells in the lung. Data represent mean ± SD from n ≥ 3 mice, and dots represent ≥40 cells analyzed. One-way ANOVA. n Representative immunofluorescence micrographs for CK8 (blue), p27 (magenta) and Ki67 (cyan), counterstained with DAPI (gray) on lung section from MCF-7-bearing mice. Scale bar, 50 µm; inlet, 20 µm. *, ***, ****, and n.s represent P < 0.05, 0.001, 0.0001, and not significant, respectively.
Fig. 3
Fig. 3. Dormant DTCs from ER+ intraductal xenografts have an EMP signature.
a CK8 staining on optically-cleared sections of METS15 cells in host’s lungs. Scale bars, 10 µm. b Representative masks representing different cellular aspect-ratio (CAR) with respect to the morphology c Percentage of cells with CAR > 1.7 in matched primary tumors and in the lung from intraductal ER+ BC xenografts-bearing mice. Data represent mean ± SD, each data point represents at least 100 primary cells and 10 lung DTCs from 3 mice. Paired Student’s t-test. d Relative E-cad intensity (Int.) in matched primary tumor cells and lung DTCs in mice bearing indicated intraductal xenografts. Data represent n≥8 images, mean ± SD from 3 mice. Students t-test e, f Relative MKI67 (e) and CDH1 (f) mRNA levels in MCF-7 cells in the primary tumor (8 mice) or in the lung (n = 8), brain (n = 4), and liver (n = 3) DTCs. Data represent mean ± SD. One-way ANOVA. g–i Relative levels of indicated mRNAs in matched MCF-7 primary tumors and lung (g n = 8), brain (h n = 4), and liver (i n = 3) DTCs. Wilcoxon test. j Relative levels of indicated mRNAs in matched BT20 or HCC1806 primary tumors and lung metastases from 3 mice. Paired t-test. k Representative fluorescence stereo micrographs of lungs from at least 3 mice 3 weeks after intraductal injection of BT20 or HCC1806 cells. Arrows point to micro-metastases. Scale bar, 1 mm. l. Relative mRNA levels of the selected genes in 3 versus 5-6 weeks lung DTCs retrieved from at least 4 mice bearing BT20 (left) or HCC1806 (right), n ≥ 4. Data represent mean ± SD, Wilcoxon test. Gene expression was normalized to the geometric mean of GAPDH and HPRT in panels ej, and l. *, **, ***, ****, and n.s. represent P < 0.05, 0.01, 0.001, 0.0001, and not significant, respectively.
Fig. 4
Fig. 4. Role of EMP in ER+ tumor progression.
a Representative H&E micrographs of in situ and invasive MCF-7 intraductal xenografts, scale bars, 100 µm. b Relative mRNA levels of marker genes in in situ and invasive MCF-7 intraductal xenografts. Data represent mean ± SD from 6 glands in 3 mice, non-parametric Mann-Whitney test. c Representative E-cad IF micrographs in in situ and invasive MCF-7 intraductal xenografts, scale bars, 50 µm; inlet, 10 µm. d Fold-change radiance of MCF-7 shSCR and shCDH1 in intraductal xenografts, mean ± SEM, n = 19 or 20 xenografts from 5 mice/condition. Two-way ANOVA, multiple comparisons. e, f Representative micrographs of H&E (e) and sirius red (f) stained MCF-7.shSCR and shCDH1 xenografts from ≥3 mice. Scale bars, 200 µm. g Box plot showing the area of collagen deposition from n ≥ 31 ducts, ≥3 mice. Boxes span the 25th to 75th percentile, whiskers 1.5 times the interquartile range. Boxplot whiskers show minimum and maximum values. h Relative mRNA levels of n = 5 contralateral MCF-7:shSCR and shCDH1 xenografts, 5 mice. Paired t-test. i Relative micro-metastatic burden in 7 MCF-7 shSCR and 8 MCF-7 shCDH1 tumor-bearing mice. Each dot represents a single organ, the dashed line indicates the median and dotted lines indicate the lower and upper quartiles. Unpaired Student’s t-test. j Fold-change radiance of control and MCF-7:ZEB1 xenografts, data represent mean ± SEM, n = 16 glands, 4 mice each. Two-way ANOVA, multiple comparisons. k, l Representative micrographs of H&E (k) and sirius red (l) stained thoracic mammary glands bearing control or MCF-7:ZEB1 cells, 3 mice each. Arrows indicate muscle invasion in thoracic mammary glands. Scale bars, 200 µm. m Box plot showing area of collagen deposition, n ≥ 17 ducts, ≥3 mice. Boxes span the 25th to 75th percentile, whiskers 1.5 times the interquartile range. Boxplot whiskers show minimum and maximum values. n Violin plot of the relative micro-metastatic burden from control and MCF-7:ZEB1 intraductal xenografts-bearing mice. Dashed line indicates the median, dotted lines indicate the lower and upper quartiles. Unpaired Student’s t-test. All mRNA expression levels were normalized to the geometric mean of GAPDH and TBP. *, **, ***, ****, and n.s. represent P < 0.05, 0.01, 0.001, 0.0001, and not significant, respectively.
Fig. 5
Fig. 5. Role of EMP in ER+ PDX progression.
a Growth curve of intraductal T99 and METS15 shSCR or shCDH1. Data represent mean ± SEM of 16 xenograft glands for each shSCR and shCDH1 groups for T99 and 16 and 20 xenograft glands, respectively, for METS15, 5 mice for each cohort. Two-way ANOVA, multiple comparisons. b Relative CDH1 expression in shSCR and shCDH1 intraductal xenografts (3 each for T99 and 4 each for METS15). Data represent mean ± SD. Unpaired Student’s t-test. c Representative H&E micrographs of T99 shSCR and shCDH1 xenograft glands. Scale bar, 200 µm. d Violin plot of the relative micro-metastatic burden in T99 and METS15 intraductal xenografts-bearing mice. The dashed line indicates the median and dotted lines indicate the lower and upper quartiles. Each dot represents a single organ. Unpaired Student’s t-test. e Growth curve of vector control and ZEB1-overexpressing T99 intraductal xenografts. Data represent mean ± SEM of 15 and 18 xenograft glands, respectively. Two-way ANOVA, multiple comparisons. f Violin plot of the relative micro-metastatic burden in lungs and bones from 4 control and 5 ZEB1-overexpressing T99 xenografts-bearing mice. The dashed line indicates the median and dotted lines indicate the lower and upper quartiles. Unpaired Student’s t-test. *, **, ***, ****, and n.s represent P < 0.05, 0.01, 0.001, 0.0001, and not significant, respectively.
Fig. 6
Fig. 6. E-cadherin in DTC awakening.
a Day 1 radiance of MCF-7 control and CDH1 cells. Data represent mean ± SD, n = 16, 17 glands in 4, 5 mice. Unpaired Student’s t-test. b Radiance fold-change. Data represent mean ± SEM, n = 16, 17 glands in 4, 5 mice c Relative CDH1 mRNA levels in MCF-7 control and CDH1 cells, n = 5. Data represent mean ± SD. Unpaired Student’s t-test. d Ex vivo lung radiance. Data represent mean ± SD from 5 control and 4 CDH1 mice. Multiple t-tests. e Fluorescence micrographs of MCF-7 control (top) or CDH1 (bottom) lungs. Scale bar, 500 µm. f Experimental scheme. g, h Relative radiance and weight (g) of 20 xenografted glands from -DOX and +DOX mice. Data represent mean ± SD. Unpaired Student’s t-test. i Fold-change lung radiance in - or +DOX, Data represent mean ± SEM, n = 16 in each group. Two-tailed Mann-Whitney test. **p ≤ 0.01. j Relative micro-metastatic burden. Data represent mean ± SEM, n = 69 from 16 mice/group. Nonparametric Mann-Whitney Test. k Representative fluorescence micrographs of lungs from - and +DOX mice. Scale bars, 500 µm. l Quantification of lung lesion area from - or +DOX mice, n = 9 each. n≥476 lesions 9 mice/condition. Data represent mean ± SD. Unpaired Student’s t-test. m Representative micrographs of lung sections from - or +DOX mice. Scale bar, 100 µm. n Quantification of lesion length and area in H&E stained lung sections from - and +DOX, n ≥ 30 lesions, 3 mice/condition. Data represent mean ± SD. Unpaired Student’s t-test. o. Relative E-cad intensity (Int.) and representative IF of E-cad in lung lesions, n ≥ 38 from 3 mice/condition. Scale bar, 50 µm. Data represent mean ± SEM. Unpaired Student’s t-test. p Relative CDH1 and MKI67 mRNA levels in lungs from 6 -DOX and 7 +DOX mice. Data represent mean ± SD. Nonparametric Mann Whitney test. q Pearson plot showing correlation between MKI67 and CDH1 mRNA levels in 6 -DOX and 7 +DOX mice. r Relative mRNA levels of EMT-TFs in lungs from 5 -DOX and 6 +DOX mice. Data represent mean ± SD. Nonparametric Mann Whitney test. All relative mRNA levels were normalized to GAPDH.
Fig. 7
Fig. 7. Heterogeneity of ER+ primary tumor cells and lung DTCs.
a, b UMAP plots representing FACS-sorted MCF-7:RFP+ cells isolated from primary tumors (a) and lungs (b). Colors code for different cell clusters. c Violin plot showing “HALLMARK_EMT” gene set enrichment score in cell clusters of the primary tumors. Boxplots inside each violin describe the interquartile range, bold dots indicate median. Boxplot whiskers show minimum and maximum values. Statistical significance was assessed by fitting a generalized linear mixed model and computing the estimated marginal means across all the identified cell clusters. Tukey’s method was used to assess adjusted p-values. d Integrated UMAP plot showing MCF-7:RFP cells isolated from primary tumors (grey) and lung tissues (color-coded according to clusters from b). e–g UMAP plots representing levels of selected transcripts in primary MCF-7:RFP (e) and lung DTCs (f, g). Numbers describe centroid of clusters identified in Fig. 7a and b. Violet gradient represents low, yellow gradient high gene expression. h Ridge plot showing normalize enrichment scores (NES) in the active versus dormant clusters identified in lung DTCs for the “IL6_JAK_STAT3_SIGNALING” and “TNFA_SIGNALING_VIA_NFKB” hallmark gene sets. Statistical significance was assessed by Welch’s t-test. i UCSC genome browser screenshot showing IL6-induced pSTAT3 binding at CDH1 promoter and enhancer regions. The browser window shows regions, highlighted in yellow, which are bound by phosphorylated STAT3 upon IL6 stimulation in MCF-7 and T47D cells. *, **, ***, ****, and n.s represent P < 0.05, 0.01, 0.001, 0.0001, and not significant, respectively.
Fig. 8
Fig. 8. Working Model for ER+ BC progression.
ER+ tumor cells progress from in situ to invasive stage in an epithelial state characterized by high expression of E-cad and low expression of EMT-TFs. At distant sites, DTCs show EMP features and enter dormancy. Awakening from dormancy involves restoration of E-cad expression that may be triggered by cytokines resulting in STAT3 activation and suppression of the EMT-TFs. Drugs promoting EMP or inhibiting the reacquisition of an epithelial state may prevent disease recurrence. EMT-TFs Epithelial-Mesenchymal Transition-activating transcription factors, EMP Epithelial-Mesenchymal Plasticity, DTCs Disseminated Tumor Cells.

Similar articles

Cited by

References

    1. Sung, H. et al. Global cancer statistics 2020: GLOBOCAN estimates of incidence and mortality worldwide for 36 cancers in 185 countries. CA. Cancer J. Clin. 10.3322/caac.21660 (2021). - PubMed
    1. Pan H, et al. 20-Year Risks of Breast-Cancer Recurrence after Stopping Endocrine Therapy at 5 Years. N. Engl. J. Med. 2017;377:1836–1846. doi: 10.1056/NEJMoa1701830. - DOI - PMC - PubMed
    1. Klein CA. Framework models of tumor dormancy from patient-derived observations. Curr. Opin. Genet. Dev. 2011;21:42–49. doi: 10.1016/j.gde.2010.10.011. - DOI - PubMed
    1. Buell JF, et al. Donor transmitted malignancies. Ann. Transplant. 2004;9:53–56. - PubMed
    1. Matser YAH, et al. Transmission of breast cancer by a single multiorgan donor to 4 transplant recipients. Am. J. Transplant. 2018;18:1810–1814. doi: 10.1111/ajt.14766. - DOI - PubMed

Publication types

MeSH terms

Substances