. 2022 Aug 25;13(1):4878.
doi: 10.1038/s41467-022-32473-z.

Single-cell analysis of hepatoblastoma identifies tumor signatures that predict chemotherapy susceptibility using patient-specific tumor spheroids

Affiliations

Single-cell analysis of hepatoblastoma identifies tumor signatures that predict chemotherapy susceptibility using patient-specific tumor spheroids

Hanbing Song et al. Nat Commun. .

Abstract

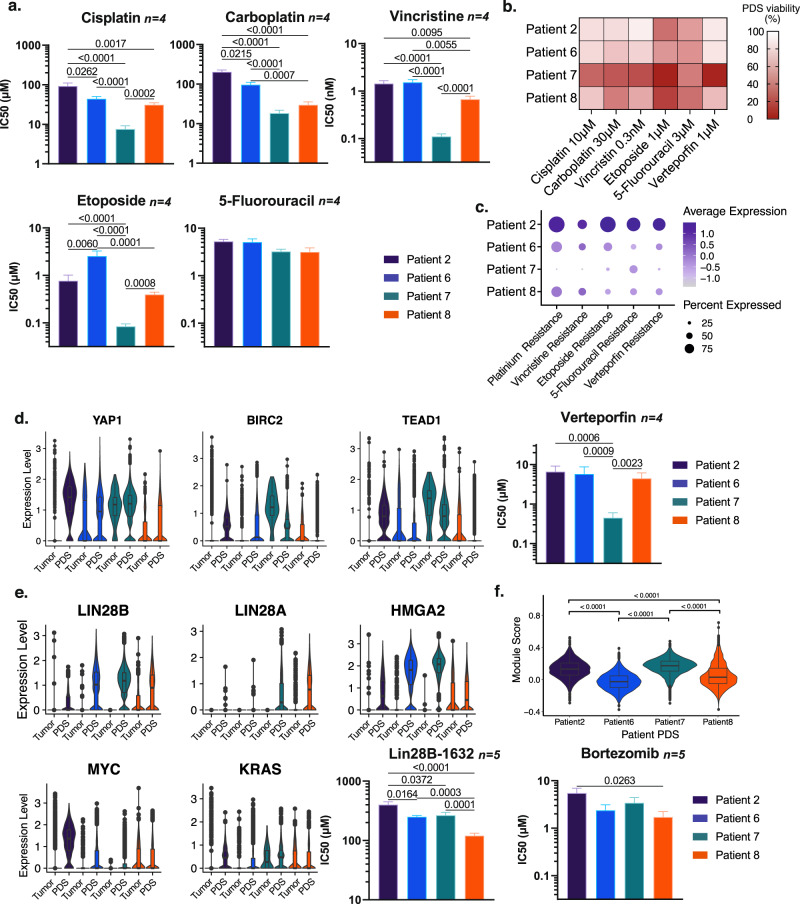
Pediatric hepatoblastoma is the most common primary liver cancer in infants and children. Studies of hepatoblastoma that focus exclusively on tumor cells demonstrate sparse somatic mutations and a common cell of origin, the hepatoblast, across patients. In contrast to the homogeneity these studies would suggest, hepatoblastoma tumors have a high degree of heterogeneity that can portend poor prognosis. In this study, we use single-cell transcriptomic techniques to analyze resected human pediatric hepatoblastoma specimens, and identify five hepatoblastoma tumor signatures that may account for the tumor heterogeneity observed in this disease. Notably, patient-derived hepatoblastoma spheroid cultures predict differential responses to treatment based on the transcriptomic signature of each tumor, suggesting a path forward for precision oncology for these tumors. In this work, we define hepatoblastoma tumor heterogeneity with single-cell resolution and demonstrate that patient-derived spheroids can be used to evaluate responses to chemotherapy.


Conflict of interest statement

The authors declare no competing interests.

Figures

Fig. 1
Fig. 1. Single-cell profiling of HB patients reveals distinctive tumor cell populations and tumor-associated populations.
a Flowchart of tissue processing of HB tumor and adjacent paired normal tissue samples for single-cell RNA sequencing and patient-derived spheroid culture. b Uniform manifold approximation and projection (UMAP) of 29,968 cells from nine HB patients, annotated by cell types. c Dot plot of all identified populations, each characterized by three known cell type markers. Average expression was indicated by the color gradient, and the percentage of marker expressed was represented by the dot size. d Stacked bar charts showing the contribution of the two sample types (normal and tumor) to each cell population, ranked by the contribution from normal samples. e Estimated copy-number alteration profile of all tumor and tumor-associated cell clusters using all the non-tumor and non-tumor-associated cells as reference. Chromosomes are labeled on the horizontal axis. Estimated copy numbers are shown in blue (deletion) and red (amplification) color bars. f Stacked bar charts show the contribution of the nine patients to each cell population.
Fig. 2
Fig. 2. Tumor cell analysis reveals five transcriptomically distinct tumor signatures detected within the nine HB patients.
a Correlation heatmap of the tumor cells by tumor cell clusters, tumor signatures (column annotations), and patients (row annotation). Correlation was shown by the color gradient. Hierarchal clusters were illustrated by dendrograms. b Heatmap of top 10 most differentially expressed genes of each HB signature. Scaled expressed levels are shown by the color bar. c Violin and box plot of the computed c. Hepatoblast I, d Hepatoblast II, e Erythroid-like, f DCN-high, and g Neuroendocrine tumor signature scores for all nine patients (N = 6244 cells). h FISH staining for REG3A (green), GPC3 (white), and IGF2 (red) of patient 6 tumor tissue (Hepatoblast I), and i patient 4 tumor tissue (Hepatoblast II). j FISH staining for REG3A (green), HBA2 (white), and GATA1(red), of patient 2 tumor tissue showing Erythroid-like cells (red arrow) and tumor-associated erythroid cells (white arrow). k Immunofluorescence staining for COL1 (green) and POSTN (red) of patient 3 tumor tissue (DCN-high). l Immunofluorescence staining for CHGA (green) and FISH staining for DLK1 (red) of patient 8 tumor tissue (Neuroendocrine). m Violin plots of individual marker genes presented on panels (hl). Scale bar = 30 µm. The box plots present the 25th percentile, the median, the 75th percentile, and outlying or extreme values. The whiskers of the box plots extend to a maximum of 1.5 times the size of the interquartile range. N = 6244 cells for all box plots. Source data are provided as a Source Data file.
Fig. 3
Fig. 3. Low MARCO expression distinguishes HB TAMs from macrophages in normal tissue.
UMAP of all immune cells and tumor-associated stromal cells from all 9 patients annotated by a cell type or b sample type. c The quantities of each cell type in both tumor and adjacent normal tissue. d UMAP of all macrophages from all 9 patients annotated by sample type. e Volcano plot showing top differentially expressed genes between macrophages found in tumors compared to those found in adjacent normal liver tissue. f Expression of the scavenger receptor, MARCO, distinguishes TAMs from normal liver macrophages. g Violin plots showing expression of the genes identified in the above volcano plot in MAR-COLow TAMs and normal liver MARCOHi macrophages. h Gene ontology terms that are associated with the genes differentially expressed in MARCOLow macrophages. Statistical significance levels (over-expression statistical test) are indicated in the color bar. i FISH staining for CD163 (green) and MARCO (red) of non-tumor and tumor tissue for patient 1 (Hepatoblast I), patient 4 (Hepatoblast II), patient 5 (Erythroid), patient 3 (DCN), and patient 8 (Neuroendocrine) showing near-total absence of MARCO in tumor tissue. j Computed pseudotime trajectory and anno-tated UMAP of monocytes, tumor-associated macrophages, and MACROHi macrophages.
Fig. 4
Fig. 4. HB maintains erythropoiesis at three distinct developmental stages.
a Integrated UMAP of fetal liver erythroid cells and tumor-associated erythroid cells. b Heatmap of the three developmental stages of fetal-liver erythroid marker expression for tumor-associated erythroid cells and reference fetal liver erythroid population. Scaled expressed levels are shown by the color bar. c Supervised heatmap showing expression of canonical erythroid markers and representative markers of three erythroid developmental stages. d Selected ligand-receptor interactions from TAMs to tumor-associated erythroid cells for patients 2, 5, 6, and other patients. Mean expressions of ligand and receptor pairs are shown in the color bar. Statistical significance levels (random permutation test) are indicated by the marker size. e Stainings for TAMs to tumor-associated erythroid cells ligand-receptor interactions by FISH with CD163 (red), HBA2 (blue), VCAM1 (white), and ITGA4 (green) on patient 6 tumor tissue, and violin plot of VCAM1 and ITGA4 for TAMs and tumor-associated erythroids from patient 6 tumor tissue. Arrows show TAMs expressing VCAM1 next to tumor-associated erythroids expressing ITGA4. f Selected ligand-receptor interactions between tumor cells and tumor-associated erythroid cells for patients 2, 5, 6, and other patients. Mean expression of ligand and receptor pairs are shown in the color bar. Statistical significance levels (random permutation test) are indicated by the marker size. g Stainings for tumor cells to tumor-associated erythroid cells ligand−receptor interactions by FISH with MEG3 (red), HBA2 (blue), IGF2 (white), and IGFR1 (green) on patient 6 tumor tissue, and violin plot of IGF2 and IGFR1 for tumor Hepatoblast I and tumor-associated erythroids from patient 6 tumor tissue. Arrows show tumor cells expressing IGF2 next to tumor-associated erythroids expressing IGFR1. h Stainings for tumor cells to tumor-associated erythroid cells ligand−receptor interactions by FISH with REG3A (red), HBA2 (blue), SPP1 (white), and ITGA4 (green) of patient 2 tumor tissue, and violin plot of SPP1 and ITGA4 for tumor Erythroid-like and tumor-associated erythroids from patient 2 tumor tissue. Arrows show tumor cells expressing SPP1 next to tumor-associated erythroids expressing ITGA4. Scale bar = 35 µm.
Fig. 5
Fig. 5. Patient-derived-spheroids maintain patient-specific features from freshly isolated parent cells.
a Brightfield images of tumor spheroids from patients 2, 6, 7, and 8 at early passage. Scale bar = 100 μm. b Violin plots of KEGG Cairo_Hepatoblastoma_UP signature score of tumor cells (patient 2) or spheroid parent cells (patients 6, 7, and 8) or spheroids from patients 2, 6, 7, and 8 at an early passage (passage 2 for patients 2, 8, and passage 3 for patients 6 and 7) and at a late passage (passage 10 for patients 2, 6, and 8, and passage 11 for patient 7). Signature scores for all hepatocytes from all patients are represented as a reference. c Exon 3 somatic mutation of CTNNB1 (#NP_001091679.1) of normal and tumor tissues, spheroids, early and late passages. d Correlation matrix between PDS and freshly isolated tumor cells. Early passage for patient 9 corresponds to passage 2. e PDS module scores (early and late passages) for the signatures of the five tumor cell types. Source data for signature scores are provided as a Source Data file.
Fig. 6
Fig. 6. Pharmacologic testing of patient-derived HB spheroids reveals patient-specific treatment responses.
a IC50 calculated from cell viability measurements by ATP quantification after a 4-day treatment with five chemotherapy drugs (cisplatin, carboplatin, etoposide, vincristine and 5-fluorouracil [5-FU]). b PDS drug-sensitivity heatmap showing cell viability profile for the five chemotherapy drugs tested and verteporfin at a representative concentration. c Module score for genes involved in platinum-based compounds, etoposide, vincristine, 5-FU, and verteporfin metabolism and efflux. d Violin plots showing the expression of YAP1, BIRC2 and TEAD1 in parent cells and PDS, and IC50 calculated from cell viability measurements of ATP quantification after a 4-day treatment with the YAP1 inhibitor verteporfin. e Violin plots showing the expression of LIN28B, LIN28A, HMGA2, MYC, and KRAS in parent cells and PDS, and IC50 calculated from cell viability measurement by ATP quantification after a 4-day treatment with the LIN28 pathway inhibitor LIN28B-1632. f Violin plot showing the module score of proteasome coding genes (proteasome KEGG gene list) in PDS, and IC50 calculated from cell viability measurement by ATP quantification after a 4-day treatment with the proteasome inhibitor bortezomib. The box plot present the 25th percentile, the median and the 75th percentile, and outlying or extreme values. The whiskers of the box plots extend to a maximum of 1.5 times the size of the interquartile range. IC50 were calculated using the function log(inhibitor) vs. normalized response from GraphPad Prism 9.2.0. Data show log(IC50)+/− SEM generated from drug cytotoxicity assay data (Supplementary Fig. 22) N = 4 for cisplatin, Carboplatin, vincristine, etoposide, 5FU and verteporfin, N = 5 for LIN28B-1632, Bortezomib, Two-way ANOVA was performed, followed by Tukey’s multiple comparisons test. p-values are indicated on graphs (p < 0.0001 is indicated when p-value is below this threshold). Source data for signature scores and IC50 are provided as a Source Data file.

References

    1. Kehm, R. D., Osypuk, T. L., Poynter, J. N., Vock, D. M. & Spector, L. G. Do pregnancy characteristics contribute to rising childhood cancer incidence rates in the United States? Pediatr. Blood Cancer65, e26888 (2018). - PMC - PubMed
    1. Perilongo G, Malogolowkin M, Feusner J. Hepatoblastoma clinical research: Lessons learned and future challenges. Pediatr. Blood Cancer. 2012;59:818–821. doi: 10.1002/pbc.24217. - DOI - PubMed
    1. Trobaugh-Lotrario AD, Katzenstein HM. Chemotherapeutic approaches for newly diagnosed hepatoblastoma: Past, present, and future strategies. Pediatr. Blood Cancer. 2012;59:809–812. doi: 10.1002/pbc.24219. - DOI - PubMed
    1. Meyers RL, et al. Risk-stratified staging in paediatric hepatoblastoma: A unified analysis from the Children’s Hepatic tumors International Collaboration. Lancet Oncol. 2017;18:122–131. doi: 10.1016/S1470-2045(16)30598-8. - DOI - PMC - PubMed
    1. Trobaugh-Lotrario AD, Meyers RL, Tiao GM, Feusner JH. Pediatric liver transplantation for hepatoblastoma. Transl. Gastroenterol. Hepatol. 2016;1:44. doi: 10.21037/tgh.2016.04.01. - DOI - PMC - PubMed

Publication types