. 2022 Aug 25;13(1):5003.
doi: 10.1038/s41467-022-32766-3.

Oligodendrocyte differentiation alters tRNA modifications and codon optimality-mediated mRNA decay

Affiliations

Oligodendrocyte differentiation alters tRNA modifications and codon optimality-mediated mRNA decay

Sophie Martin et al. Nat Commun. .

Abstract

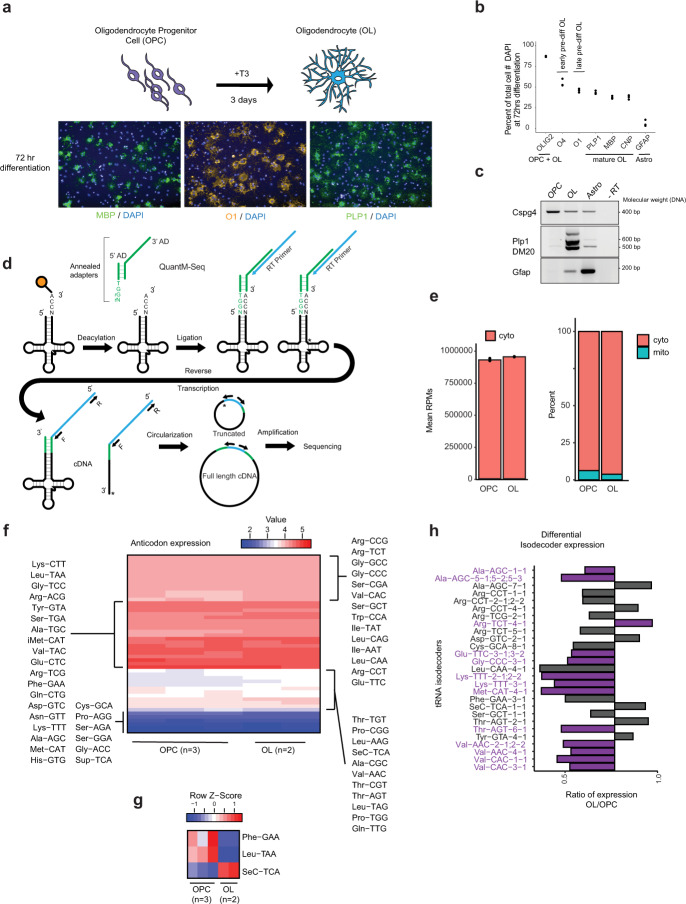
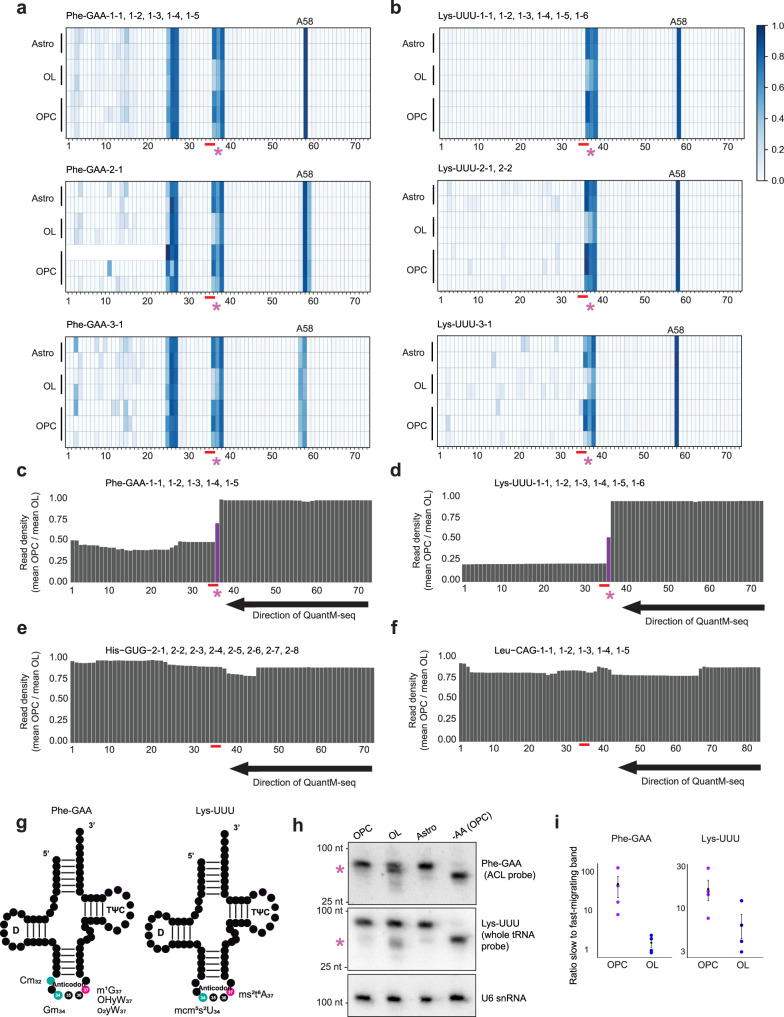
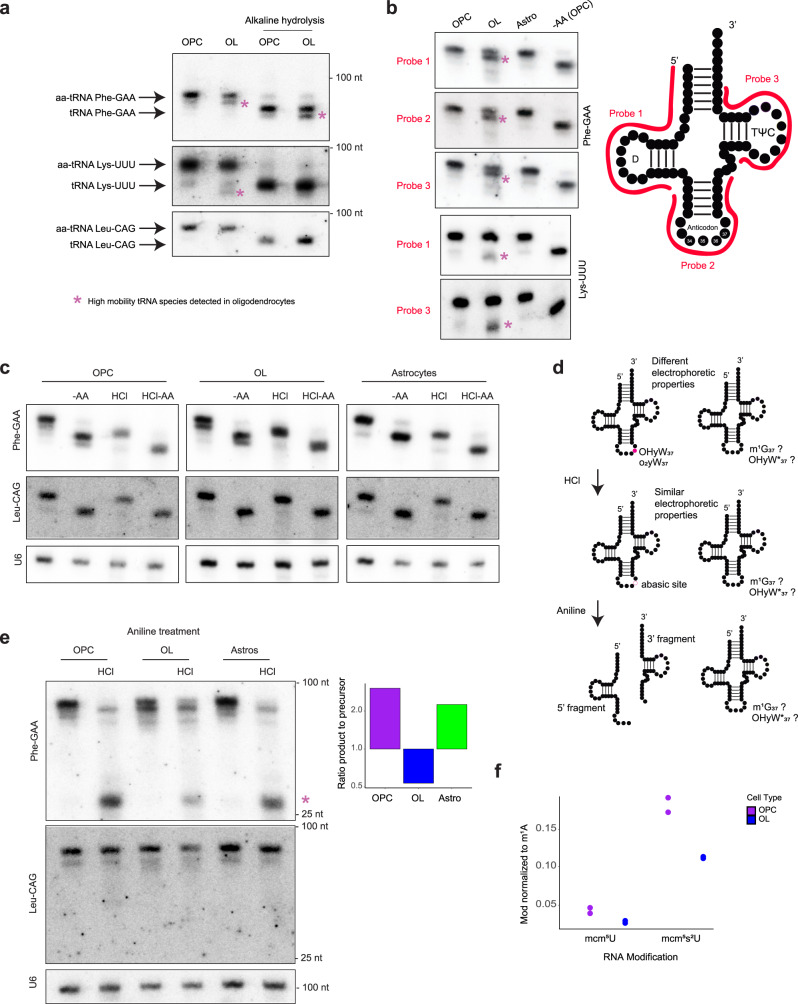
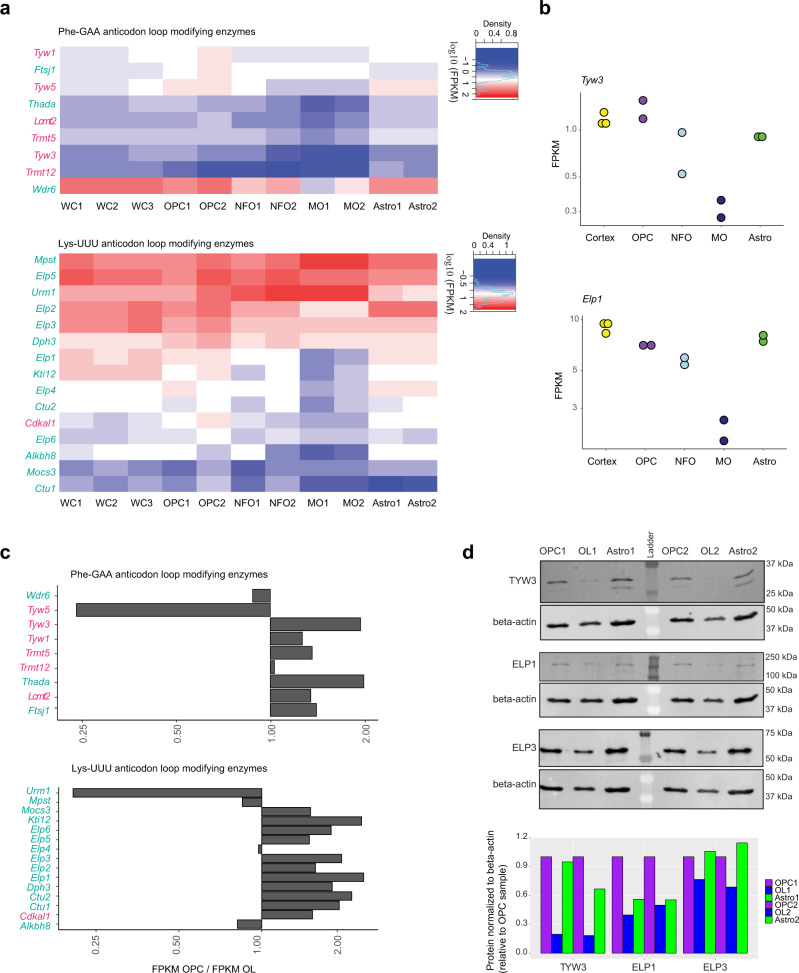
Oligodendrocytes are specialized cells that confer neuronal myelination in the central nervous system. Leukodystrophies associated with oligodendrocyte deficits and hypomyelination are known to result when a number of tRNA metabolism genes are mutated. Thus, for unknown reasons, oligodendrocytes may be hypersensitive to perturbations in tRNA biology. In this study, we survey the tRNA transcriptome in the murine oligodendrocyte cell lineage and find that specific tRNAs are hypomodified in oligodendrocytes within or near the anticodon compared to oligodendrocyte progenitor cells (OPCs). This hypomodified state may be the result of differential expression of key modification enzymes during oligodendrocyte differentiation. Moreover, we observe a concomitant relationship between tRNA hypomodification and tRNA decoding potential; observing oligodendrocyte specific alterations in codon optimality-mediated mRNA decay and ribosome transit. Our results reveal that oligodendrocytes naturally maintain a delicate, hypersensitized tRNA/mRNA axis. We suggest this axis is a potential mediator of pathology in leukodystrophies and white matter disease when further insult to tRNA metabolism is introduced.


Conflict of interest statement

The authors declare no competing interests.

Figures

Fig. 1
Fig. 1. Differential tRNA expression in oligodendrocytes and their progenitors.
a Model of differentiation of OPCs to oligodendrocytes (OL). At 3 days after addition of thyroid hormone T3, markers of mature oligodendrocytes are detected by immunocytochemistry. b Immunofluorescence quantitation after 3 days of differentiation. Percentage of cells that express the oligodendrocytes markers MBP, PLP1, CNP (mature oligodendrocytes), O1 (late pre-differentiating oligodendrocytes), O4 (early pre-differentiating oligodendrocytes), the oligodendrocyte lineage marker OLIG2 (OPCs and oligodendrocytes), or the astrocytes marker GFAP. A total number of cells n of 2341 for OLIG2, 2587 for O4 and GFAP, 5865 for O1 and MBP, and 2491 for PLP1 and CNP, were examined over 3 replicate wells (8 fields per replicate). c Detection of Cspg4, Plp1 and Gfap mRNAs, respective markers of OPCs, oligodendrocytes (OL) and astrocytes (Astro), by RT-PCR. -RT: control without Reverse Transcriptase. d Outline of the QuantM-seq, that relies on the ligation of a double-stranded adapter complementary to the 5′ and 3′ termini of mature tRNAs, and circularization of the cDNA before library preparation. e Mean cytosolic tRNA reads per million (RPMs) (bar chart, left) and percentage of reads that correspond to cytoplasmic or mitochondrial tRNAs (stacked bar chart, right) in OPCs and oligodendrocytes (OLs). The values of n = 3 independent experiments for OPCs, and n = 2 independent experiments for oligodendrocytes, are superposed to the means. f Heatmap of tRNA reads collapsed by anticodon groups. n = number of biological replicates. g Row Z-score heatmap of expression for tRNAs that significantly change between OPCs and oligodendrocytes (adjusted p value < 0.01 from DESeq2 analysis, Wald test with Benjamini–Hochberg correction). n = number of biological replicates. h Expression of tRNA isodecoders that are significantly different between OPCs and oligodendrocytes (OL), represented as a log2 ratio OL/OPC (adjusted p value < 0.01 from DESeq2 analysis, Wald test with Benjamini–Hochberg correction).
Fig. 2
Fig. 2. tRNA sequencing distinctions between OPCs and oligodendrocytes.
a–b Heatmaps for the different isodecoders of Phe-GAA (a) and Lys-UUU (b), representing sequencing variant fractions at each tRNA position (x-axis) across OPCs (3 biological replicates), oligodendrocytes (OL, 2 biological replicates) and astrocytes (Astro, 2 biological replicates) (y-axis). The numbers below the plots indicate nucleotide position, the red line shows the anticodon position (nucleotides 34–36). The color bar indicates the color scale of the variant frequency. DEXSeq differential analysis with Benjamini–Hochberg correction between oligodendrocytes and OPCs/astrocytes at position 37 of Phe-GAA and Lys-UUU: adjusted p value < 0.02. c–d Bar charts of the ratio of reads density in OPCs vs. oligodendrocytes (OL), at each nucleotide position of Phe-GAA (isodecoder 1, in c) and Lys-UUU (isodecoder 1, in d) tRNAs. e–f Same as (c–d), for His-GUG (isodecoder 2, in e) and Leu-CAG (isodecoder 1, in f), showing the same density OPC vs. oligodendrocytes (OL) at each nucleotide. g Two-dimensional representation of Phe-GAA tRNA and Lys-UUU tRNA, with the modified nucleosides at position 32, 34 and 37 in the anticodon loop highlighted in color. h Northern blot analysis of Phe-GAA and Lys-UUU tRNAs. Probes complementary to the anticodon loop (ACL) or full-length tRNA (whole tRNA) sequence were used. U6 snRNA is used as a loading control. -AA (Amino Acid): tRNAs were deacylated by alkaline hydrolysis. Asterisk: tRNA species with higher electrophoretic mobility in OL. nt: nucleotides, molecular weight estimated from bromophenol blue and xylene cyanol dyes signal. i Quantitation of the signal intensity of the two tRNA species detected by Northern blot after acid urea PAGE, for Phe-GAA and Lys-UUU tRNAs. Plotted are the values of four biological replicates in OPCs (purple) and oligodendrocytes (OL, blue), with the mean ± SEM (error bars) in black.
Fig. 3
Fig. 3. Phe-GAA and Lys-UUU modifications in the ACL differ between OPCs and oligodendrocytes.
a Acid-urea PAGE and Northern blot analysis for Phe-GAA, Lys-UUU and Leu-CAG in OPCs and oligodendrocytes (OL), charged with amino acid (AA) or uncharged (alkaline hydrolysis). nt: nucleotides, molecular weight estimated from bromophenol blue and xylene cyanol signals. b Acid-urea PAGE and Northern blot analysis of Phe-GAA and Lys-UUU, probed with different oligonucleotides covering the D-loop, ACL or TψC-loop (-AA = minus amino acid, deacylation induced by alkaline hydrolysis). On the right is a two-dimensional representation of the tRNA. c Acid-urea PAGE and Northern blot analysis of OPC, oligodendrocytes (OL) and astrocytes (Astro) RNA submitted to alkaline hydrolysis (-AA, deacylation), acidic hydrolysis (HCl, depurination of wybutine) or acidic followed by alkaline hydrolysis (HCl -AA). Phe-GAA was detected with a full-length tRNA complementary probe. U6 snRNA is used as a loading control. d Two-dimensional representation of Phe-GAA tRNA modified with wybutosine (yW) derivatives (left), or hypomodified (right). Schematic of the consequences of acidic hydrolysis leading to the formation of an abasic site of the yW modified tRNA, and aniline treatment leading to chain scission at the abasic site. Phe-GAA tRNA that would not present the fully modified yW or derivatives (right) would not be sensitive to treatment. Modifications at G37: OHyW37, hydroxywybutosine; o2yW37, peroxywybutosine, m¹G37, 1-methylguanosine; OHyW*37, hypomodified hydroxywybutosine. e Acid-urea PAGE and Northern blot analysis of OPC, oligodendrocytes (OL) and astrocytes (Astro) RNA submitted to acidic hydrolysis (HCl, depurination of wybutine) and aniline treatment (chain scission). Phe-GAA was detected with probe 3 from (b), and the control Leu-CAG with an oligonucleotide probe complementary to the ACL. U6 snRNA is used as a loading control. On the right is a quantitation of the signal intensities for Phe-GAA after HCl and aniline treatment, expressed as a ratio of the product band (tRNA halves) intensity to the precursor tRNA (full-length) intensity. Asterisk: tRNA halves. nt: nucleotides, molecular weight estimated from bromophenol blue and xylene cyanol dyes signal. f Bar chart of the levels of mcm5U and mcm5s2U nucleosides normalized to m1A (LC-MS/MS quantification). n = 2 biological replicates.
Fig. 4
Fig. 4. Genes required for modification of the anticodon loop of Phe-GAA and Lys-UUU tRNAs are poorly expressed in oligodendrocytes.
a Heatmap of the expression levels (FPKM) of the factors involved in the modification pathways of Phe-GAA ACL (top) and Lys-UUU ACL (bottom), data from for the whole cortex (WC), OPCs, Newly Formed Oligodendrocytes (NFO), Myelinating Oligodendrocytes (MO) and astrocytes (Astro) purified from mouse brain. The numbers are the biological replicates numbers. b Expression levels (FPKM) from RNA-Seq data from (a) for examples of genes differentially expressed between OPCs and Myelinating oligodendrocytes (MO) (p < 0.05), in the whole cortex (n = 3 biological replicates), OPC (n = 2 biological replicates), NFO (n = 2 biological replicates), MO (n = 2 biological replicates) and Astro (n = 2 biological replicates). c Expression levels (FPKM) from RNA-Seq data from OPCs and OPCs differentiated to oligodendrocytes (OL), for the factors involved in the modification pathways of Phe-GAA ACL and Lys-UUU ACL, expressed as a ratio of FPKM OPC/OL. These values are the average from 5 biological replicates for OPCs and four biological replicates for oligodendrocytes. DESeq2 analysis: adjusted p value < 0.05 for Thada, Urm1, Elp1, Elp3, Elp6 and Kti12 (adjusted p value: Benjamini–Hochberg correction). d Western blot analyses of TYW3, ELP1 and ELP3 in OPCs, oligodendrocytes (OLs) and astrocytes (Astro) (OLs and Astro differentiated from OPCs). The numbers represent two biological replicates. Βeta-actin is used as a loading control. The signals from the Western blots were quantified and expressed relative to the levels in OPCs.
Fig. 5
Fig. 5. The cognate codons for Phe-GAA and Lys-UUU tRNAs have altered impact on mRNA decoding and mRNA stability in oligodendrocytes.
a Ribosome translocation on each codon depends on the availability of functional tRNAs, which affects translation efficiency and Codon Optimality-Mediated mRNA Degradation. b Outline of Decay-Seq performed in OPCs and oligodendrocytes. 5-EU was added to cells then replaced by U and RNA was collected at various time-points. 5-EU (green circles)-labelled RNAs were coupled to biotin (orange circles) and specifically pulled down with streptavidin beads (gray). After adapter ligation (red line) and reverse transcription (red arrow) on beads, cDNA was eluted, circularized and amplified before sequencing. c Heatmap of the FPKM of each transcript at every time-point after removal of 5-EU, normalized to 0 h, in OPCs and oligodendrocytes replicates. n = number of biologically independent experiments. d CSC values for the synonymous codons of phenylalanine and lysine in OPCs and oligodendrocytes. Represented are the values of three biological replicates in OPCs and two biological replicates in oligodendrocytes (dots), with the mean plotted as a bar (mean ± SEM for OPCs). e Ribosome pause scores for the Phe and Lys codons in OPCs (purple dots) and oligodendrocytes (blue dots). The codons with optimal CSC value in oligodendrocytes are labelled in tile color on the x-axis, non-optimal codons in pink. Represented are the pause score values of two biological replicates.
Fig. 6
Fig. 6. mRNAs with a low UUU and AAA codon bias are stabilized in oligodendrocytes and are enriched in plasma membrane components.
a–b Boxplots of transcript half-lives binned by increasing occurrence of UUU over Phe codons (a) and occurrence of AAA over Lys codons (b), in OPCs (purple) and oligodendrocytes (OL, blue). Boxplots display the median with hinges at the 25th and 75th percentiles and whiskers extending 1.5 times the interquartile range. Number of transcripts in bin is indicated above each boxplot. Kruskal–Wallis test p value = 0.71 (OPC) and 2.2 × 10−16 (OL) in (a), 0.68 (OPC) and <2.2 × 10−16 (OL) in b. c Example of transcripts with a low occurrence of UUU and AAA (Cdipt) or a high UUU and AAA codon bias (Rlim). d Decay of the transcripts from (c) in OPCs and oligodendrocytes. Plotted are the relative FPKM over time (mean of 3 and 2 biological replicates for OPCs and oligodendrocytes, respectively), with the linear regression in gray shade. e–f GO term analysis of the transcripts with a low UUU bias over Phe codons (Bins of lowest values from Fig. 6a) (e) and a low AAA bias over Lys codons (Bins of lowest values from Fig. 6b) (f). Represented are the GO classes that are over-represented compared to the whole list of transcripts expressed in oligodendrocytes (Panther, Fisher exact test with Benjamini–Hochberg false discovery rate correction (FDR), adjusted p value < 10−3). g Occurrence of the Phe (UUC and UUU) and Lys (AAG and AAA) codons in the oligodendrocytes markers Plp1 (proteolipid protein 1), Mbp (myelin basic protein) and Cnp (2’,3’-cyclic nucleotide 3’ phosphodiesterase) (canonical isoform sequence). h–i GO term analysis of the transcripts with a high UUU bias over Phe codons (Bins of highest values from Fig. 6a) (h) and a high AAA bias over Lys codons (Bins of highest values from Fig. 6b) (i). Represented are the GO classes that are over-represented compared to the whole list of transcripts expressed in oligodendrocytes (Panther, Fisher exact test with Benjamini–Hochberg FDR correction, adjusted p value < 10−5).

Similar articles

Cited by

References

    1. Hanson G, Coller J. Codon optimality, bias and usage in translation and mRNA decay. Nat. Rev. Mol. Cell Biol. 2018;19:20–30. doi: 10.1038/nrm.2017.91. - DOI - PMC - PubMed
    1. Pechmann S, Frydman J. Evolutionary conservation of codon optimality reveals hidden signatures of cotranslational folding. Nat. Struct. Mol. Biol. 2013;20:237–243. doi: 10.1038/nsmb.2466. - DOI - PMC - PubMed
    1. dos Reis M, Savva R, Wernisch L. Solving the riddle of codon usage preferences: a test for translational selection. Nucleic Acids Res. 2004;32:5036–5044. doi: 10.1093/nar/gkh834. - DOI - PMC - PubMed
    1. Bazzini AA, et al. Codon identity regulates mRNA stability and translation efficiency during the maternal-to-zygotic transition. EMBO J. 2016;35:2087–2103. doi: 10.15252/embj.201694699. - DOI - PMC - PubMed
    1. Forrest ME, et al. Codon and amino acid content are associated with mRNA stability in mammalian cells. PLoS ONE. 2020;15:e0228730. doi: 10.1371/journal.pone.0228730. - DOI - PMC - PubMed

Publication types