. 2022 Aug 25;12(1):14528.
doi: 10.1038/s41598-022-17399-2.

Extended longevity of DNA preservation in Levantine Paleolithic sediments, Sefunim Cave, Israel

Affiliations

Extended longevity of DNA preservation in Levantine Paleolithic sediments, Sefunim Cave, Israel

Viviane Slon et al. Sci Rep. .

Abstract

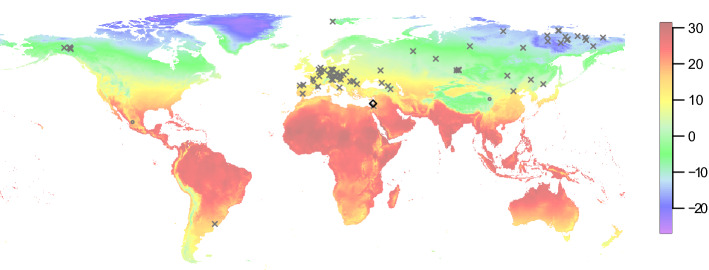
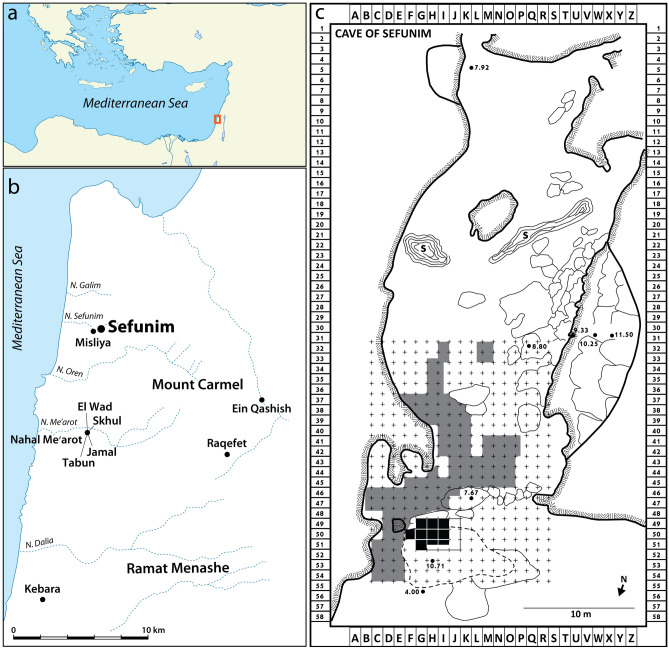
Paleogenomic research can elucidate the evolutionary history of human and faunal populations. Although the Levant is a key land-bridge between Africa and Eurasia, thus far, relatively little ancient DNA data has been generated from this region, since DNA degrades faster in warm climates. As sediments can be a source of ancient DNA, we analyzed 33 sediment samples from different sedimentological contexts in the Paleolithic layers of Sefunim Cave (Israel). Four contained traces of ancient Cervidae and Hyaenidae mitochondrial DNA. Dating by optical luminescence and radiocarbon indicates that the DNA comes from layers between 30,000 and 70,000 years old, surpassing theoretical expectations regarding the longevity of DNA deposited in such a warm environment. Both identified taxa are present in the zooarchaeological record of the site but have since gone extinct from the region, and a geoarchaeological study suggests little movement of the sediments after their deposition, lending further support to our findings. We provide details on the local conditions in the cave, which we hypothesize were particularly conducive to the long-term preservation of DNA-information that will be pertinent for future endeavors aimed at recovering ancient DNA from the Levant and other similarly challenging contexts.


Conflict of interest statement

The authors declare no competing interests.

Figures

Figure 1
Figure 1
The location of Sefunim Cave compared to other sites where ancient DNA is preserved. The map is colored according to the mean annual temperature (°C), based on climatic data for the years 1970–2000. Sefunim Cave is indicated by the diamond. Other localities from which mammalian DNA from samples dated to at least 30 ka has been retrieved are noted (cross—skeletal remains; circle—sediments). See Supplementary Table S1 for a list of the localities plotted. The map was generated using the ‘maps’ package in R version 3.5.2 (https://www.r-project.org/).
Figure 2
Figure 2
Location maps. (a) Map of the Eastern Mediterranean showing the general location of the site; (b) map of Mount Carmel with Sefunim and other important sites of the region; (c) Plan of Sefunim Cave (after) showing current excavation area (black squares) and Ronen's excavation (grey squares). Maps were generated using Adobe Photoshop and Adobe Illustrator (www.adobe.com).
Figure 3
Figure 3
Stratigraphy of Sefunim Cave reflected through the two main sections on the north (a) and east (b) walls of the excavation. (Sections A–A' and C–C' are depicted in Fig. 4.). Profile drawings were generated using CorelDRAW X7 v.17.5.0.907 (www.coreldraw.com).
Figure 4
Figure 4
Locations of sediment samples collected for DNA analyses, shown on a plan of the Sefunim Cave excavation. Samples are color-coded according to the layer from which they originate, with a cross indicating samples that tested positive for the preservation of ancient mammalian mtDNA. The gray line depicts the outline of the boulder removed from the excavation area in 2017 prior to sampling. The dashed gray line shows the inferred extent of the rock before Ronen removed part of it. The red arrows represent the two main sections shown in Fig. 3. The photographs on the right document the gradual removal of the limestone boulder before its complete removal. The distribution map was generated with ArcGIS Desktop 10.6.1.9270 (https://desktop.arcgis.com); photographs are by A. Kandel.
Figure 5
Figure 5
Authentication of the 982 mtDNA fragments assigned to Cervidae in sample SP5773 from Layer V. Following the alignment of the fragments to the Cervus elaphus reference mitochondrial genome and their filtering for a mapping quality of 25 or more, 965 fragments were retained for these analyses. (a) Frequency of nucleotide substitutions towards the starts and ends of fragments compared to the reference genome. (b) Base composition towards the start and end of the sequenced DNA fragments (within dashed gray outline) and of the reference genome upstream and downstream from fragments’ ends. (c) Length distribution (in bp) of the Cervidae mtDNA fragments. The average length is shown by the red dashed line.
Figure 6
Figure 6
Placing the DNA from Layer V within the Cervidae mtDNA diversity. (a) Reconstruction of a partial consensus mtDNA genome sequence, using the alignment to the Cervus elaphus reference mitochondrial genome (bottom). Blue dots indicate the positions at which bases could be called (middle). At each position, the coverage (green) and the support for the majority base (orange) is shown (top). The minimum thresholds for these parameters are shown in dashed lines. (b) Maximum Likelihood phylogenetic tree based on the partial mtDNA genome sequence reconstructed from sample SP5773 (shown in red) and 380 previously-sequenced Cervidae mtDNA genomes. Branch lengths are scaled based on the number of substitutions per site, and the support for each branch is based on 500 bootstrap replications. Only the part of the tree containing the Sefunim sample is shown, with the full tree presented in Supplementary Fig. S2. The phylogenetic tree was plotted in MEGA X (https://www.megasoftware.net/).
Figure 7
Figure 7
Results of radiocarbon dating in calibrated years before present. Charcoal samples calibrated using IntCal20 and one shell sample (top, OxA-35137) using MarineCal20. Results presented in stratigraphic order from top to bottom, first by layer and then by elevation (below datum). See Supplementary Table S2 for details.

References

    1. Tchernov, E. The faunal sequence of the southwest Asian Middle Paleolithic in relation to hominid dispersal events. in Neandertals and Modern Humans in Western Asia 77–94 (Springer, 2002).
    1. Martínez-Navarro, B. Hippos, pigs, bovids, saber-toothed tigers, monkeys, and hominids: Dispersals through the Levantine corridor during late Pliocene and early Pleistocene times. in Human Paleoecology in the Levantine Corridor 37–52 (Oxbow Books, 2004).
    1. Reyes-Centeno H, et al. Genomic and cranial phenotype data support multiple modern human dispersals from Africa and a southern route into Asia. Proc. Natl. Acad. Sci. 2014;111:7248–7253. doi: 10.1073/pnas.1323666111. - DOI - PMC - PubMed
    1. Groucutt HS, et al. Rethinking the dispersal of Homo sapiens out of Africa. Evol. Anthropol. 2015;24:149–164. doi: 10.1002/evan.21455. - DOI - PMC - PubMed
    1. Westbury MV, et al. Hyena paleogenomes reveal a complex evolutionary history of cross-continental gene flow between spotted and cave hyena. Sci. Adv. 2020;6:0456. doi: 10.1126/sciadv.aay0456. - DOI - PMC - PubMed

Publication types