. 2022 Sep;41(39):4459-4473.
doi: 10.1038/s41388-022-02429-0. Epub 2022 Aug 25.

A high-throughput drug screen reveals means to differentiate triple-negative breast cancer

Affiliations

A high-throughput drug screen reveals means to differentiate triple-negative breast cancer

Milica Vulin et al. Oncogene. 2022 Sep.

Abstract

Plasticity delineates cancer subtypes with more or less favourable outcomes. In breast cancer, the subtype triple-negative lacks expression of major differentiation markers, e.g., estrogen receptor α (ERα), and its high cellular plasticity results in greater aggressiveness and poorer prognosis than other subtypes. Whether plasticity itself represents a potential vulnerability of cancer cells is not clear. However, we show here that cancer cell plasticity can be exploited to differentiate triple-negative breast cancer (TNBC). Using a high-throughput imaging-based reporter drug screen with 9 501 compounds, we have identified three polo-like kinase 1 (PLK1) inhibitors as major inducers of ERα protein expression and downstream activity in TNBC cells. PLK1 inhibition upregulates a cell differentiation program characterized by increased DNA damage, mitotic arrest, and ultimately cell death. Furthermore, cells surviving PLK1 inhibition have decreased tumorigenic potential, and targeting PLK1 in already established tumours reduces tumour growth both in cell line- and patient-derived xenograft models. In addition, the upregulation of genes upon PLK1 inhibition correlates with their expression in normal breast tissue and with better overall survival in breast cancer patients. Our results indicate that differentiation therapy based on PLK1 inhibition is a potential alternative strategy to treat TNBC.


Conflict of interest statement

MV, CJ, ALC, PAdM, TBP, MD, ASc, M-MC, KV, LS, RO, SDS, RM, declare no competing financial interests. AB, ASe. and MMSO are employees of F. Hoffmann–La Roche. JPC, VU, OG, IC, SL-R, GG, and DB are employees of Novartis. TR is an employee of Basilea. SM is part of a digital advisory board for Roche. WPW received research support from Takeda Pharmaceuticals International paid to the Swiss Group for Clinical Cancer Research (SAKK) and personal honoraria from Genomic Health. Support for meetings was paid to his institution from Sandoz, Genomic Health, Medtronic, Novartis Oncology, Pfizer and Eli Lilly. MB-A owns equities in and has received laboratory support and compensation from Novartis, and serves as a consultant for Basilea.

Figures

Fig. 1
Fig. 1. High-throughput drug screen reveals estrogen receptor α (ERα) induction in triple-negative breast cancer (TNBC) upon polo-like kinase 1 (PLK1) inhibition.
A Schematic of the high-throughput drug screen to identify inhibitors that induce ERα signalling in TNBC. Cells without active ERα signalling do not express GFP, whereas cells with active ERα signalling trigger the ERE-GFP reporter and express GFP. Compounds were added for 48 h to SUM149PT ERE-GFP cells. GFP signal and Hoechst signal were measured with fluorescence microscopy in living cells. B Dot plot depicting GFP signal and nuclei number derived from Hoechst staining from the primary drug screen. C Dot plot depicting GFP signal and nuclei number derived from Hoechst staining from the secondary validation screen. Each point represents the mean of three technical replicates. Hits were classified as proliferative, cytostatic or toxic. PLK1 inhibitors are depicted in red. D Representative fluorescence microscopy live-cell images from the validation screen shown in Fig. 1C. SUM149PT cells were treated with the indicated PLK1 inhibitors for 48 h. The ERE-GFP signal is depicted in green, the Hoechst nuclei stain in blue. Scale bars: 100 µm. E Immunoblot showing levels of ERα and ERK2 (loading control) in SUM149PT cells treated for 72 h with rigosertib or DMSO at the indicated concentrations. F Bar graph representing average mRNA expression of ESR1 in SUM149PT cells treated for 72 h with rigosertib or DMSO. n = 2–3 experimental replicates with 2 technical replicates each. Ordinary one-way ANOVA with multiple comparisons. Data are means ± SD. G Bar graph representing flow-cytometry analysis of ERE-GFP positive cells after rigosertib treatment or transfection with indicated siRNA for 72 h. n = 6 experimental replicates. Kruskal-Wallis test. Data are means ± SD. H Heatmap depicting early estrogen response proteins (from Molecular Signatures Database [MSigDB] hallmark gene sets) changing significantly upon rigosertib treatment (n = 2 experimental replicates) compared to DMSO (n = 3 experimental replicates). Data is row-normalized. I Dot plot showing PLK1 expression in ERα positive versus ERα negative breast cancer samples in the METABRIC [26, 27] cohort. Unpaired Student’s t-test. J Dot plot depicting PLK1 expression in different breast cancer subtypes in the METABRIC [26, 27] cohort. Ordinary one-way ANOVA with multiple comparisons. K Dot plot depicting PLK1 expression in different breast cancer cell lines from the Cancer Cell Line Encyclopedia (CCLE) [82]. Unpaired Student’s t-test.
Fig. 2
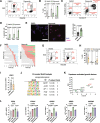
Fig. 2. PLK1 inhibition upregulates cell differentiation programmes.
A Schematic outlining the generation of the RigoSig gene set (upregulated genes upon rigosertib treatment, 1 510 genes, cut off: adjusted P-value < 0.01 and log fold change >1, n = 3 experimental replicates, Supplementary Table 2) and the comparison of breast cancer patient samples with normal breast samples. B Expression heatmap of RigoSig genes. Data shown for breast cancer subtypes and normal breast samples measured by the TCGA consortium [29] and normal breast samples measured by the GTEx consortium [30]. Data is row-normalized. TNBC: triple-negative breast cancer. C Kaplan–Meier curve of RigoSig genes in TNBC samples (from METABRIC [26, 27]) showing increased overall survival upon high expression of RigoSig genes. Samples in the top and bottom quartile of signature expression are compared. D Pathway enrichment analysis (Metascape) of RigoSig gene set. E Pathway enrichment analysis (Gene Ontology biological process) of RigoSig gene set. Developmental pathways are shown in red. Volcano plot for rigosertib versus DMSO treatment contrast. Geneset enrichment FDR are calculated using MROAST. Genes shown in red belong to genesets (F) Apical Junction (MSigDB hallmark gene sets), and (G) Epithelial Cell Differentiation (Gene Ontology).
Fig. 3
Fig. 3. PLK1 inhibition induces DNA damage with subsequent mitotic arrest.
A Representative flow-cytometry dot plots of EdU/Hoechst cell cycle staining of SUM149PT cells treated for 3 days with 100 nM rigosertib or DMSO. B Bar graph depicting the proportion of cells in different cell cycle states based on EdU/Hoechst cell cycle staining shown in Fig. 3A. n = 3 experimental replicates. Ordinary two-way ANOVA with multiple comparisons. Data are means ± SD. C Representative flow-cytometry dot plots of propidium iodide/annexin V staining of SUM149PT cells treated for 3 days with 100 nM rigosertib or DMSO. D Bar graph depicting the proportion of cells in different apoptotic states based on the propidium iodide/annexin V staining shown in Fig. 3C. n = 3 experimental replicates. Ordinary two-way ANOVA with multiple comparisons. Data are means ± SD. E Left panel: Representative fluorescence microscopy images of SUM149PT cells treated for 48 h with 100 nM rigosertib or DMSO and stained with γ-H2AX. The γ-H2AX signal is depicted in magenta, the DAPI nuclei stain in blue. Scale bar: 200 µm. Right panel: Bar graph showing the percentage of γ-H2AX positive cells. n = 2 experimental replicates with 4 technical replicates each. Mann-Whitney U-test. Data are means ± SD. F Bar graphs representing cell cycle states of individual cells tracked over time with time-lapse microscopy. Each horizontal bar represents one cell. Gray: interphase; red: mitosis (from DNA condensation to anaphase or mitotic slippage); blue: interphase after mitosis; green: interphase after mitotic slippage (DNA decondensation without division); yellow: cell death. G Representative flow-cytometry dot plots of EdU/Hoechst cell cycle staining of SUM149PT cells treated for 3 days with 1 µM nocodazole or DMSO. H Bar graph depicting the proportion of cells in different cell cycle states based on EdU/Hoechst cell cycle staining shown in Fig. 3E. n = 4 experimental replicates. Ordinary two-way ANOVA with multiple comparisons. Data are means ± SD. I Bar graphs representing average mRNA expression of ESR1 in SUM149PT cells treated with 1 µM nocodazole or DMSO. n = 3 experimental replicates with 2 technical replicates each. Unpaired Student’s t-test. Data are means ± SD. J Table depicting promoter motif enrichment of the RigoSig gene set. Top-5 enriched motifs are depicted. TF, transcription factor. K Dot plot depicting the growth factor upstream regulators identified by Ingenuity Pathway Analysis of the RigoSig gene set. L Bar graphs representing average mRNA expression of ESR1 and downstream targets in SUM149PT cells treated for 72 h with 100 nM rigosertib, 10 µM SR-11302, a combination treatment of rigosertib and SR-11302 or DMSO. n = 2 experimental replicates with 2 technical replicates each. Ordinary two-way ANOVA with multiple comparisons. Data are means ± SD.
Fig. 4
Fig. 4. PLK1 inhibition induces a sustained change in cell fate.
A Schematic of the drug wash-out experiment. SUM149PT cells were treated for 3 days with rigosertib or DMSO. Subsequently, the drug was washed out and cells were cultured for eight more days without the drug and then harvested for downstream experiments. B Immunoblot showing levels of ERα and ERK2 (loading control) in SUM149PT cells treated with the indicated concentrations of rigosertib as depicted in Fig. 4A. C Bar graphs representing average mRNA expression of ESR1 and downstream targets in SUM149PT cells treated with 100 nM rigosertib or DMSO as depicted in Fig. 4A. n = 2 experimental replicates with 2 technical replicates each. Unpaired Student’s t-test. Data are means ± SD. D Representative flow-cytometry dot plots of EdU/Hoechst cell cycle staining of SUM149PT cells treated with 100 nM rigosertib or DMSO as depicted in Fig. 4A. E Bar graph depicting the proportion of cells in different cell cycle states based on EdU/Hoechst cell cycle staining shown in Fig. 4D. n = 3 experimental replicates. Ordinary two-way ANOVA with multiple comparisons. Data are means ± SD. F Schematic of the experimental setup for in vitro treated SUM149PT cells grown as mouse xenografts in NSG mice. Cells were treated for 3 days with 1 µM rigosertib or DMSO prior to injection. G Kinetics of primary tumour growth of SUM149PT cells treated in vitro with 1 µM rigosertib (n = 5 mice) or DMSO (n = 5 mice) as depicted in Fig. 4F. Mann–Whitney U-test. Data are means ± SD. H Left panel: Pie charts depicting quantification of tumour incidence upon in vitro treatment of SUM149PT cells as in Fig. 4F. Right panel: Table summarizing the frequency of tumour initiating cells (TICs) and respective statistical analysis. Chi-square test.
Fig. 5
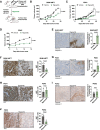
Fig. 5. PLK1 inhibition reduces tumour growth in vivo.
A Schematic depicting the experimental setup for in vivo treatment of SUM149PT or PDX1 mouse xenografts. Rigosertib or vehicle treatments were started once the tumours reached a volume ≥50 mm3. B Kinetics of primary tumour growth of SUM149PT cells treated in vivo with rigosertib (n = 10 mice) or vehicle (n = 9 mice) as depicted in Fig. 5A. Mann–Whitney U-test. Data are means ± SEM. C Kinetics of primary tumour growth of PDX1 cells treated in vivo with rigosertib (n = 5 mice) or vehicle (n = 6 mice) as depicted in Fig. 5A. Mann–Whitney U-test. Data are means ± SEM. D Kinetics of primary tumour growth of PDX2 cells treated in vivo with rigosertib (n = 6 mice) or vehicle (n = 11 mice) as in Fig. 5A. Mann–Whitney U-test. Data are means ± SEM. E Representative images of cleaved caspase 3 staining (left panel) and bar graph quantification of cleaved caspase 3 positive cells (right panel) in tissue sections of SUM149PT tumours treated with rigosertib or vehicle. Scale bars: 300 µm. n = 3 tumours per group. Unpaired Student’s t-test. Data are means ± SD. F Representative images of Ki67 (left panel) and bar graph quantification of Ki67 positive cells (right panel) in tissue sections of SUM149PT tumours treated with rigosertib or vehicle. Scale bars: 300 µm. n = 3 tumours per group. Unpaired Student’s t-test. Data are means ± SD. G Representative images of cleaved caspase 3 staining (left panel) and bar graph quantification of cleaved caspase 3 positive cells (right panel) in tissue sections of PDX1 tumours treated with rigosertib or vehicle. Scale bars: 300 µm. n = 3 tumours per group. Unpaired Student’s t-test. Data are means ± SD. H Representative images of Ki67 (left panel) and bar graph quantification of Ki67 positive cells (right panel) in tissue sections of PDX1 tumours treated with rigosertib or vehicle. Scale bars: 300 µm. n = 3 tumours per group. Unpaired Student’s t-test. Data are means ± SD. I Representative images of cleaved caspase 3 staining (left panel) and bar graph quantification of cleaved caspase 3 positive cells (right panel) in tissue sections of PDX2 tumours treated with rigosertib or vehicle. Scale bars: 300 µm. n = 3 tumours per group. Unpaired Student’s t-test. Data are means ± SD. J Representative images of Ki67 (left panel) and bar graph quantification of Ki67 positive cells (right panel) in tissue sections of PDX2 tumours treated with rigosertib or vehicle. Scale bars: 300 µm. n = 3 tumours per group. Unpaired Student’s t-test. Data are means ± SD.

References

    1. Varga J, Greten FR. Cell plasticity in epithelial homeostasis and tumorigenesis. Nat Cell Biol. 2017;19:1133–41. - PubMed
    1. Clevers H, Watt FM. Annual Review of Biochemistry Defining Adult Stem Cells by Function, not by Phenotype. Annu Rev Biochem. 2018;87:1015–27.. - PubMed
    1. Dekoninck S, Blanpain C. Stem cell dynamics, migration and plasticity during wound healing. Nat Cell Biol. 2019;21:18–24. - PMC - PubMed
    1. Koren S, Reavie L, Couto JP, de Silva D, Stadler MB, Roloff T, et al. PIK3CA H1047R induces multipotency and multi-lineage mammary tumours. Nature. 2015;525:114–8. - PubMed
    1. van Keymeulen A, Lee MY, Ousset M, Brohée S, Rorive S, Giraddi RR, et al. Reactivation of multipotency by oncogenic PIK3CA induces breast tumour heterogeneity. Nature. 2015;525:119–23. - PubMed

Publication types

MeSH terms

Substances