. 2022 Oct;18(10):1152-1160.
doi: 10.1038/s41589-022-01111-6. Epub 2022 Aug 25.

Observation of conformational changes that underlie the catalytic cycle of Xrn2

Affiliations

Observation of conformational changes that underlie the catalytic cycle of Xrn2

Jan H Overbeck et al. Nat Chem Biol. 2022 Oct.

Abstract

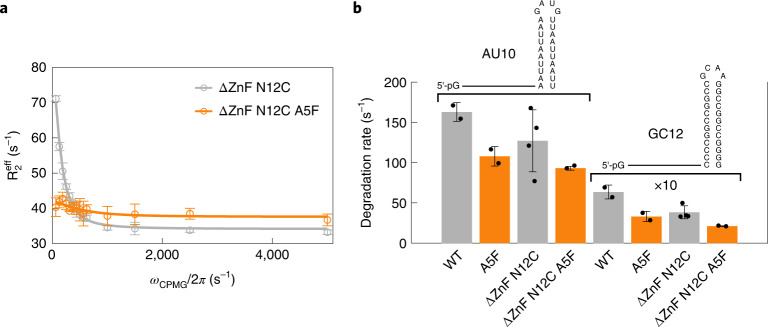
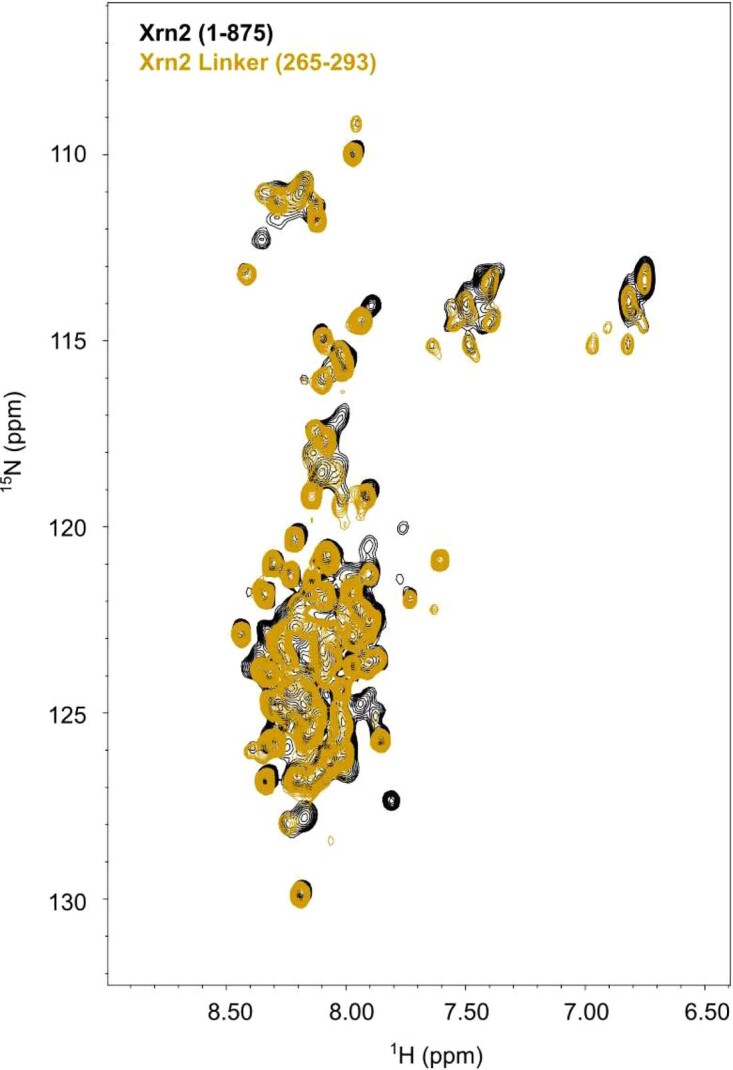
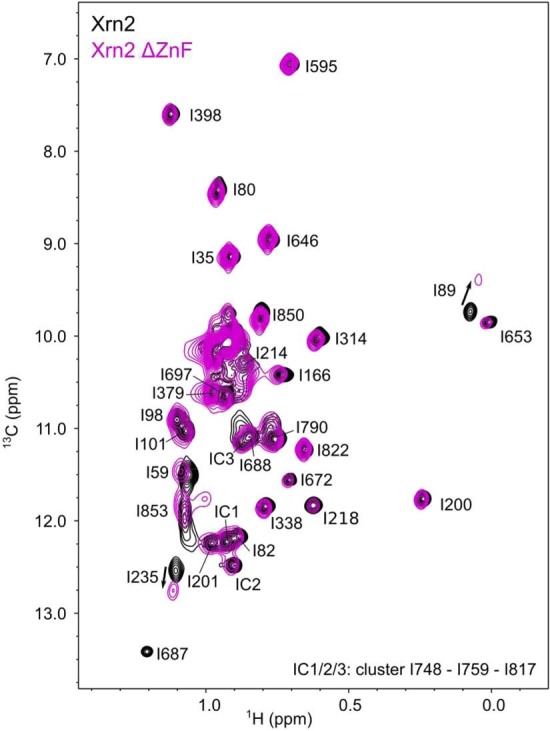
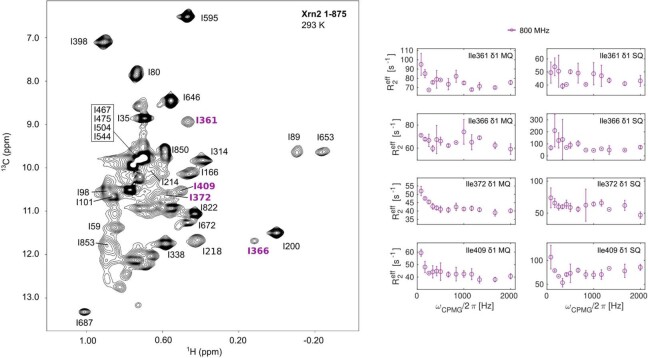
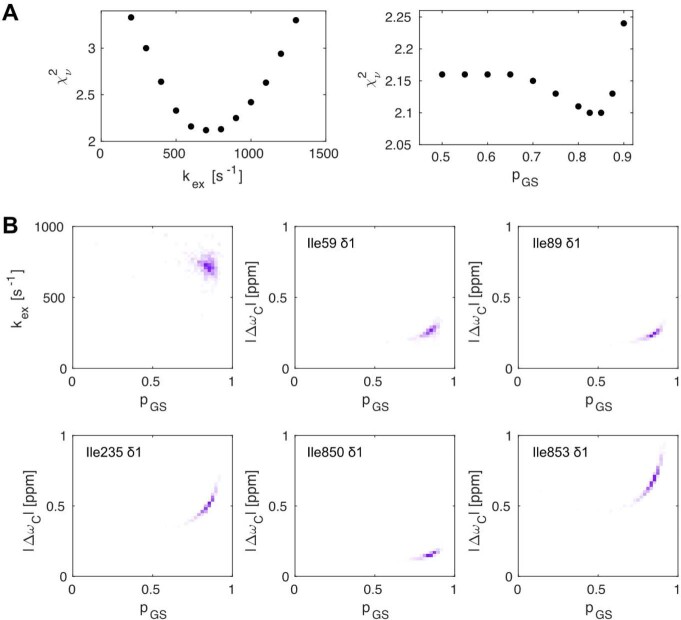
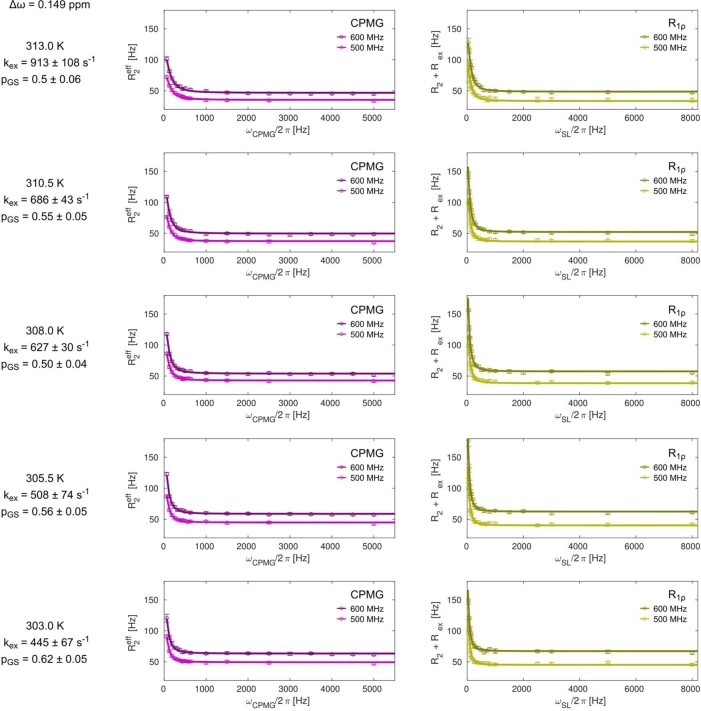
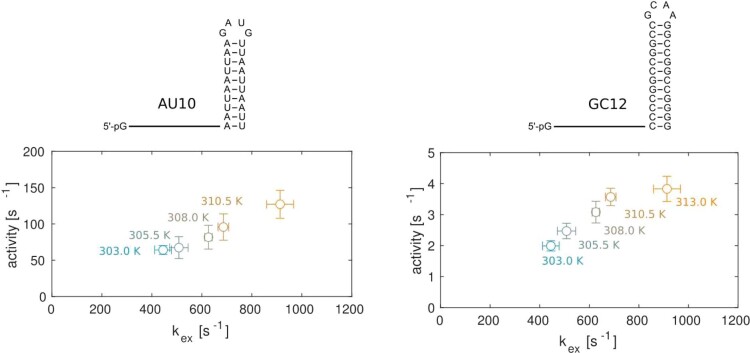
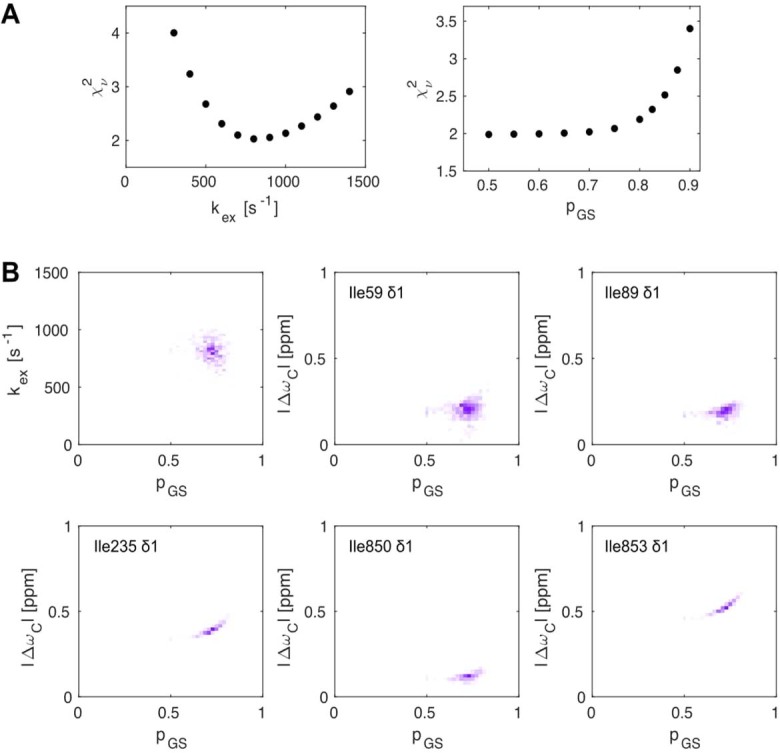
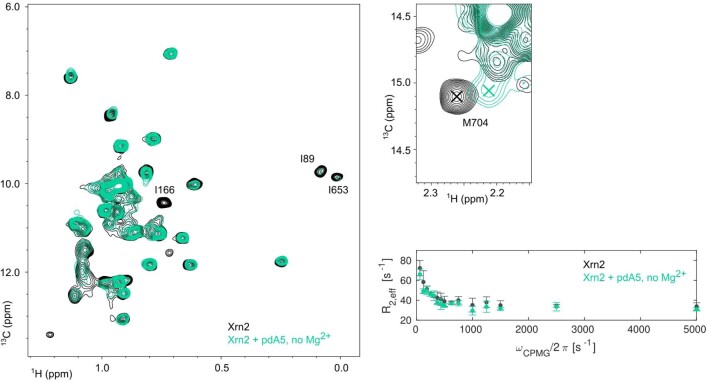
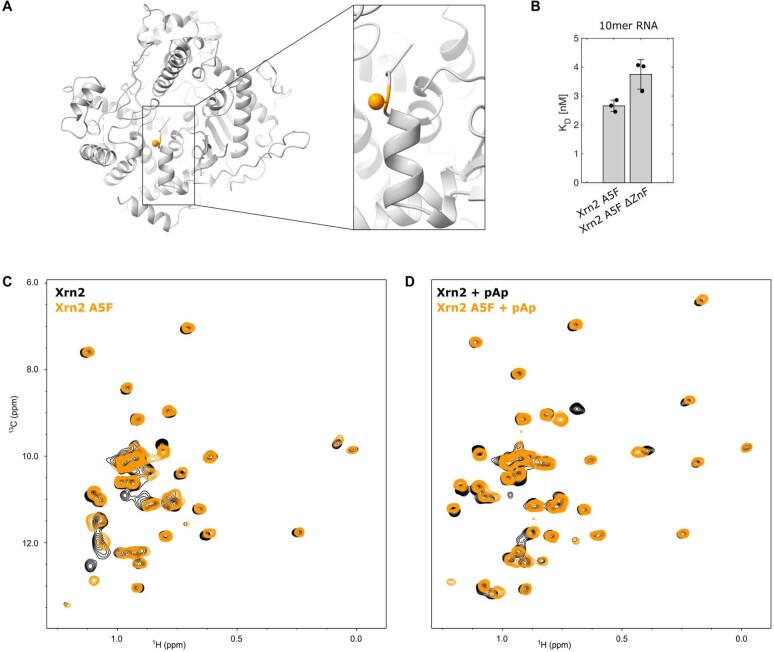
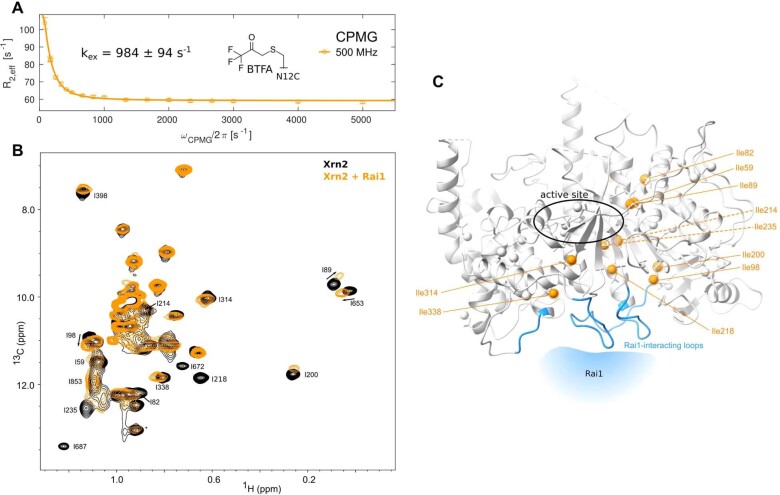
Nuclear magnetic resonance (NMR) methods that quantitatively probe motions on molecular and atomic levels have propelled the understanding of biomolecular processes for which static structures cannot provide a satisfactory description. In this work, we studied the structure and dynamics of the essential 100-kDa eukaryotic 5'→3' exoribonuclease Xrn2. A combination of complementary fluorine and methyl-TROSY NMR spectroscopy reveals that the apo enzyme is highly dynamic around the catalytic center. These observed dynamics are in agreement with a transition of the enzyme from the ground state into a catalytically competent state. We show that the conformational equilibrium in Xrn2 shifts substantially toward the active state in the presence of substrate and magnesium. Finally, our data reveal that the dynamics in Xrn2 correlate with the RNA degradation rate, as a mutation that attenuates motions also affects catalytic activity. In that light, our results stress the importance of studies that go beyond static structural information.


Conflict of interest statement

The authors declare no competing interests.

Figures

Fig. 1
Fig. 1. Structure of the Xrn2 enzyme from the thermophilic eukaryote C. thermophilum.
a, The Xrn1/Xrn2 enzyme sandwiches the first three bases of the substrate RNA between a Trp and a His residue (top left; pre-translocation state II). Subsequently, the enzyme undergoes a conformational change and adopts the active conformation (top right). After hydrolysis (bottom right) and product release (bottom left), the substrate moves one base farther (top left). b, Schematic representation of the domain architecture of the full-length Xrn2 protein (top) and two constructs (Xrn2: middle; Xrn2 ΔZnF: bottom) used in this study. Solid boxes represent folded regions, whereas the linker region between CR1 and CR2 as well as the C-terminal intrinsically disordered region (IDR) are predicted to be unstructured and represented as lines. c, Crystal structure of CtXrn2, color-coded according to b. CR1 and CR2 and the Xrn2-specific CTS form a globular Xrn-core, in which the active site is accessible only from the top. d, Close-up of the active site, where seven conserved acidic residues (shown as sticks) coordinate two Mg2+ ions. e, Sequence alignment of the Xrn2 ZnF motif. The residues that coordinate the Zn2+ ion are highlighted in yellow (cysteines) and brown (histidine); other conserved residues are indicated with an asterisk. f, NMR structure of the ZnF region. g, Affinities of 5-mer and 10-mer RNA to WT Xrn2 and Xrn2 ΔZnF. Note that the binding experiments were performed in the absence of Mg2+ and in the presence of Zn2+. Data are shown as mean ± s.d. and were performed as triplicates. h, Relative degradation rates of Xrn2 WT and Xrn2 ΔZnF for different RNAs (Supplementary Table 4) containing either a 10-nucleotide AU hairpin (AU10) or GC hairpins with 8, 10, 12 or 14 nucleotides (GC8, GC10, GC12 and GC14). Data are shown as mean ± s.d. and were performed as two biological duplicates. Source data
Fig. 2
Fig. 2. Methyl-TROSY NMR reveals conformational dynamics located around the N-terminal α1-helix.
a, Methyl-TROSY spectrum of U-2H, Ile-δ1-labeled Xrn2 recorded at 800 MHz 1H frequency and 313 K with assignments (Supplementary Methods and Supplementary Table 2). Isoleucines I467, I475, I504 and I544 are located in the flexible linker between CR1 and CR2 and were assigned by comparison of HMQC spectra from the Xrn2 WT protein and an Xrn2 ∆Linker construct. Isoleucines I748, I759 and I817 are in close spatial contact and lead to reciprocal chemical shift perturbations upon mutation; their isoleucine cluster (IC) was assigned to three peaks. The resonances of the I59, I89, I235 and I853 δ1-methyl groups are broadened. b, Distribution of isoleucine residues in the Xrn2 protein. Ile-δ1 probes are represented as spheres, where assigned probes are colored yellow, and unassigned probes are colored purple. Residues I59, I89, I235, I850 and I853 showed relaxation dispersion and are colored blue; their position is explicitly indicated. I59 and I89 are in close proximity and located above the central β-sheet opposite of I235. I850 and I853 are located in the C-terminal helix of Xrn2, with I853 directly opposite of Y14 at the rear side of the α1-helix. Methyl groups that could only be assigned at 293 K are shown in pink. c, MQ CPMG RD profiles measured at 313 K and 500 (yellow), 600 (red) and 800 (purple) MHz 1H frequency. Data points are shown with error bars derived from multiple measurements; the curve corresponds to the best fit of the joined analysis of MQ CPMG and 13C-SQ CPMG data from all five residues. Fit values for | ΔωC | are given in the individual panels. Data points are shown as mean ± s.d., as derived from at least two duplicate NMR measurements.
Fig. 3
Fig. 3. 19F NMR supports the sampling of an excited conformational state by the α1-helix.
a, Close-up view of the α1-helix, where the mutation N12C was introduced to allow for BTFA labeling. Hydrophobic residues are shown in blue; charged and polar solvent-exposed residues are shown in yellow. b, Helical wheel projection for residues 3–12 in the α1-helix. Coloring as in a. c, 19F NMR spectrum of Xrn2 ΔZnF N12CBTFA. d, CPMG and on-resonance R dispersion profiles for Xrn2 ΔZnF N12CBTFA samples recorded at 500 MHz and 600 MHz 1H frequency at 313 K. Data points are shown with error bars derived from multiple measurements; lines show the best fit derived from the simultaneous analysis of all datasets from five temperatures with one global | Δω | . At 313 K, this yielded: pGS = 0.50 ± 0.06; kex = 913 ± 108 s−1; and | Δω | = 0.15 ± 0.01 p.p.m. (Supplementary Table 6). Data points are shown as mean ± s.d., derived from three duplicate NMR measurements. e, Correlation between the exchange rate (kex) and the temperature. Note that the recording of the 19F relaxation data is considerably faster than the recording of the 13C data, as the latter depends on a series of 2D NMR spectra. Data points are shown as mean ± s.d., derived from 500 Monte Carlo simulations (Extended Data Fig. 5, Supplementary Figs. 12 and 13 and Supplementary Table 6). f, CPMG dispersion profiles of Xrn2 ΔZnF N12CTET at 11.7 T (500 MHz 1H frequency) and 14.1 T (600 MHz 1H frequency) at 313 K. The data were fit with the population pGS = 50% and the exchange constant kex = 913 s−1 obtained from analysis of the BTFA data. Data points are shown as mean ± s.d., derived from three duplicate NMR measurements. a.u., arbitrary unit.
Fig. 4
Fig. 4. Substrate binding induces a conformational change to a more rigid Xrn2 state.
a, Left: 1H NMR spectrum showing the H1' resonance of pAp (orange) and AMP (purple). Right: linear fit of the integrated peak intensities reveals a turnover rate of 0.05 min−1. Data points are shown as integrated peak intensities; error bars represent spectral noise. b, Overlay of methyl-TROSY spectra in the absence (black) and presence (light blue) of pAp. Binding of pAp leads to strong CSPs; the M704 resonance remains almost unperturbed. c, Ile-δ1 methyl groups in Xrn2 that could only be assigned in the pAp-bound state are colored green. Ile-δ1 resonances were colored according to the amplitude of the CSP. H61, W706 and M704 are shown as sticks. d, Correlation of 13C CSPs obtained upon binding of pAp and | Δω13C | extracted from the CPMG data (Fig. 2c). Data points are shown as mean ± s.d., derived from 500 Monte Carlo simulations (Extended Data Fig. 7 and Supplementary Table 6). e, 19F NMR spectra of Xrn2 ΔZnF N12CBTFA without ligand (black) and bound to pAp (light blue) or pdA5 (dark blue). Upon interaction with the substrates, the 19F line width is reduced from 55 Hz to 36 Hz (pAp) and 32 Hz (pdA5), respectively. f, CPMG RD profiles of Xrn2 ΔZnF N12CBTFA in the absence (gray) and presence (light blue) of pAp. Data points are shown as mean ± s.d., derived from three duplicate NMR measurements. g, Overlay of methyl-TROSY spectra in the absence (black) and presence (dark blue) of pdA5 (that is degraded to pdA2). CSPs are observed in the Ile region; M704 experiences a characteristic shift in the 1H dimension. h, CPMG RD profiles of Xrn2 ΔZnF N12CBTFA in the absence (gray) and presence (dark blue) of pdA5/pdA2. Data points are shown as mean ± s.d., derived from three duplicate NMR measurements. i, Overlay of methyl-TROSY spectra in the absence (black) and presence (yellow) of an xrRNA. The shift of M704 as well as Ile-δ1 CSPs close to the active site and the RNA entry site show that the complex is locked in the pre-translocation conformation. a.u., arbitrary unit.
Fig. 5
Fig. 5. The N-terminal helix is functionally important for RNA degradation.
a, CPMG relaxation dispersion profiles of Xrn2 ΔZnF N12CBTFA (gray) and Xrn2 ΔZnF A5F N12CBTFA (orange) at 11.7 T (500-MHz 1H frequency). Data points are shown as mean ± s.d., derived from three duplicate NMR measurements. b, Changes in the degradation rate of 5′-monophosphorylated AU10 and GC12 stem–loop RNAs by Xrn2, the Xrn2 A5F mutant, Xrn2 ΔZnF N12CBTFA and Xrn2 ΔZnF N12CBTFA A5F. The GC12 RNA is degraded approximately 20× slower than AU10, and the degradation rates are multiplied by 10 for clarity. Data points are shown as mean ± s.d., derived from two or four (Xrn2 ΔZnF N12C) independent experiments. Source data
Extended Data Fig. 1
Extended Data Fig. 1. 1H-15N TROSY spectra of Xrn2 (residues 1-875) and the Xrn2 linker (residues 265-293) that connects CR1 and CR2.
The 1H-15N TROSY NMR spectrum of Xrn2 (black; residues 1-875) displays only 1H-15N correlations from highly flexible parts of the protein; the 1H-15N resonances in the protein core are broadened beyond detection due to the high molecular weight of the enzyme. The 1H-15N spectrum from the isolated Xrn2 linker region (yellow; residues 265-293) largely overlaps with the spectrum from Xrn2 (1-875), proving that the CR1-CR2 linker region is flexible and disordered in the context of the full length protein.
Extended Data Fig. 2
Extended Data Fig. 2. The ZnF transiently interacts with the Xrn2 core.
Overlay of methyl TROSY NMR spectra of the Xrn2 enzyme with (black, WT) and without (purple, Delta ZnF) the ZnF. Removal of the ZnF does not perturb the structure of the Xrn2 enzyme, as can be concluded from the limited number of residues that experience CSPs. The observed CSPs upon deletion of the ZnF can be explained by the proximity of these residues to the (deleted) ZnF (for example I235) and by a transient interactions between the ZnF and a region of the enzyme that is located around the active site (I89, I59, I166, I314 and I850). In summary, these data thus show that the ZnF is loosely associated with Xrn2 and transiently interacts with the region of the enzyme that also contains the active site.
Extended Data Fig. 3
Extended Data Fig. 3. 1H-13C methyl TROSY spectrum of Xrn2 at 293 K and exemplary CPMG RD curves.
Methyl TROSY NMR spectrum of Xrn2 recorded at 293 K. Resonances that could only be assigned at 293 K are indicated in magenta. At 313 K these resonances could not be assigned due to strong exchange broadening. The residues that appear at 293 K display elevated relaxation rates at lower CPMG frequencies in both 13C SQ and 1H-13C MQ CPMG RD experiments. Due to overall enhanced relaxation and increased peak overlap at 293 K, a faithful fit of the CPMG RD data could not be reliably performed at the lower temperature. Data points are shown as mean ± s.d., as derived from 2 duplicate NMR measurements.
Extended Data Fig. 4
Extended Data Fig. 4. Reduced χ2 surfaces obtained from constrained parameter optimization and distribution of fit parameters obtained from Monte Carlo trials: 13C data.
(A) One dimensional reduced χ2 surfaces for 13C (SQ and MQ) CPMG RD data, where the fit is restricted by the exchange rate kex (left) or the ground state population pGS (right). The reduced χ2 as a function of kex exhibits a well defined minimum around 700-800 s−1, indicating that the exchange rate is well defined by the experimental data. The plot of reduced χ2 as a function of pGS on the other hand reveals a shallow minimum around pGS = 82%. In the current exchange regime the precision with which pES can be determined strongly depends on the lowest CPMG frequency that can be recorded, which is in turn limited by the fast relaxation rates of the very large enzyme. Note that pGS is well defined towards higher ground state populations (that is χ2 strongly increases for larger pGS), but loosely defined towards lower ground state populations (that is χ2 only moderately increases for lower pGS). (B) Subplots show the distribution of the exchange constant kex versus the ground state population pGS, as well as versus the carbon chemical shift differences | ΔωC | for the isoleucine residues that were used in the fitting. The distributions are based on a global fit of two RD experiments (SQ and MQ) for the 5 indicated residues at 3 magnetic field strengths (500, 600 and 800 MHz proton frequency). Note the typical correlation between Δω and pGS in the residues specific plots. The extracted fitting parameters, including errors are summarized in Supplementary Table 6.
Extended Data Fig. 5
Extended Data Fig. 5. Temperature dependent 19F relaxation dispersion.
19F CPMG (left) and R (right) relaxation dispersion of CtXrn2 1-875 ΔZnF N12CBTFA at temperatures between 303 K and 313 K and 1H Larmor frequencies of 500 MHz and 600 MHz. Fit parameters of the global fit and separate fits of CPMG and R datasets are included in Table S6. Note that the R data contains more datapoints at low frequencies. In the CPMG experiments the number of possible frequencies is determined by the relaxation delay and can only be a multiple of 1 / Trelax = 62.5 Hz (for the Trelax of 16 ms that was used). The R experiment, on the other hand, can use arbitrary spin-lock frequencies and is thus able to sample the RD curve at low frequencies better. Note that very low spinlock frequencies cannot be used in R experiment, as then the signal decay is no longer mono-exponential. The extracted fitting parameters, including errors are summarized in Supplementary Table 6. Data points are shown as mean ± s.d., as derived from 3 duplicate NMR measurements.
Extended Data Fig. 6
Extended Data Fig. 6. The exchange rate kex is linearly correlated with the activity in the Xrn2.
The activity (turnover rate) and exchange rates (kex) were measured with an Xrn2 ΔZnF N12C-BTFA sample. Activities are derived from HPLC assays, exchange rates are derived from the global fit of 19F relaxation dispersion data (Fig. 3E). The linear correlation between kex (kex = kGS-ES + kES-GS) and turnover rates suggests that the exchange and degradation rates are functionally linked. In the apo-state of the enzyme, the population of the excited (active) state is between 20 and 50%. The forward rate (kGS-ES) is thus between 0.2*kex and 0.5*kex. For a 20% excited state the kGS-ES rates (as measured) in the apo-enzyme correlate directly with the turnover rate (activity) of the AU10 RNA, indicating that the translocation of the substrate from the pre-translocation state II to the active state is rate limiting during the catalytic cycle. The degradation rates of RNAs with a stable GC stemloop structure (GC12 RNA) is considerably slower, as the rate limiting step in the catalytic cycle moves from the dynamics in the N-terminal helix to the time it takes to melt the secondary structure in the RNA substrate. Data points are shown as mean ± s.d. The errors in the activities are derived from 2 to 4 independent experiments; the errors in the rates are derived from 500 MC simulations (Extended Data Fig. 5, Supplementary Figs. 12 and 13 and Table S6). Source data
Extended Data Fig. 7
Extended Data Fig. 7. Reduced χ2 surfaces obtained from constrained parameter optimization and distribution of fit parameters obtained from Monte Carlo trials: simulations for 19F and 13C RD data.
(A) One dimensional reduced χ2 surfaces for the simultaneous analysis of 13C CPMG, 19F CPMG and 19F R relaxation data. Reduced χ2 values were obtained as a function of the exchange rate and the ground state population after optimization of all remaining free parameters. (B) Distribution of fit parameters obtained from MC simulations, where 13C CPMG, 19F CPMG and 19F R relaxation data were fitted simultaneously. The extracted fitting parameters, including errors are summarized in Supplementary Table 6.
Extended Data Fig. 8
Extended Data Fig. 8. In the absence of Mg2+ ions pdA5 interacts with the RNA binding pocket, but does not induce the active conformation in Xrn2.
Overlay of the 1H-13C HMQC methyl-TROSY spectra of the apo state (black) and after addition of pdA5 (green), recorded at 18.8 T and 313 K. CSPs of M704 (right panel) clearly report on the interaction of pdA5 with the RNA-binding pocket. Spectra are recorded in the absence of Mg2+. The absence of CSPs around the active site (as observed in the presence of Mg2+; Fig. 4G) indicates that the stable active conformation is not formed when Mg2+ is not present. Binding of pdA5 in the absence of Mg2+ does not change the dynamics of the α1-helix (opposed to what was observed in the presence of Mg2+; Fig. 4H), as shown by the overlay of 19F CPMG data in the absence (black) and presence (green) of pdA5. Data points are shown as mean ± s.d., as derived from 3 duplicate NMR measurements.
Extended Data Fig. 9
Extended Data Fig. 9. The A5F mutation does not interfere with the Xrn2 structure or with the binding of the substrate to Xrn2.
(A) Structure of Xrn2 with the mutation site A5 highlighted in orange and the Cβ atom depicted as a sphere. (B) Xrn2 A5F interacts with a 10mer RNA with very similar affinities as the WT enzyme (compare: Fig. 1G of the main text). Data points are shown as mean ± s.d., as derived from 3 independent experiments. (C) HMQC spectra of the Xrn2 WT (black) and Xrn2 A5F enzyme (orange). (D) HMQC spectra of the Xrn2 WT:pAp complex (black) and Xrn2 A5F:pAp complex (orange). Minor CSPs are visible around the N-terminal α1-helix, that are due to the A5F point mutation. The overall structural of the active state is, however, maintained in the presence of the A5F mutation (the black and orange spectra are highly similar in the absence and presence of substrate). Source data
Extended Data Fig. 10
Extended Data Fig. 10. Changes in the Xrn2 enzyme spread from the Rai1 interface along the central β-sheet.
(A) 19F CPMG RD profile of Xrn2 ΔZnF N12CBTFA:Rai1 sample at 313 K. The fit yields an exchange rate of kex = 984 ± 94 s−1, which matches the exchange rate of Xrn2 ΔZnF N12CBTFA in the absence of Rai1 (kex = 913 ± 108 s−1). Binding of Rai1 thus does not influence the motions in Xrn2. Data points are shown as mean ± s.d., as derived from 3 duplicate NMR measurements. (B) HMQC spectrum of Ileδ1-[13CH3] and Metε-[13CH3] methyl labeled Xrn2 in the absence (black) and presence (orange) of unlabeled, protonated Rai1. The resonances in the active site of Xrn2 are not influenced, indicating that Rai1 does not affect the active site of Xrn2. (C) Structure of Xrn2. Ileδ1 methyl groups that show pronounced changes in the HMQC spectrum upon interaction with Rai1 are highlighted in orange. The putative Rai1 interaction surface, inferred from the structure of the Xrn2:Rai1 complex in S. pombe (PDB 3FQD), is highlighted in blue. CSPs upon Rai1 interaction reach from the Rai1 binding site towards a region that is remote from the active site. pronounced changes in the HMQC spectrum upon interaction with Rai1 are highlighted in orange. The putative Rai1 interaction surface, inferred from the structure of the Xrn2:Rai1 complex in S. pombe (PDB 3FQD), is highlighted in blue. CSPs upon Rai1 interaction reach from the Rai1 binding site towards a region that is remote from the active site.

References

    1. Haimovich G, Choder M, Singer RH, Trcek T. The fate of the messenger is pre-determined: a new model for regulation of gene expression. Biochim. Biophys. Acta. 2013;1829:643–653. doi: 10.1016/j.bbagrm.2013.01.004. - DOI - PMC - PubMed
    1. Rabani M, et al. High-resolution sequencing and modeling identifies distinct dynamic RNA regulatory strategies. Cell. 2014;159:1698–1710. doi: 10.1016/j.cell.2014.11.015. - DOI - PMC - PubMed
    1. Shalem, O. et al. Transient transcriptional responses to stress are generated by opposing effects of mRNA production and degradation. Mol. Syst. Biol.4, 223 (2008). - PMC - PubMed
    1. Mugridge JS, Coller J, Gross JD. Structural and molecular mechanisms for the control of eukaryotic 5′–3′ mRNA decay. Nat. Struct. Mol. Biol. 2018;25:1077–1085. doi: 10.1038/s41594-018-0164-z. - DOI - PubMed
    1. Davidson L, Kerr A, West S. Co-transcriptional degradation of aberrant pre-mRNA by Xrn2. EMBO J. 2012;31:2566–2578. doi: 10.1038/emboj.2012.101. - DOI - PMC - PubMed

Publication types