. 2022 Aug 25;13(1):4986.
doi: 10.1038/s41467-022-32687-1.

Single residue modulators of amyloid formation in the N-terminal P1-region of α-synuclein

Affiliations

Single residue modulators of amyloid formation in the N-terminal P1-region of α-synuclein

Sabine M Ulamec et al. Nat Commun. .

Abstract

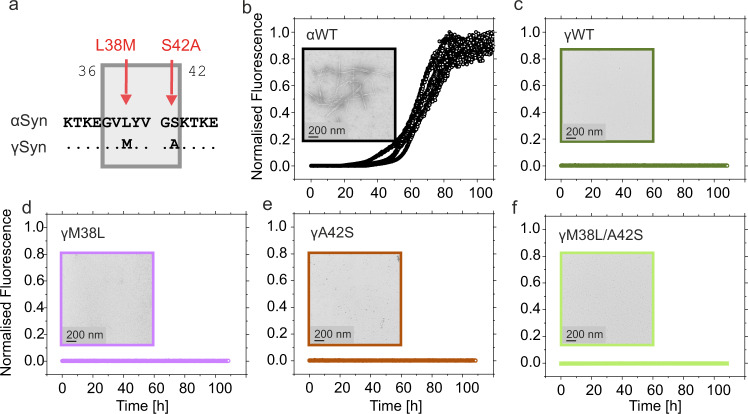
Alpha-synuclein (αSyn) is a protein involved in neurodegenerative disorders including Parkinson's disease. Amyloid formation of αSyn can be modulated by the 'P1 region' (residues 36-42). Here, mutational studies of P1 reveal that Y39A and S42A extend the lag-phase of αSyn amyloid formation in vitro and rescue amyloid-associated cytotoxicity in C. elegans. Additionally, L38I αSyn forms amyloid fibrils more rapidly than WT, L38A has no effect, but L38M does not form amyloid fibrils in vitro and protects from proteotoxicity. Swapping the sequence of the two residues that differ in the P1 region of the paralogue γSyn to those of αSyn did not enhance fibril formation for γSyn. Peptide binding experiments using NMR showed that P1 synergises with residues in the NAC and C-terminal regions to initiate aggregation. The remarkable specificity of the interactions that control αSyn amyloid formation, identifies this region as a potential target for therapeutics, despite their weak and transient nature.


Conflict of interest statement

The authors declare no competing interests.

Figures

Fig. 1
Fig. 1. Sequence alignment of α-, β- and γSyn.
a Each protein comprises three regions: the amphipathic N-region (blue), the amyloidogenic NAC region (pink) and the acidic C-terminal region (red). The sequence identity of βSyn and γSyn to αSyn for each region is shown. The hatched pink region in the centre of NAC for βSyn (Δ) depicts residues in the highly aggregation NAC core (residues 74–84) that are deleted in this sequence. The number of residues in each protein is shown on the right-hand side. b Sequence alignment for each of the paralogues (outlines coloured according to a. Positions of common familial PD mutations of αSyn are highlighted in green and each of the KTKEGV motifs involved in membrane binding is highlighted in brown. The ‘master controller’ P1 region is also highlighted in a grey shaded box. “–“ represents a deletion of a residue and “.” represents residue identity at that site.
Fig. 2
Fig. 2. The sequence of P1 (36GVLYVGS42) is crucial for amyloid formation.
Fibrillation of WT αSyn at pH 7.5 or 4.5 measured by a ThT fluorescence and b, c, negative stain TEM, showing the end points of the experiment at b pH 4.5 (20 mM sodium acetate) and c pH 7.5 (20 mM Tris-HCl) (each in 200 mM NaCl). df, as for ac, but for ΔP1. gi, as for ac, but for P1-SG-αSyn. Each condition was measured in at least triplicate. Note that short, clumped fibrils result at pH 4.5, presumably as fibril formation is rapid and the pH is close to the pI of the proteins. The results show that the sidechains of P1 are essential for rapid fibril formation at both pH values. A schematic of the sequence of αSyn is shown above each ThT plot, with the N-terminal region in blue, NAC in pink and the C-terminal region in red. The presence or absence of the P1 region is highlighted in each case. % pellet and t50 values for these experiments are shown in Supplementary Table 1a. Source data are provided as a Source Data file.
Fig. 3
Fig. 3. Amyloid formation kinetics of WT αSyn, ΔP1 and ΔΔin the presence of the peptides P1 or P1-SG.
Amyloid formation kinetics of a, e WT αSyn, b, f ΔP1 and c, g ΔΔ in the presence of different concentrations of P1-peptide (ac) or peptide P1-GS (eg). All experiments were carried out using 100 μM αSyn and peptide concentrations of 0 μM, 100 μM or 1 mM, at pH 7.5, 200 mM NaCl, 37 °C, 600 rpm. Note that under conditions of no or low amyloid formation, data points for different conditions overlay. Representative negative stain TEM images of samples with 10-fold molar excess of peptide taken at the end point (110 h) of one biological replicate (n = 2) are shown (d). Top, with peptide P1; lower, with peptide P1-SG. % pellet and t50 values are shown in Supplementary Table 1b. Source data are provided as a Source Data file.
Fig. 4
Fig. 4. The binding of peptide P1 alters the conformational ensemble of WT αSyn.
HN-CSPs of WT αSyn upon the addition of a a 5- or 10-fold molar excess of peptide-P1, b a 10-fold molar excess of peptide P1-SG and c NMR PREs of 15N-αSyn upon the addition of equimolar MTSL-labelled peptide-P1. The black line represents the median value over a rolling window of five residues. d Difference in chemical shifts of WT αSyn at pH 7.5 and 4.5. All experiments were performed in 20 mM Tris-HCl buffer, pH 7.5, 200 mM NaCl, 15 °C. The N-terminal region is shaded light blue, NAC is in purple, and the C-terminal region is in red. The P1 and P2 regions are shown in darker blue. Source data are provided as a Source Data file.
Fig. 5
Fig. 5. Alanine scan to identify residues in P1 region important for amyloid formation.
a Schematic showing the sequence of the P1 region of αSyn. b Amyloid kinetics of the seven Ala variants in the P1 region of αSyn determined using 100 μM αSyn at 37 °C, 20 mM Tris-HCl, 200 mM NaCl, pH 7.5, 600 rpm, coloured as in a. Data for WT αSyn and ΔP1 are shown for comparison. Inserted are representative TEM images taken at the end point of one biological replicate (n = 2). Scale bar = 200 nm. Further images for Y39A and S42A are shown in Supplemental Fig. 5. c AFM images of WT αSyn (top), Y39A (middle) and S42A (bottom) at the endpoint (110 h) of the fibril growth experiment. The inset shows an expanded scale (scale bar = 50 nm). d Height and e length/height distributions of the AFM samples (WT = 232; Y39A = 2355; S42A = 898 counts). Fibrillar species are illustrated in blue, monomers and oligomers are coloured in orange. Note that monomers/oligomers were not detected for WT αSyn. % pellet and t50 values for the aggregation assays are shown in Supplementary Table 1c. Source data are provided as a Source Data file.
Fig. 6
Fig. 6. αSyn aggregation rate is dependent on the identity of residue 38.
a Sequence alignment showing that the P1 regions of αSyn and γSyn differ at two positions, residues 38 and 42. Aggregation kinetics of b γSyn, c αSyn L38A (reproduced for clarity from Fig. 5b), and d αSyn L38M. The inset shows seeding of L38M with 10% (w/w) preformed WT αSyn seeds. e TEM images of αSyn L38M incubated in the absence (left hand side) or presence (right hand side) of 10% (w/w) preformed seeds of WT αSyn. f, g AFM image and height/length distribution analysis (n = 2167 objects analysed in one image) of the products of incubation of L38M (without seeds). Amyloid formation kinetics (h) and TEM images (i left hand side) for αSyn L38I incubated without seeds. The inset shows seeding of L38I with 10 % (w/w) preformed WT αSyn seeds, with the TEM image alongside (i right hand side). TEM images of each sample taken at the end of the reaction (110 h) of one biological replicate (n = 2) All reactions were carried out at pH 7.5, 200 mM NaCl, 37 °C, shaking (600 rpm) (de novo growth) or quiescent (seeded growth) each using 100 μM αSyn. See also Supplementary Fig. 8. % pellet and t50 values are shown in Supplementary Table 1d. Source data are provided as a Source Data file.
Fig. 7
Fig. 7. Sequence alterations in P1 do not result in aggregation of γSyn.
a Sequence alignment of αSyn and γSyn focussing on the P1 region (boxed). Residues that differ are highlighted with red arrows and labels. Aggregation kinetics for b WT αSyn, c WT γSyn, d γSyn M38L, e γSyn A42S and f γSyn M38L/A42S. In each case the relevant residue in γSyn is replaced with the equivalent residue in αSyn, demonstrating that these amino acid substitutions do not induce amyloid formation under these conditions (20 mM Tris-HCl, pH 7.5, 200 mM NaCl, 37 °C, 600 rpm shaking). Seeded data (with WT αSyn seeds) are shown in Supplementary Fig. 9. The insets show representative TEM images of each sample taken at the end of the reaction (110 h) of one biological replicate (n = 2). % pellet are shown in Supplementary Table 1e. Source data are provided as a Source Data file.
Fig. 8
Fig. 8. Effect of single amino-acid substitutions in αSyn and γSyn in the body wall muscle of C. elegans.
a Number of inclusions (larger than ~2 µm2 per animal). Data shown are the mean and s.e.m. for worms (n = 10) that were assessed for each time point. Stars indicate significance between the number of aggregates of αSyn WT expressing worms with all other constructs. *P < 0.05; **P < 0.01; ***P < 0.001; ****P < 0.0001. A two-sided Student’s t test was used in all cases. Exact p-values are listed in Supplementary Fig. 10c. Note that for N2 worms no data were collected as they do not express YFP. b Confocal microscopy images (representative image of one worm from n = 10) showing the head region of transgenic C. elegans expressing WT αSyn, αSyn L38A, αSyn Y39A, αSyn S42A or WT ySyn (each fused to YFP at their C-terminus) in the body wall muscle during ageing (Day 0, Day 5 and Day 10 of adulthood). Scale bar, 10 µm. A zoomed in region is shown alongside (scale bar, 10 µm). c Number of body bends per second (BBPS) of N2, WT αSyn::YFP, αSyn L38M::YFP, αSyn Y39A::YFP, αSyn YS42A::YFP and WT ySyn::YFP animals from Day 0 (L4 stage), Day 5 and Day 10 of adulthood. Data shown are mean and s.e.m. for three independent experiments; in each experiment, >10 worms were assessed for each time point. **P < 0.01; *P < 0.05, a two-sided T-test was used. Exact p-values are listed in Supplementary Fig. 10c. Note that the N2 Bristol nematodes are used as control animals as they do not express αSyn or YFP. Western blot analysis of protein extracts isolated from N2, WT αSyn::YFP, αSyn L38M::YFP, αSyn Y39A::YFP, αSyn YS42A::YFP and WT ySyn::YFP animals using an anti-GFP antibody are shown in Supplementary Fig. 10. Source data are provided as a Source Data file for graphs in a and c.

Similar articles

Cited by

References

    1. Iadanza MG, Jackson MP, Hewitt EW, Ranson NA, Radford SE. A new era for understanding amyloid structures and disease. Nat. Rev. Mol. Cell Biol. 2018;19:755–773. doi: 10.1038/s41580-018-0060-8. - DOI - PubMed
    1. Ping L, et al. Global quantitative analysis of the human brain proteome in Alzheimer’s and Parkinson’s Disease. Sci. Data. 2018;5:1–12. doi: 10.1038/sdata.2018.36. - DOI - PMC - PubMed
    1. Alam P, Bousset L, Melki R, Otzen DE. α‐synuclein oligomers and fibrils: a spectrum of species, a spectrum of toxicities. J. Neurochem. 2019;150:522–534. doi: 10.1111/jnc.14808. - DOI - PubMed
    1. Peelaerts W, et al. α-Synuclein strains cause distinct synucleinopathies after local and systemic administration. Nature. 2015;522:340–344. doi: 10.1038/nature14547. - DOI - PubMed
    1. Schweighauser M, et al. Structures of α-synuclein filaments from multiple system atrophy. Nature. 2020;585:464–469. doi: 10.1038/s41586-020-2317-6. - DOI - PMC - PubMed

Publication types