Observational Study
. 2022 Aug 25;12(1):14517.
doi: 10.1038/s41598-022-18843-z.

Pulmonary pathophysiology development of COVID-19 assessed by serial Electrical Impedance Tomography in the MaastrICCht cohort

Affiliations
Observational Study

Pulmonary pathophysiology development of COVID-19 assessed by serial Electrical Impedance Tomography in the MaastrICCht cohort

Serge J H Heines et al. Sci Rep. .

Abstract

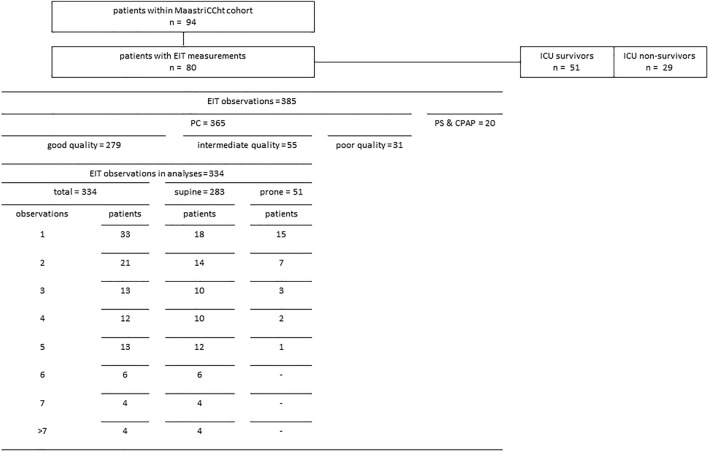
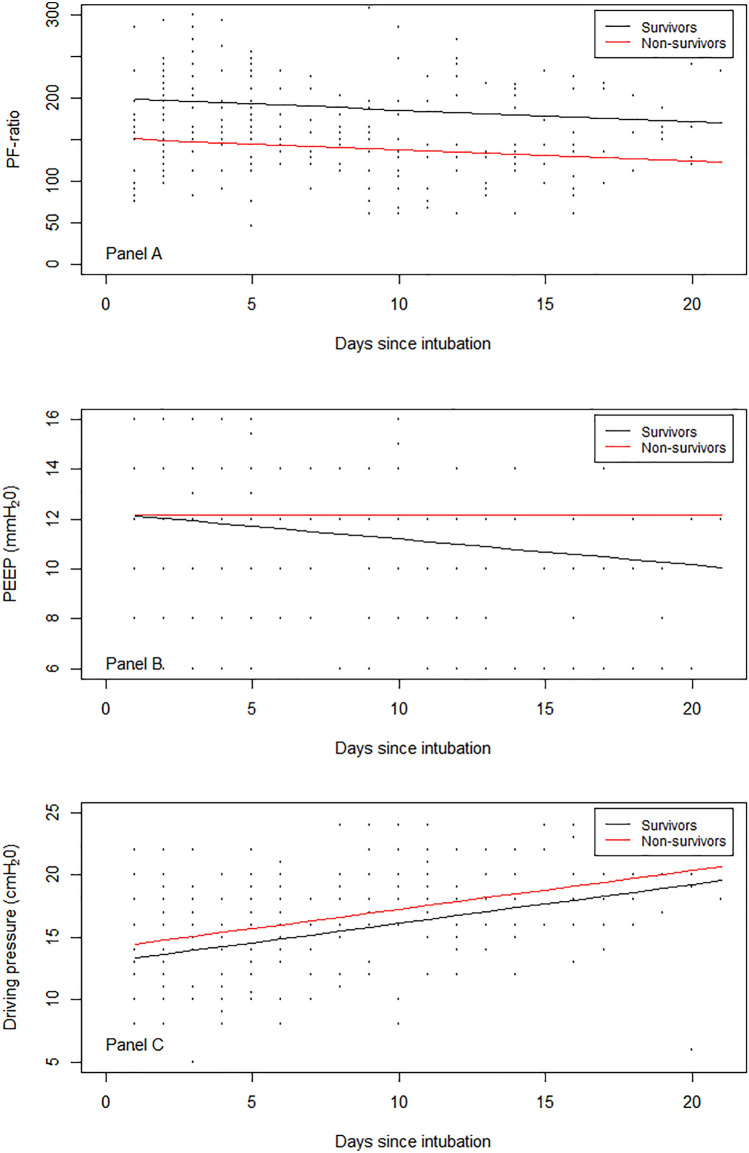
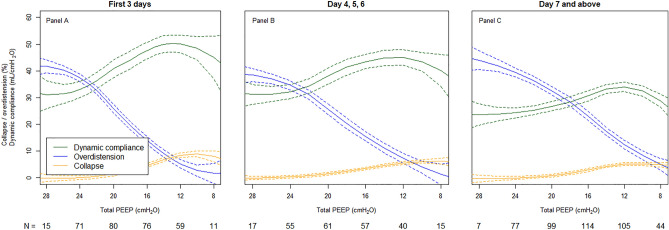
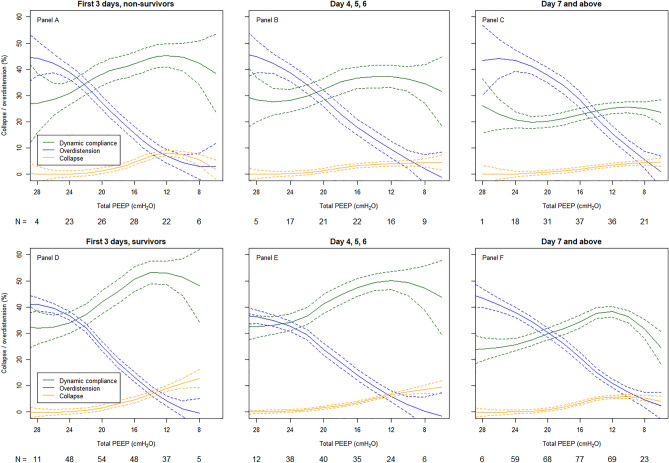
Patients with SARS-CoV-2 infection present with different lung compliance and progression of disease differs. Measures of lung mechanics in SARS-CoV-2 patients may unravel different pathophysiologic mechanisms during mechanical ventilation. The objective of this prospective observational study is to describe whether Electrical Impedance Tomography (EIT) guided positive end-expiratory pressure (PEEP) levels unravel changes in EIT-derived parameters over time and whether the changes differ between survivors and non-survivors. Serial EIT-measurements of alveolar overdistension, collapse, and compliance change in ventilated SARS-CoV-2 patients were analysed. In 80 out of 94 patients, we took 283 EIT measurements (93 from day 1-3 after intubation, 66 from day 4-6, and 124 from day 7 and beyond). Fifty-one patients (64%) survived the ICU. At admission mean PaO2/FiO2-ratio was 184.3 (SD 61.4) vs. 151.3 (SD 54.4) mmHg, (p = 0.017) and PEEP was 11.8 (SD 2.8) cmH2O vs. 11.3 (SD 3.4) cmH2O, (p = 0.475), for ICU survivors and non-survivors. At day 1-3, compliance was ~ 55 mL/cmH2O vs. ~ 45 mL/cmH2O in survivors vs. non-survivors. The intersection of overdistension and collapse curves appeared similar at a PEEP of ~ 12-13 cmH2O. At day 4-6 compliance changed to ~ 50 mL/cmH2O vs. ~ 38 mL/cmH2O. At day 7 and beyond, compliance was ~ 38 mL/cmH2O with the intersection at a PEEP of ~ 9 cmH2O vs. ~ 25 mL/cmH2O with overdistension intersecting at collapse curves at a PEEP of ~ 7 cmH2O. Surviving SARS-CoV-2 patients show more favourable EIT-derived parameters and a higher compliance compared to non-survivors over time. This knowledge is valuable for discovering the different groups.


Conflict of interest statement

The authors declare no competing interests.

Figures

Figure 1
Figure 1
Study sample. Patients and good and intermediate quality serial EIT measurements during pressure control mode ventilation. Observations > 7 may include a range of 8 to 17 EIT observations, resulting in a total of 334. ICU, intensive care unit; EIT, electrical impedance tomography; PC, pressure control mode ventilation; PS, pressure support mode ventilation; CPAP, continuous positive airway pressure mode ventilation.
Figure 2
Figure 2
PaO2/FiO2-ratio (mmHg) and PEEP (cmH2O) for survivors and non-survivors over time. (A): PaO2/FiO2-ratio for survivors (black) and non-survivors (red) over time; (B): positive end-expiratory pressure (PEEP) for survivors and non-survivors over time; (C): driving pressure for survivors and non-survivors over time.
Figure 3
Figure 3
Dynamic respiratory system compliance, alveolar overdistension, and alveolar collapse for the whole population from admission to beyond a week after. EIT population curves that show mean (solid lines), dynamic compliance (green), overdistension (blue), and collapse (yellow) with 95% confidence intervals (dashed lines) for the whole population from PEEP steps 28 to 8 cmH2O over time for the first 3 days (A), day 4, 5 and 6 (B) and day 7 and above (C).
Figure 4
Figure 4
Dynamic respiratory system compliance, alveolar overdistension, and alveolar collapse for the whole population from admission to beyond a week after in ICU survivors and ICU non-survivors. EIT population curves that show mean (solid lines), dynamic compliance (green), overdistension (blue), and collapse (yellow) with 95% confidence intervals (dashed lines) from PEEP steps 28 to 8 cmH2O for ICU non-survivors over time for the first 3 days (A), for day 4, 5 and 6 (B) and for day 7 and above (C); and for ICU survivors over time for the first 3 days (D), for day 4, 5 and 6 (E) and for day 7 and above (F).

References

    1. Dergaa I, Ben Saad H, Souissi A, Musa S, Abdulmalik MA, Chamari K. Olympic games in COVID-19 times: Lessons learned with special focus on the upcoming FIFA World Cup Qatar 2022. Br. J. Sports Med. 2022;56(12):654–656. doi: 10.1136/bjsports-2021-105276. - DOI - PubMed
    1. Musa S, Dergaa I, Abdulmalik MA, Ammar A, Chamari K, Saad HB. BNT162b2 COVID-19 vaccine hesitancy among parents of 4023 young adolescents (12–15 Years) in Qatar. Vaccines (Basel) 2021;9:9. - PMC - PubMed
    1. Richardson S, Hirsch JS, Narasimhan M, Crawford JM, McGinn T, Davidson KW, et al. Presenting characteristics, comorbidities, and outcomes among 5700 patients hospitalized with COVID-19 in the New York City area. JAMA. 2020;323(20):2052–2059. doi: 10.1001/jama.2020.6775. - DOI - PMC - PubMed
    1. King CS, Sahjwani D, Brown AW, Feroz S, Cameron P, Osborn E, et al. Outcomes of mechanically ventilated patients with COVID-19 associated respiratory failure. PLoS ONE. 2020;15(11):e0242651. doi: 10.1371/journal.pone.0242651. - DOI - PMC - PubMed
    1. Marini JJ, Gattinoni L. Management of COVID-19 respiratory distress. JAMA. 2020;323(22):2329–2330. doi: 10.1001/jama.2020.6825. - DOI - PubMed

Publication types