. 2022 Sep;4(9):1109-1118.
doi: 10.1038/s42255-022-00615-8. Epub 2022 Aug 25.

Analyzing cell-type-specific dynamics of metabolism in kidney repair

Affiliations

Analyzing cell-type-specific dynamics of metabolism in kidney repair

Gangqi Wang et al. Nat Metab. 2022 Sep.

Abstract

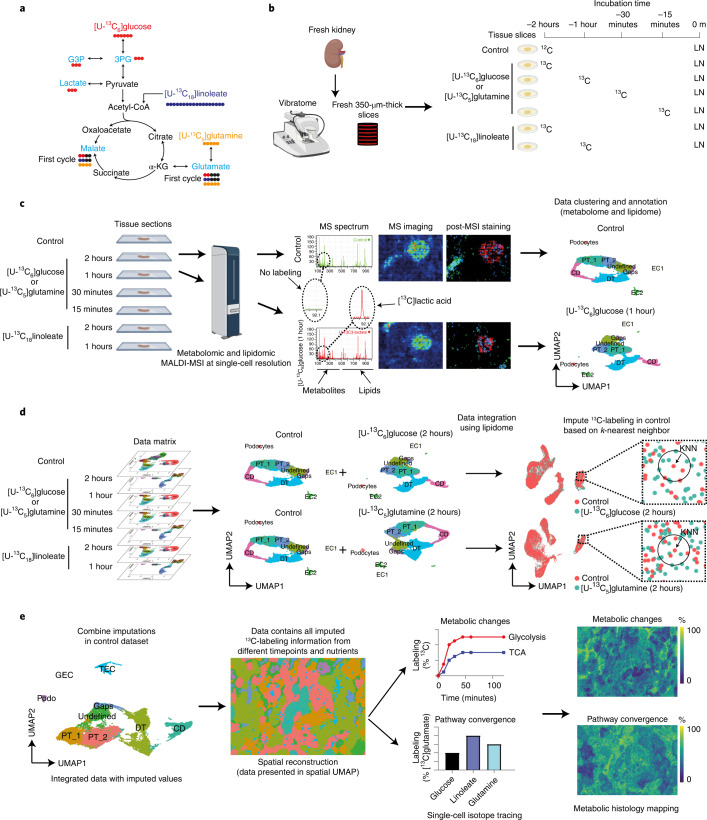
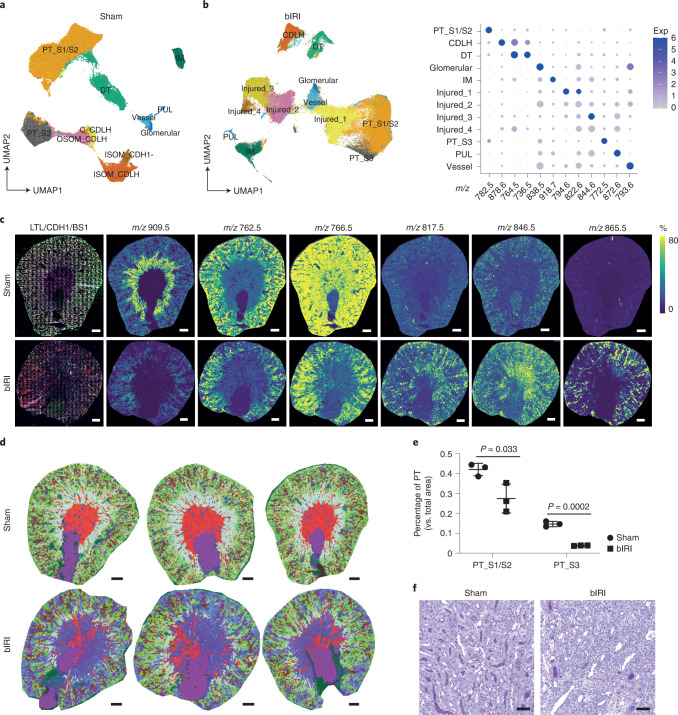
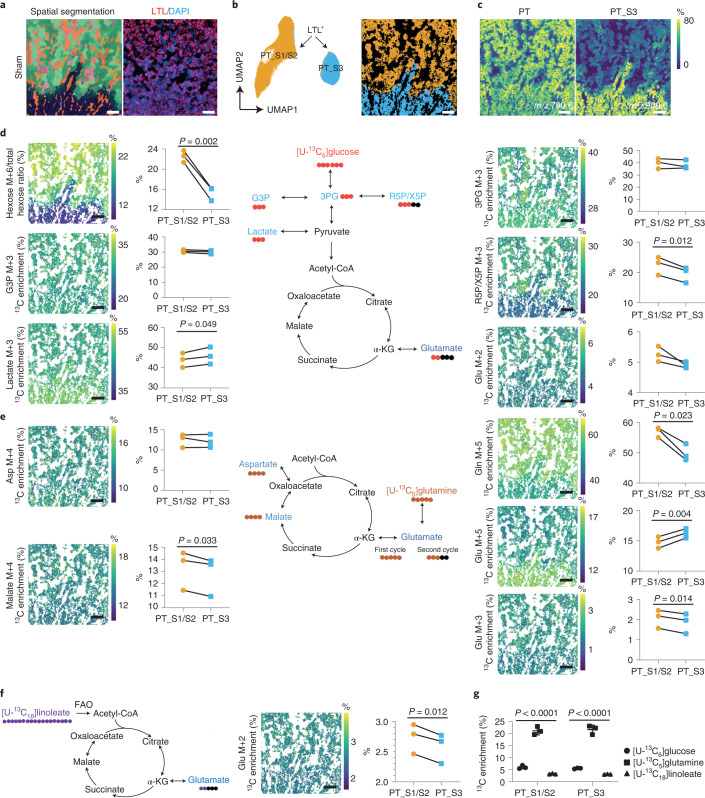
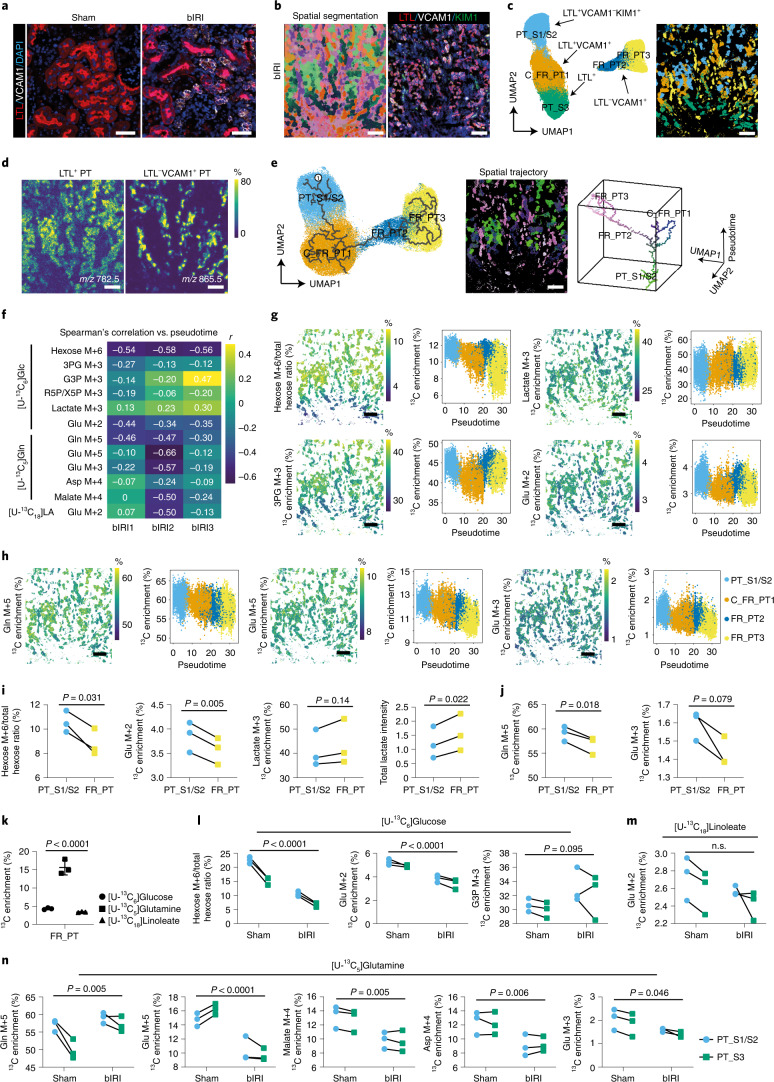
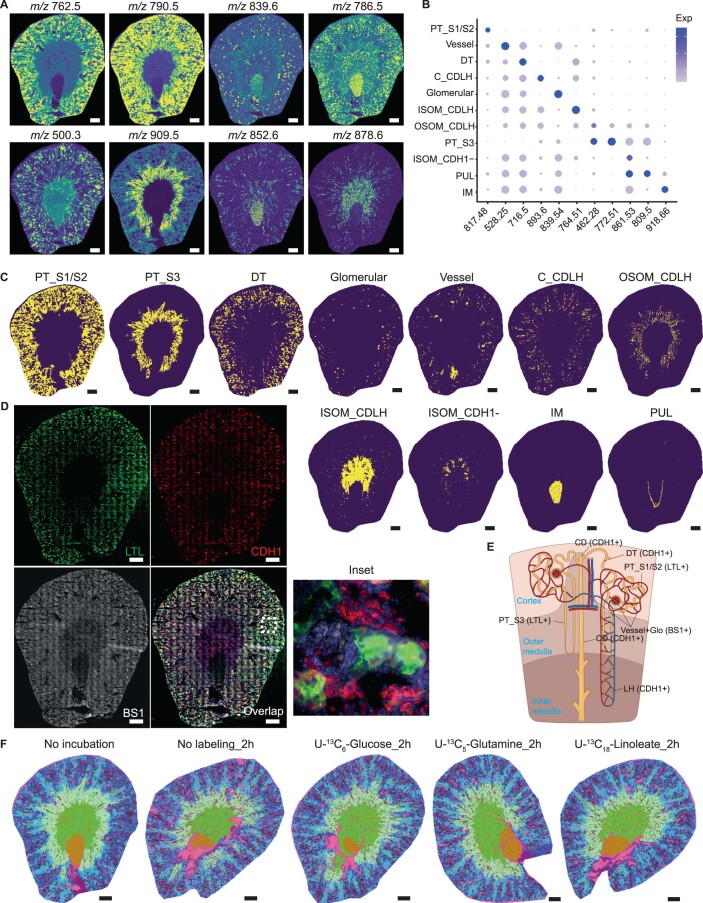
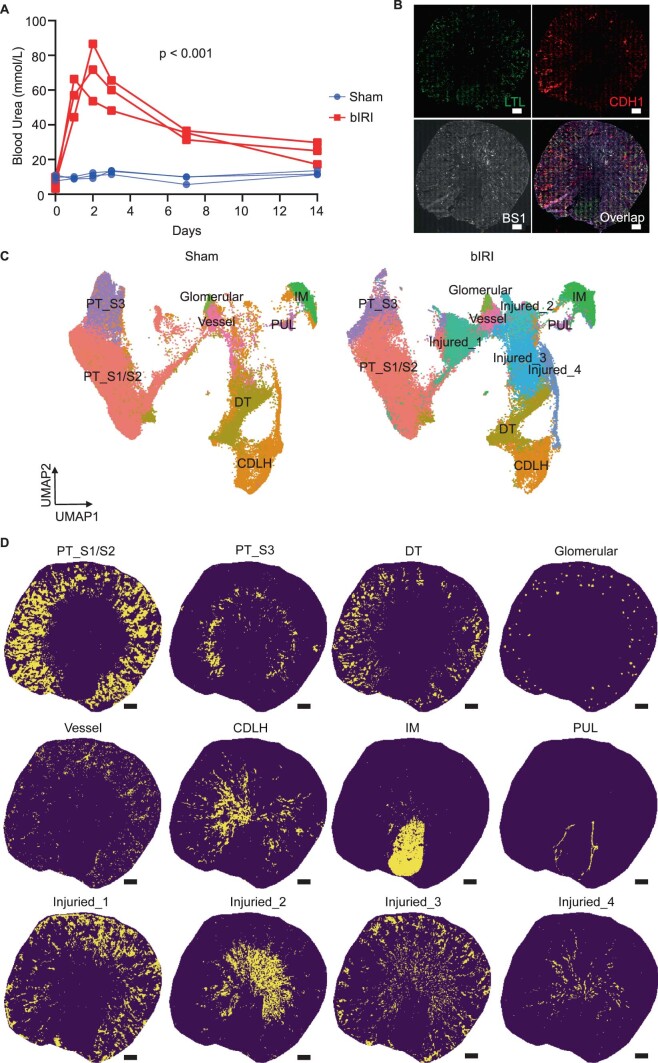
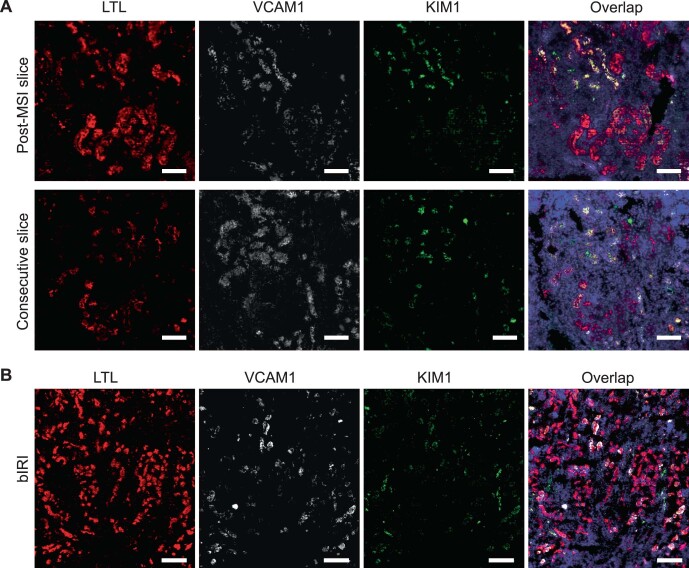
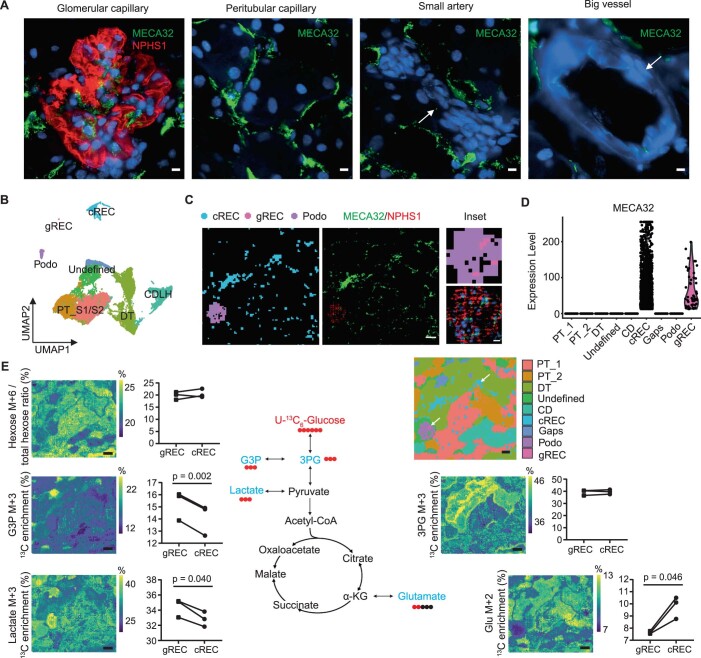
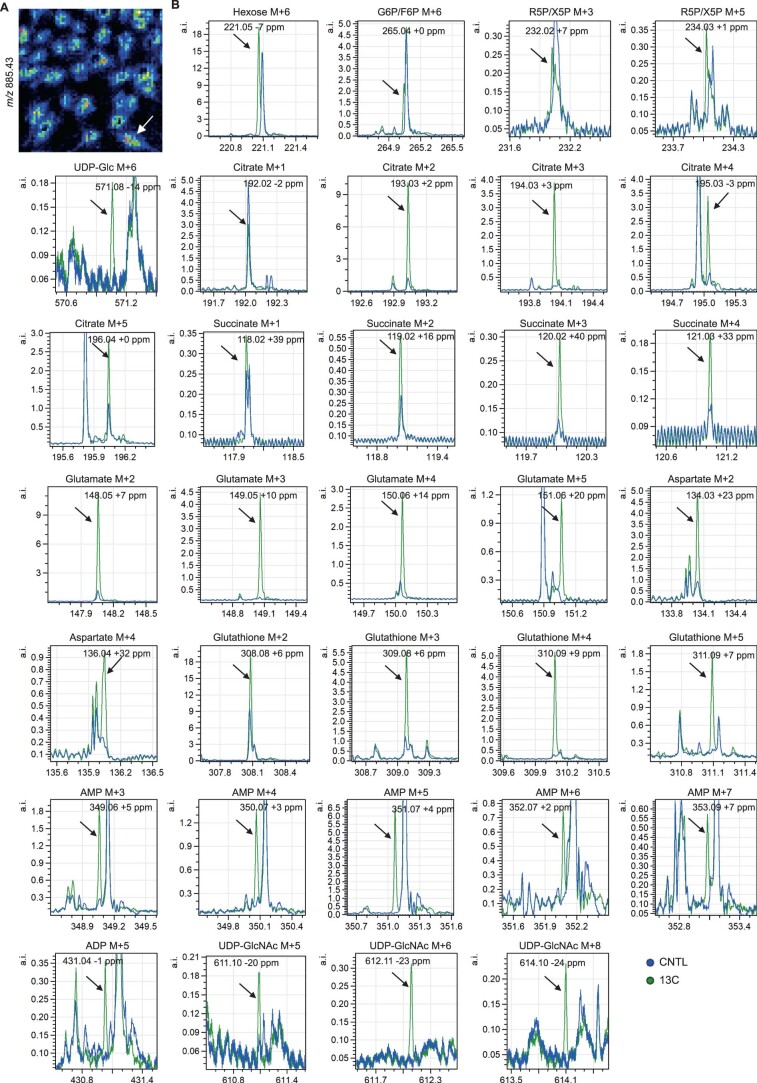
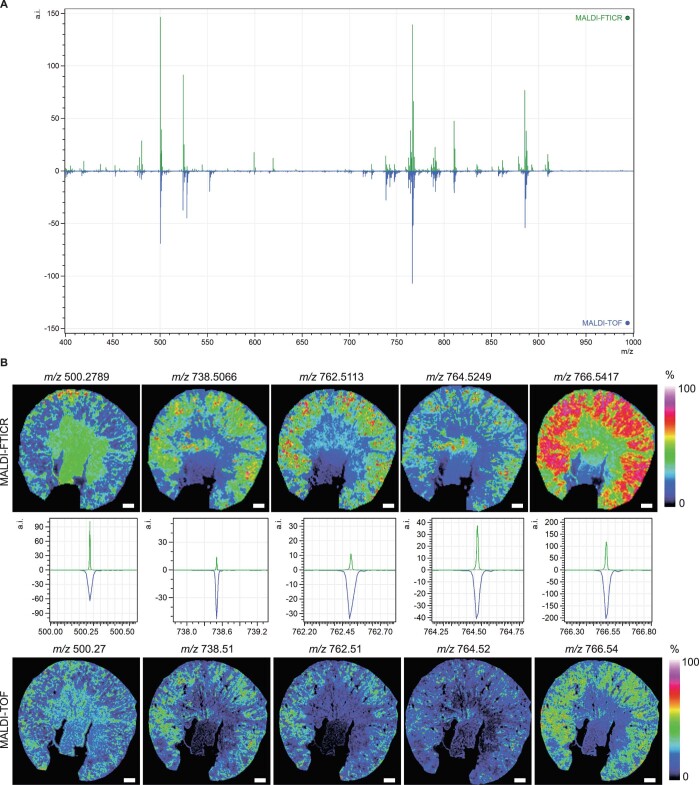
A common drawback of metabolic analyses of complex biological samples is the inability to consider cell-to-cell heterogeneity in the context of an organ or tissue. To overcome this limitation, we present an advanced high-spatial-resolution metabolomics approach using matrix-assisted laser desorption/ionization mass spectrometry imaging (MALDI-MSI) combined with isotope tracing. This method allows mapping of cell-type-specific dynamic changes in central carbon metabolism in the context of a complex heterogeneous tissue architecture, such as the kidney. Combined with multiplexed immunofluorescence staining, this method can detect metabolic changes and nutrient partitioning in targeted cell types, as demonstrated in a bilateral renal ischemia-reperfusion injury (bIRI) experimental model. Our approach enables us to identify region-specific metabolic perturbations associated with the lesion and throughout recovery, including unexpected metabolic anomalies in cells with an apparently normal phenotype in the recovery phase. These findings may be relevant to an understanding of the homeostatic capacity of the kidney microenvironment. In sum, this method allows us to achieve resolution at the single-cell level in situ and hence to interpret cell-type-specific metabolic dynamics in the context of structure and metabolism of neighboring cells.


Conflict of interest statement

The authors declare no competing interests.

Figures

Fig. 1
Fig. 1. Workflow of cell-type-specific dynamic metabolic measurements and analysis.
a, Overview of the traced isotopes in the primary carbon metabolism. The contributions of U-13C-labeled nutrients ([U-13C6]glucose, [U-13C18]linoleate, and [U-13C5]glutamine) to glycolytic and TCA intermediates (light blue) were traced. b, Fresh mouse kidney tissue was cut into 350-µm-thick slices using a vibratome. For 13C isotope tracing in tissue culture, different 13C-labeled nutrients were added to a well-defined medium described in the Methods section at different timepoints. Samples were quenched using liquid nitrogen (LN). c, The metabolome and lipidome were measured in all samples using MALDI-MSI at high spatial resolution (5 × 5 µm2 pixel size). MALDI-MSI data were preprocessed and transferred into a data matrix. Cell types were identified on the basis of lipid profiles and IF staining after MALDI-MSI. Images in b and c were created using Biorender. d, Cell-type-specific (phospho)lipid data were used to characterize various cell types. The lipid data were used for anchor-based data integration of the ‘control’ data matrix with data matrices of sections from 13C-isotope tracing measurements. We used KNN analysis to impute the molecular information contained in the 13C-labeling timecourse data matrices into the control data matrix. e, Establishment of the imputed dataset, in which each pixel contains all added 13C-labeling information from each timepoint and labeled nutrient. Dynamic metabolic calculations were performed on single pixels, including metabolic rates and pathway convergence. To visualize the heterogeneity in tissue metabolic dynamics, a series of pseudoimages, which were generated from calculated values, were created by tracing pixel coordinates back to the original spatial information from the MALDI-MSI analysis. α-KG, alpha-ketoglutaric acid; DT, distal tubules; CD, collecting ducts; PT, proximal tubules; EC, endothelial cells; GEC, glomerular endothelial cells; TEC, peritubular endothelial cells.
Fig. 2
Fig. 2. Lipid heterogeneity in mouse IRI kidneys.
a, Lipid heterogeneity in mouse sham kidneys (n = 3) from which mice were opened up and closed similarly as bIRI mice but no ligations were performed, visualized in a two-dimensional (2D) UMAP plot of MALDI-MSI data (20 × 20 µm2 pixel size). b, Lipid heterogeneity in mouse bIRI kidneys (n = 3), visualized in a 2D UMAP plot of MALDI-MSI data at 20 × 20 µm2 pixel size. The dot plot displays lipid expression of cluster-enriched signatures. Exp, expression. c, IF staining (LTL, green), E-cadherin (CDH1, red), and BS1-lectin (gray)) of tissue that had been analyzed with MALDI-MSI. Representative images showing lipid species distributions in sham (n = 3) and bIRI (n = 3) kidneys, as recorded by MALDI-MSI (20 × 20 μm2 pixel size). Scale bars, 500 µm. d, Molecular histology of sham (n = 3) and bIRI (n = 3) kidneys generated from integrated three-dimensional (3D) UMAP analysis on the basis of lipid profiles. The color code represents the position of pixels in the 3D UMAP (UMAP1: red, UMAP2: green, UMAP3: blue). Scale bar, 500 µm. e, Comparison of PT areas between sham (n = 3) and bIRI (n = 3) kidneys. Two-tailed t-test was performed. f, PAS staining showing the tubular structures in the outer stripe outer medulla area of sham (n = 3) and bIRI (n = 3) kidneys. Scale bars, 50 µm. PT-S1/S2, cortical proximal tubular segments 1 and 2; PT-S3, outer stripe of outer medulla proximal tubular segment; DT, distal tubule; CDLH, collecting duct and loop of Henle; IM, inner medulla; OSOM, outer stripe of outer medulla; ISOM, inner stripe of outer medulla; PUL, pelvic urothelial lining. Source data
Fig. 3
Fig. 3. Dynamic metabolic measurements on sham kidney PT cells.
a, Left, representative molecular histology of cortical and outer stripe of outer medulla areas of sham kidney (n = 3), generated from three-dimensional UMAP analysis on the basis of lipid profiles recorded by MALDI-MSI (5 × 5 μm2 pixel size). Right, LTL immunofluorescent staining on post-MALDI-MSI tissue (red). b, 2D UMAP plot and representative spatial segmentation showing lipid heterogeneity between LTL-positive proximal tubular cells from the cortical and outer stripe of outer medulla areas of sham kidneys (n = 3). c, Representative images showing lipid species distribution in the cortical and outer stripe of outer medulla areas of sham kidney (n = 3), as recorded by MALDI-MSI (5 × 5 μm2 pixel size). d, Dynamic metabolic measurements using [U-13C6]glucose on PT cells of sham kidneys. e, Dynamic metabolic measurements using [U-13C5]glutamine on PT cells of sham kidneys. f, Dynamic metabolic measurements using [U-13C18]linoleate on PT cells of sham kidneys. Images showing the average 13C enrichment of isotopologues on tissue. Graphs showing the comparison of the average 13C enrichment of isotopologues between PT S1/S2 and PT S3. The average 13C enrichment (area under curve (AUC) normalized to total time) of isotopologues were derived from [U-13C6]glucose or [U-13C5]glutamine measured at different timepoints (0, 15, 30, 60, and 120 minutes) or [U-13C18]linoleate measured at different timepoints (0, 60, and 120 minutes). Charts showing the traced isotopes and their derived isotopologues. Two-tailed paired t-test was performed. All scale bars, 200 µm. g, Direct carbon contribution of different nutrients to glutamate at the 2-hour timepoint, as measured from the glutamate isotopologues M+2, M+3, and M+5. One-way analysis of variance (ANOVA) was performed (n = 3). Glc, glucose; 3PG, 3-phosphoglycerate; G3P, glycerol-3-phosphate; R5P/X5P, ribulose-5-phosphate/xylulose-5-phosphate; α-KG, alpha-ketoglutaric acid; Glu, glutamate; Gln, Glutamine; Asp, aspartate. Source data
Fig. 4
Fig. 4. Dynamic metabolic measurements on bIRI kidney PT cells.
a, Representative images of LTL and VCAM1 IF staining on sham and bIRI kidneys (n = 3). b, Left, representative molecular histology of cortical and outer stripe outer medulla (left) areas of bIRI kidney (n = 3), generated from UMAP of recorded lipid profiles. Right, IF staining following MALDI-MSI. c, UMAP plot (left) and representative spatial segmentation (right) showing lipid heterogeneity between PT cells from cortical and OSOM of bIRI kidneys (n = 3). Spatial segmentation image showing the distribution of the UMAP clusters on tissue with same color. d, Representative lipid species distribution in cortical and outer stripe outer medulla areas of bIRI kidney (n = 3). e, Left, Embedding of PT pixels from bIRI kidneys (n = 3), showing the trajectory of PT injury using pseudotime lipidomics analysis (starting point 1). Middle, spatial-trajectory map showing the pseudotime score and UMAP embedding of each pixel on tissue. Right, 3D scatter plot of cell-type-specific trajectories, with the same colors as pixels in the spatial-trajectory map. f, Spearman’s correlation between pseudotime and average 13C isotopologue enrichment on all PT pixels. g,h, Dynamic metabolic measurements using [U-13C6]glucose (g) or [U-13C5]glutamine (h), and their trajectory changes on PT cells of bIRI kidneys (n = 3). i,j, Dynamic metabolic comparison of [U-13C6]glucose and total lactate levels (i) or [U-13C5]glutamine measurements (j) between LTL+VCAM1KIM1 PT cells (PT-S1/S2) and LTLVCAM1+ PT cells (FR_PT). A two-tailed paired t-test was performed. k, Direct carbon contribution of different nutrients to glutamate at 2 hours in FR_PT, from the glutamate isotopologues M+2, M+3, and M+5. One-way ANOVA was performed (n = 3). Comparison of dynamic metabolic measurements using [U-13C6]glucose (l), [U-13C18]linoleate (m), or [U-13C5]glutamine (n) on PTs from sham kidneys and healthy PTs from IRI kidneys. Two-way ANOVA was performed. Images and graphs show the average 13C enrichment (area under curve (AUC) normalized to total time) of isotopologues derived from [U-13C6]glucose or [U-13C5]glutamine, measured at different timepoints (0, 15, 30, 60, and 120 minutes), or [U-13C18]linoleate, measured at different timepoints (0, 60, and 120 minutes). Scale bars: (a) 50 µm, (be,g,h) 200 µm. Source data
Extended Data Fig. 1
Extended Data Fig. 1. Lipid heterogeneity and stability in mouse kidneys.
a, Lipid species distribution in a mouse kidney tissue sample as recorded by MALDI-MSI at 20 × 20 μm2 pixel-size. b, Dot plot displaying lipid expression of cluster-enriched signatures. c, Distribution of different renal cell clusters on tissue as identified in Fig. 2a. d, Immunofluorescent staining (Lotus Tetragonolobus Lectin (LTL, green), E-cadherin (CDH1, red) and BS1-lectin (gray)) after MALDI-MSI measurement. e, Nephron anatomy showing the identification of renal cell types based on immunofluorescent staining. f, Molecular histology of kidneys generated from integrated three-dimensional UMAP analysis of different datasets based on lipid profiles showing the specificity and stability of lipids profiles after introducing 13C-labeled nutrients for 2 hours. All scale bars = 500 µm. Abbreviations: PT_S1/S2, cortical proximal tubular segments 1/2; PT_S3, outer stripe of outer medulla proximal tubular segment; DT, distal tubule; CDLH, collecting duct and loop of Henle; IM, inner medulla; ISOM, inner stripe of outer medulla; OSOM, outer stripe of outer medulla; PUL, pelvic urothelial lining.
Extended Data Fig. 2
Extended Data Fig. 2. Mass spectrum of measured 13C-labeled Metabolites.
Mass spectra obtained from 13C-labeled- and control samples measured by MALDI-MSI at 5 × 5 µm2 pixel size. Graphs show presence of various 13C-labeled metabolites.
Extended Data Fig. 3
Extended Data Fig. 3. Validation of the imputation performance – ‘leave-one factor-out’ cross-validation.
a, MALDI-MSI data from a single kidney measurement, which was incubated with U-13C6-glucose for 2 h, was bisected (into sample 1 and sample 2) and used to test the accuracy of the imputation. m/z features corresponding to metabolites were taken out from sample 1. Based on these lipid profiles, metabolite abundance of sample 2 was used to impute their abundance in sample 1. b, Spearman’s correlation analysis on the imputed and detected metabolites in kidney sample 1 based on all the pixels. Dots represent different metabolites. c, UMAP analysis on integrated MALDI-MSI data of the 2 samples and resulting 29 clusters. d, Spearman’s correlation analysis on the average value of each cluster between the imputed and detected metabolites abundance in kidney sample 1. e, The ratio of the 13C enrichment calculated from detected metabolites abundance in the 29 clusters between sample 1 and sample 2. Dots represent different clusters. f, The ratio of the 13C enrichment calculated from the imputed and detected metabolites abundance in the 29 cell clusters of kidney sample 1. Dots represent different clusters. g, The ratio of the 13C enrichment calculated from the imputed metabolites abundance of sample 1 from sample 2 and detected metabolites abundance of kidney sample 2 in the 29 cell clusters. Dots represent different clusters. h, MALDI-MSI data from measurements of two different kidneys, which were incubated with U-13C6-glucose for 2 h, were used to test the performance of the imputation between different measurements. i, Spearman’s correlation analysis on the imputed and detected metabolites production based on all the pixels. Dots represent different metabolites. j, Spearman’s correlation analysis on the average value of each cluster between the imputed and detected metabolites abundance. Dots represent different metabolites. All the performance test were done on 3 different imputations from different biological independent samples. Source data
Extended Data Fig. 4
Extended Data Fig. 4. Metabolic dynamics measurements on mouse kidney.
a, Pseudo-images showing the 13C enrichment of isotopologues of different metabolites over a time course (up to 2 h) of incubation with U-13C6-glucose. Color scale representing the 13C enrichment (%). Molecular histology and immunofluorescent staining on post-MALDI-MSI tissue are shown in Fig. 3a. b, Pseudo-images showing the 13C enrichment of isotopologues of different metabolites during incubation with U-13C5-glutamine for 2 h. Color scale representing the 13C enrichment (%). c, Pseudo-images showing the 13C enrichment of Glu M + 2 isotopologues during incubation with U-13C18-linoleate for 2 h. Color scale representing the 13C enrichment (%). d-f, Graphs showing the curve of 13C enrichment of isotopologues of metabolites over a time course (up to 2 h) with incubation of U-13C6-glucose (d), U-13C5-glutamine (e) and U-13C18-linoleate (f). Average values of all pixels and values from two representative pixels are shown. Images show the average 13C enrichment (area under curve (AUC) normalized to total time) of isotopologues measured at different timepoints. All scale bars = 200 µm. Abbreviations: 3PG, 3-phosphoglycerate; G3P, glycerol 3-phosphate; α-KG, alpha-ketoglutaric acid. Source data
Extended Data Fig. 5
Extended Data Fig. 5. Lipid heterogeneity in mouse IRI kidneys.
a, Comparison of blood urea levels at different timepoints after IRI surgery (n = 3 per group). Two tailed T test was performed on AUC. b, Immunofluorescent staining (Lotus Tetragonolobus Lectin (LTL, green), E-cadherin (CDH1, red) and BS1-lectin (gray)) after MALDI-MSI measurement of mouse IRI kidney. c, UMAP analysis on integrated lipidomics data of sham (n = 3) and bIRI (n = 3) mouse kidney samples. d, Distribution of different renal cell clusters on tissue as identified in Fig. 2b. All scale bars = 500 µm. Source data
Extended Data Fig. 6
Extended Data Fig. 6. Immunofluorescence staining on mouse IRI kidneys.
a, Validation of immunofluorescence staining of LTL, VCAM1 and KIM1 on the measured area of post-MSI slice compared to consecutive slice without MALDI matrix. Scale bar = 100 µm. b, Immunofluorescence staining of LTL, VCAM1 and KIM1 on bIRI kidney, same as the image shown in Fig. 4b. Scale bar = 200 µm.
Extended Data Fig. 7
Extended Data Fig. 7. Dynamic metabolic measurements on kidney endothelial cells.
a, MECA32 staining of different vessels in mouse kidney to show specific capillary endothelial cell staining (Scale bar = 5 µm). Arrows depict the vessels with negative MECA32 staining. b, Metabolic heterogeneity within cortical cells in kidney, visualized in a two-dimensional UMAP plot of combined MALDI-MSI data and immunofluorescence staining at 5 × 5 µm2 pixel-size. Glomerular endothelial cells (gREC) and peritubular endothelial cells (cREC) were identified using the post-MALDI-MSI anti-MECA32 antibody staining and podocytes (Podo) with anti-NPHS1 antibody staining. Proximal tubules (PT), distal tubules (DT) and collecting ducts (CD) were identified based on their respective lipid profiles obtained from measurement shown in Extended Data Fig. 1b. c, Immunofluorescent (MECA32 and NPHS1, middle panel; scale bar = 40 µm) staining on post-MALDI-MSI tissue to determine gREC, cREC and podocyte distribution (left panel). Pixel colors used are similar to the given UMAP cell-cluster colors in A. Inset view of detailed glomerular area (right panels, scale bar = 5 µm). d, MECA32 expression in the observed cell types. e, Dynamic metabolic measurements using U-13C6-glucose. Graphs show the 13C enrichment of isotopologues of glucose, glycerol 3-phosphate (G3P), 3-phosphoglycerate (3PG), lactate and glutamate over time in gREC and cREC. Two tailed paired t-test was performed (n = 3). Spatial UMAP shows the metabolic cellular architecture of the tissue (arrows depict cREC and gREC). Pixel colors used are similar to the given UMAP cell-cluster colors in B. Scale bar = 200 µm. Source data
Extended Data Fig. 8
Extended Data Fig. 8. High spatial resolution MALDI-MSI measurement on cultured endothelial cell.
a, MALDI-MSI data from measurements of cultured endothelial cells, which were incubated with U-13C6-glucose for 24 h. Arrow depicts a single endothelial cell. b, Mass spectra obtained from 13C-labeled- and control samples measured by MALDI-MSI at 5 × 5 µm2 pixel size to show the presence of 13C-labeled metabolites.
Extended Data Fig. 9
Extended Data Fig. 9. Validation of MALDI-FTICR and MALDI-TOF data.
a, Comparison of the average mass spectrum of an area with 50 × 50 µm2 pixel-size (top, green) acquired by MALDI-FTICR and the average spectrum of 20 × 20 µm2 pixel-size (bottom, blue) acquired by MALDI-TOF. b, Comparison of the lipids distribution recorded by MALDI-FTICR at 50 × 50 µm2 pixel-size and MALDI-TOF at 20 × 20 µm2 pixel-size on same kidney. Scale bar = 500 µm.

Comment in

References

    1. Rappez L, et al. SpaceM reveals metabolic states of single cells. Nat. Methods. 2021;18:799–805. - PMC - PubMed
    1. Taylor MJ, Lukowski JK, Anderton CR. Spatially resolved mass spectrometry at the single cell: recent innovations in proteomics and metabolomics. J. Am. Soc. Mass Spectr. 2021;32:872–894. - PMC - PubMed
    1. Sun N, et al. Mass spectrometry imaging establishes 2 distinct metabolic phenotypes of aldosterone-producing cell clusters in primary aldosteronism. Hypertension. 2020;75:634–644. - PubMed
    1. Basu SS, et al. Rapid MALDI mass spectrometry imaging for surgical pathology. NPJ Precis. Oncol. 2019;3:17. - PMC - PubMed
    1. Abbas I, et al. Kidney lipidomics by mass spectrometry imaging: a focus on the glomerulus. Int. J. Mol. Sci. 2019;20:1623. - PMC - PubMed

Publication types