. 2022 Aug 25;12(1):14516.
doi: 10.1038/s41598-022-18680-0.

Prevention of carcinogen-induced oral cancers by polymeric black tea polyphenols via modulation of EGFR-Akt-mTOR pathway

Affiliations

Prevention of carcinogen-induced oral cancers by polymeric black tea polyphenols via modulation of EGFR-Akt-mTOR pathway

Vaishnavi K Nimbalkar et al. Sci Rep. .

Abstract

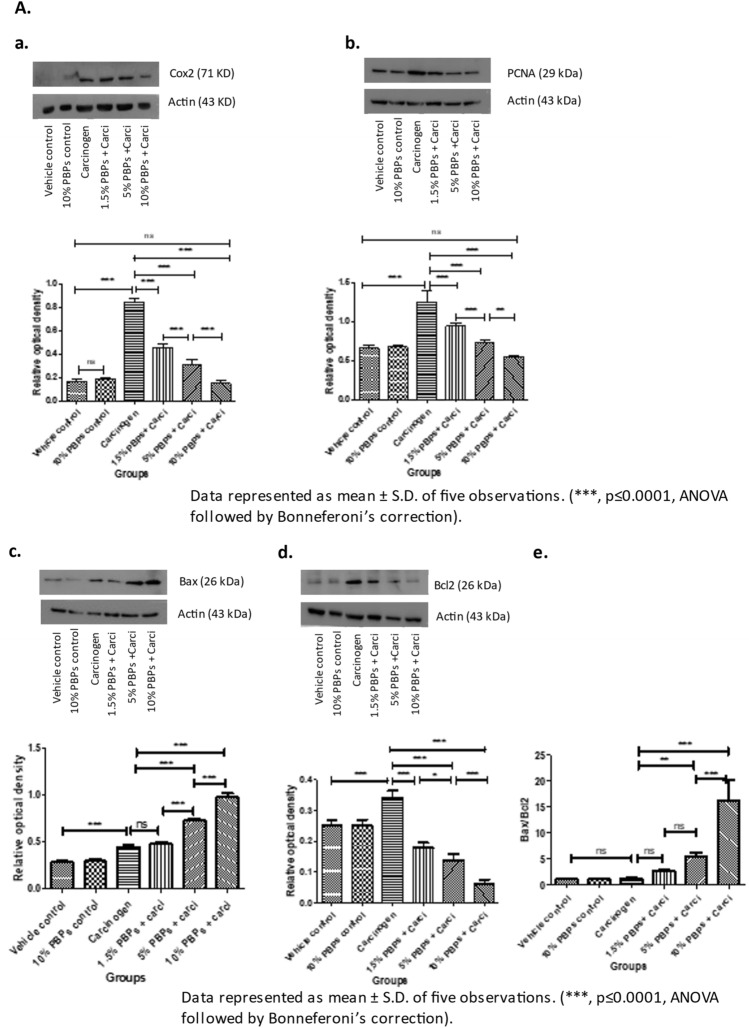
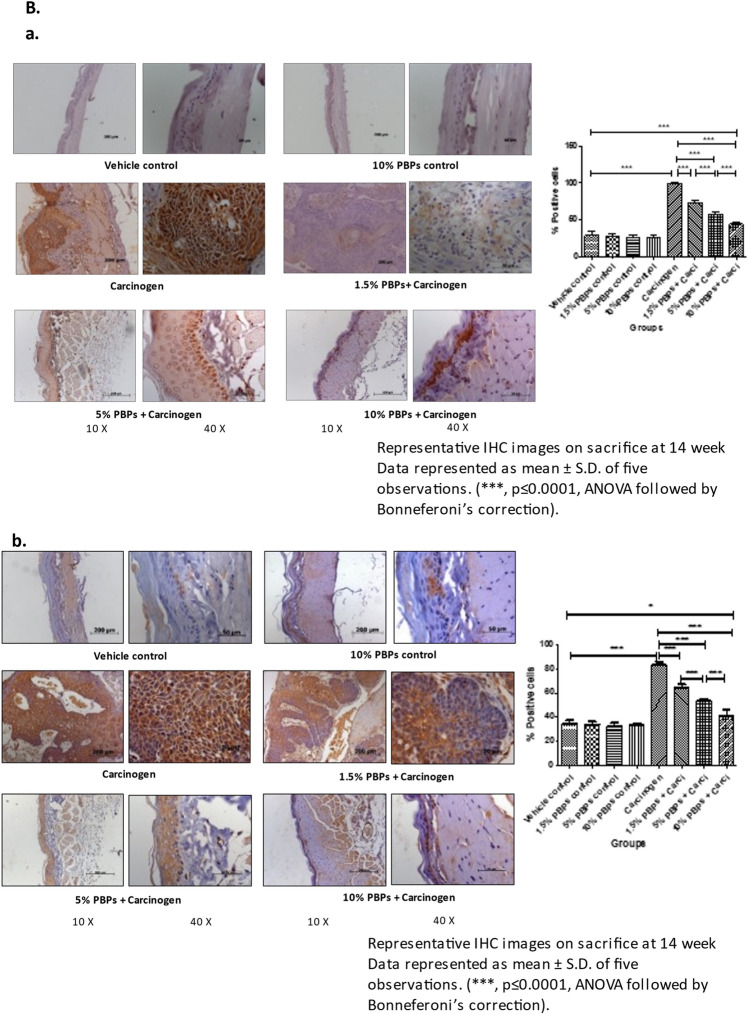
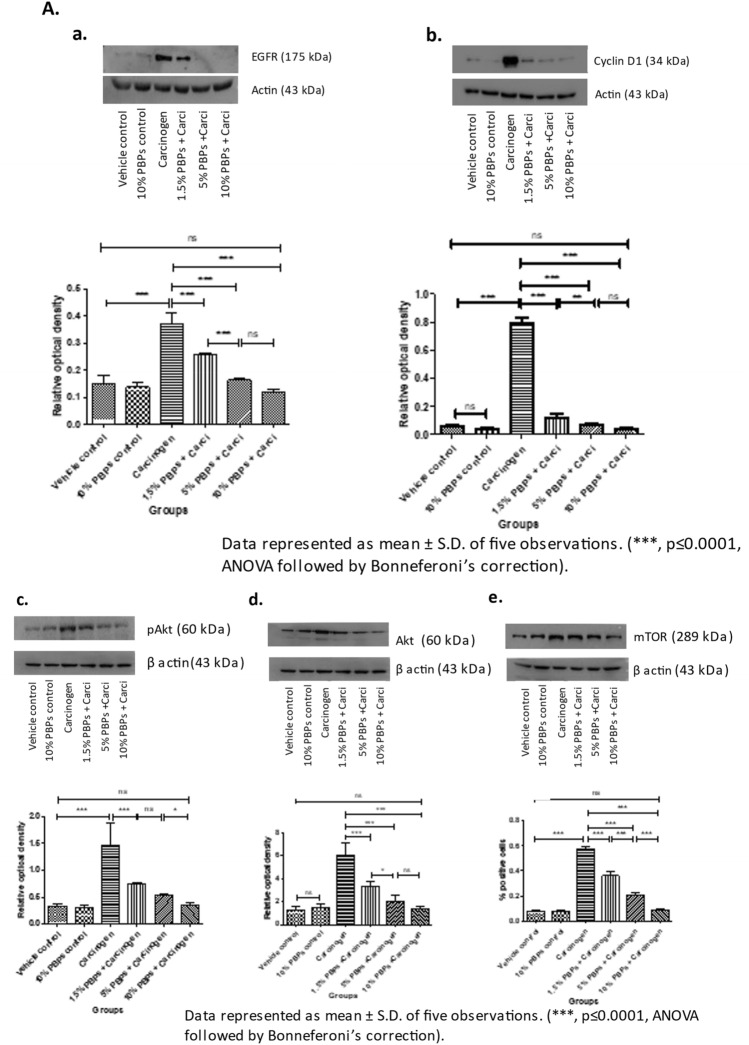
The overexpression of Epidermal Growth Factor Receptor (EGFR) and dysregulation of its downstream effector pathways are important molecular hallmarks of oral cancers. Present study investigates the chemopreventive potential of polymeric black tea polyphenols (PBPs)/thearubigins (TRs) in the hamster model of oral carcinogenesis as well as determine the effect of PBPs on EGFR and the molecular players in the EGFR pathway. In dose-dependent manner, pre and concurrent treatment with PBPs (1.5%, 5%, 10%) decreased the number and volume of macroscopic tumors as well as the number and area of microscopic lesions. Interestingly, at 10% dose of PBPs, no macroscopic or microscopic tumors were observed. We observed PBPs mediated dose-dependent decrease in oxidative DNA damage (8OHdG); inflammation (COX-2); proliferation (PCNA, Cyclin D1); expression of EGFR, and its downstream signaling kinases (pAkt, Akt, and mTOR); hypoxia (HIF1α) and angiogenesis (VEGF). There was also a PBPs mediated dose-dependent increase in apoptosis (Bax). Thus, our data clearly indicate that the observed chemopreventive potential of PBPs was due to modulation in the EGFR pathway associated with cell proliferation, hypoxia, and angiogenesis. Taken together, our results demonstrate preclinical chemopreventive efficacy of PBPs and give an insight into its mechanistic role in the chemoprevention of experimental oral cancer.


Conflict of interest statement

The authors declare no competing interests.

Figures

Figure 1
Figure 1
Experimental design for studying the effect of pre and concurrent treatment of different doses of black tea-derived PBPs extract on DMBA induced oral carcinogenesis in the hamster model. 6–8 weeks old male golden Syrian hamsters were randomised into ten groups as vehicle control (VC) PBP control (1.5% PC, 3% PC, 5% PC, 10% PC) carcinogen (C) PBP + carcinogen (1.5% P + C, 3% P + C, 5% P + C, 10% P + C) as shown in tabular format. PBP control (1.5% PC, 3% PC, 5% PC and 10% PC) and PBP + carcinogen (1.5% P + C, 3% P + C, 5% P + C, 10% P + C) group animals received 1.5%, 3%, 5%, 10% PBPs as sole source of drinking water for initial two weeks while vehicle control (VC) and carcinogen (C) group animals received plain drinking water. Further right buccal pouch of animals in carcinogen (C) and PBPs + carcinogen (1.5% P + C, 3% P + C, 5% P + C and 10% P + C) group were topically painted with 0.5% DMBA in glyceryl trioctanoate three times a week for fourteen weeks and were continued on plain drinking water and 1.5%, 3%, 5% and 10% PBPs respectively. Right buccal pouch of animals from vehicle control (VC) and PBP control (1.5% PC, 3% PC, 5% PC, 10% PC) groups were topically applied with glyceryl trioctanoate three times a week for fourteen weeks and were continued on plain drinking water and 1.5%, 3%, 5% and 10% PBPs respectively. Sacrifice was done after fourteen weeks of DMBA treatment. Entire buccal pouch was excised and evaluated for macroscopic tumor multiplicity, volume and burden. Then it was either fixed in 10% buffered formalin or snap frozen and stored at − 80 °C.
Figure 2
Figure 2
Effect of pre and concurrent treatment of different doses of PBPs on DNA damage, inflammation, proliferation, and apoptosis markers in experimental oral cancer. (A) Representative blots and relative densitometric levels of (a) Cox2, (b) PCNA, (c) Bax and (d) Bcl2. Data represented as mean ± S.D. of five observations. (***, p ≤ 0.0001, ANOVA followed by Bonneferoni’s correction). (B) Representative photomicrographs showing immunohistochemical detection of (a) 8-OHdG, (b) Cox-2 (c) PCNA and (d) Bax and (e) Bcl2. Data represented as mean ± S.D. of five observations. (***, p ≤ 0.0001, ANOVA followed by Bonneferoni’s correction).
Figure 2
Figure 2
Effect of pre and concurrent treatment of different doses of PBPs on DNA damage, inflammation, proliferation, and apoptosis markers in experimental oral cancer. (A) Representative blots and relative densitometric levels of (a) Cox2, (b) PCNA, (c) Bax and (d) Bcl2. Data represented as mean ± S.D. of five observations. (***, p ≤ 0.0001, ANOVA followed by Bonneferoni’s correction). (B) Representative photomicrographs showing immunohistochemical detection of (a) 8-OHdG, (b) Cox-2 (c) PCNA and (d) Bax and (e) Bcl2. Data represented as mean ± S.D. of five observations. (***, p ≤ 0.0001, ANOVA followed by Bonneferoni’s correction).
Figure 3
Figure 3
Effect of pre and concurrent treatment of different doses of PBPs on EGFR and its downstream targets in experimental oral cancer. (A) Representative blots and relative densitometric levels of (a) EGFR, (b) Cyclin D1, (c) Akt, (d) pAkt and (e) mTOR. Data represented as mean ± S.D. of five observations. (***, p ≤ 0.0001, ANOVA followed by Bonneferoni’s correction). (B) Representative photomicrographs showing immunohistochemical detection of EGFR. Data represented as mean ± S.D. of five observations. (***, p ≤ 0.0001, ANOVA followed by Bonneferoni’s correction).
Figure 3
Figure 3
Effect of pre and concurrent treatment of different doses of PBPs on EGFR and its downstream targets in experimental oral cancer. (A) Representative blots and relative densitometric levels of (a) EGFR, (b) Cyclin D1, (c) Akt, (d) pAkt and (e) mTOR. Data represented as mean ± S.D. of five observations. (***, p ≤ 0.0001, ANOVA followed by Bonneferoni’s correction). (B) Representative photomicrographs showing immunohistochemical detection of EGFR. Data represented as mean ± S.D. of five observations. (***, p ≤ 0.0001, ANOVA followed by Bonneferoni’s correction).
Figure 4
Figure 4
Effect of pre and concurrent treatment of different doses of PBPs on hypoxia and angiogenesis in experimental oral cancer. (A) Representative photomicrographs showing (a) HIF1-α and (b) VEGF staining. Data represented as mean ± S.D. of five observations. (***, p ≤ 0.0001, ANOVA followed by Bonneferoni’s correction). (B) Representative blots and relative levels of VEGF protein in buccal pouch total cell lysate. Data represented as mean ± S.D. of five observations. (***, p ≤ 0.0001, ANOVA followed by Bonneferoni’s correction).
Figure 4
Figure 4
Effect of pre and concurrent treatment of different doses of PBPs on hypoxia and angiogenesis in experimental oral cancer. (A) Representative photomicrographs showing (a) HIF1-α and (b) VEGF staining. Data represented as mean ± S.D. of five observations. (***, p ≤ 0.0001, ANOVA followed by Bonneferoni’s correction). (B) Representative blots and relative levels of VEGF protein in buccal pouch total cell lysate. Data represented as mean ± S.D. of five observations. (***, p ≤ 0.0001, ANOVA followed by Bonneferoni’s correction).
Figure 5
Figure 5
Schematic of the treatment plan and brief presentation of effect of PBPs on key biomarkers involved in process of oral carcinogenesis.

References

    1. Collaborators GBDCT. Spatial, temporal, and demographic patterns in prevalence of chewing tobacco use in 204 countries and territories, 1990–2019: a systematic analysis from the Global Burden of Disease Study 2019. Lancet Public Health. 2021;6:e482–e499. doi: 10.1016/S2468-2667(21)00065-7. - DOI - PMC - PubMed
    1. Collaborators GBDT. Spatial, temporal, and demographic patterns in prevalence of smoking tobacco use and attributable disease burden in 204 countries and territories, 1990–2019: a systematic analysis from the Global Burden of Disease Study 2019. Lancet. 2021;397:2337–2360. doi: 10.1016/S0140-6736(21)01169-7. - DOI - PMC - PubMed
    1. Steward WP, Brown K. Cancer chemoprevention: a rapidly evolving field. Br. J. Cancer. 2013;109:1–7. doi: 10.1038/bjc.2013.280. - DOI - PMC - PubMed
    1. Sporn MB, Suh N. Chemoprevention of cancer. Carcinogenesis. 2000;21:525–530. doi: 10.1093/carcin/21.3.525. - DOI - PubMed
    1. Nimbalkar VK, Manna S, Maru GB, Mahimkar MB. Head and neck cancer prevention by phytochemicals: Current status and challenges. Curr. Pharmacol. Rep. 2020;6:85–102. doi: 10.1007/s40495-020-00213-w. - DOI

Publication types