. 2022 Aug 25;5(1):875.
doi: 10.1038/s42003-022-03828-5.

Human alveolar progenitors generate dual lineage bronchioalveolar organoids

Affiliations

Human alveolar progenitors generate dual lineage bronchioalveolar organoids

Karen Hoffmann et al. Commun Biol. .

Abstract

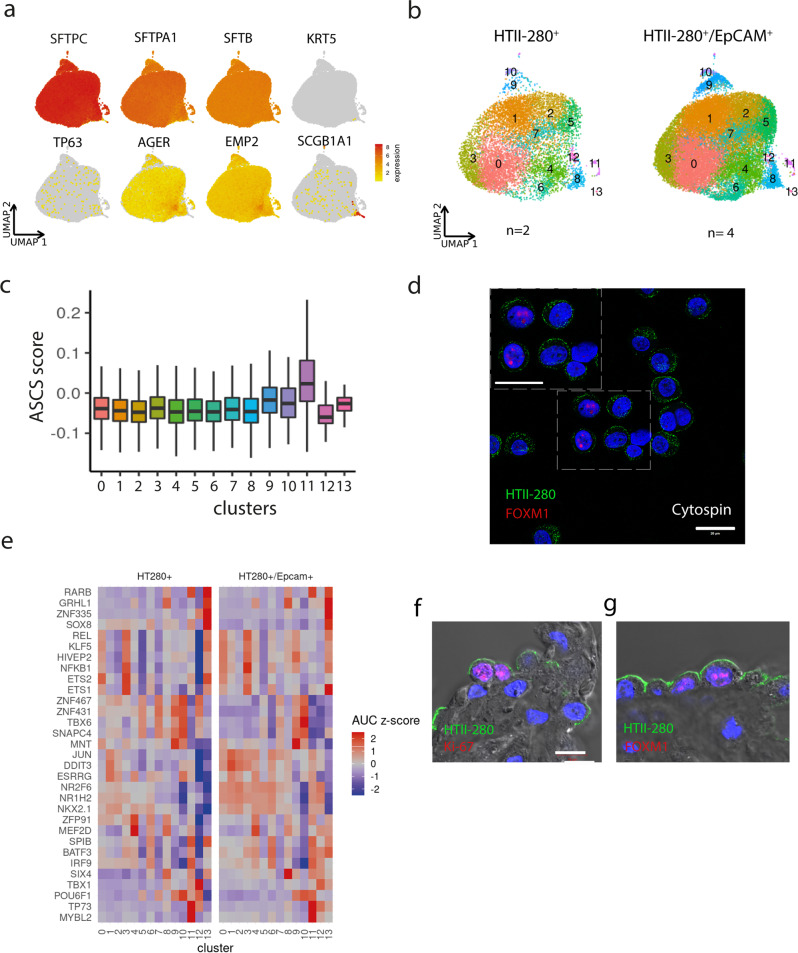
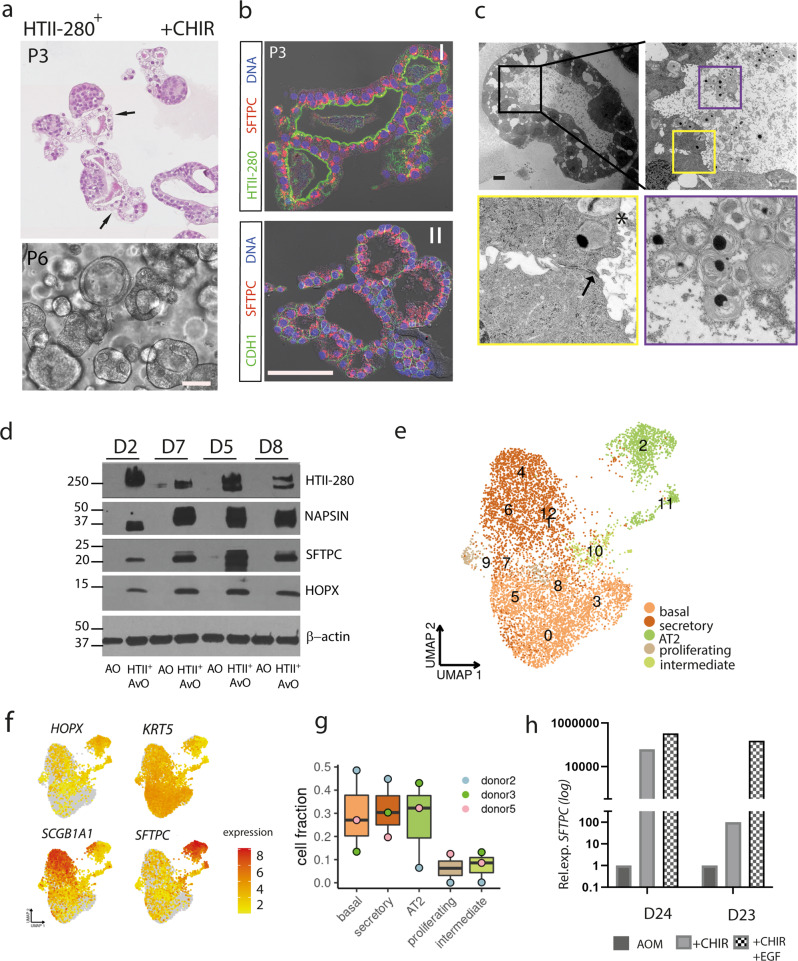
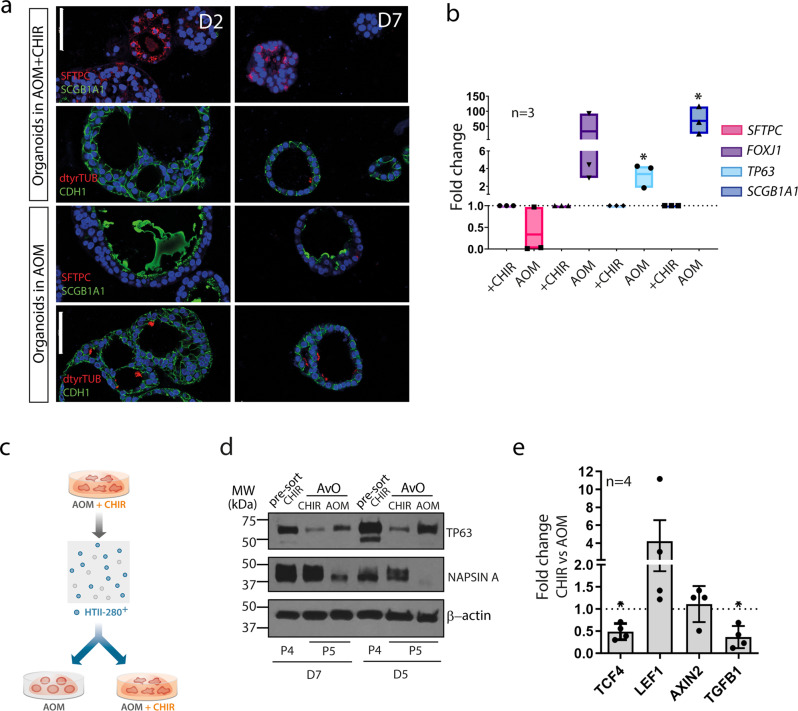
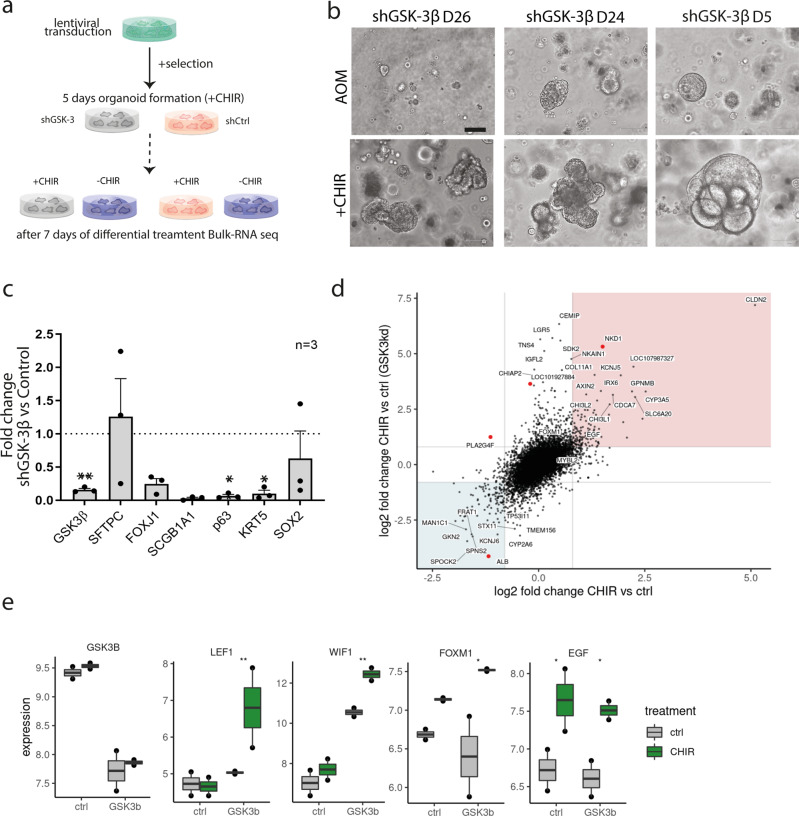
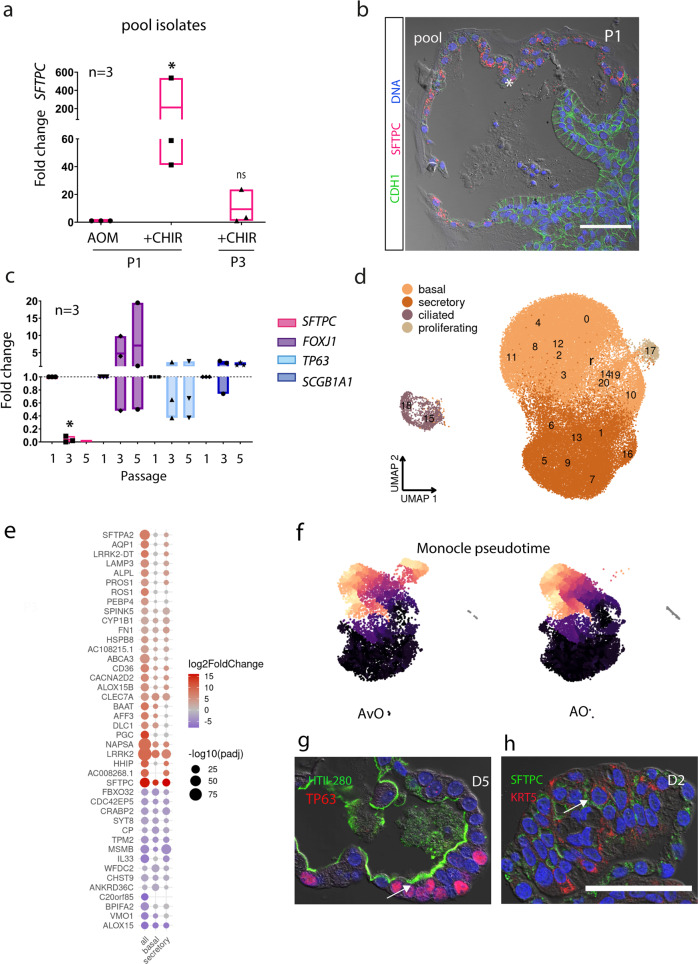
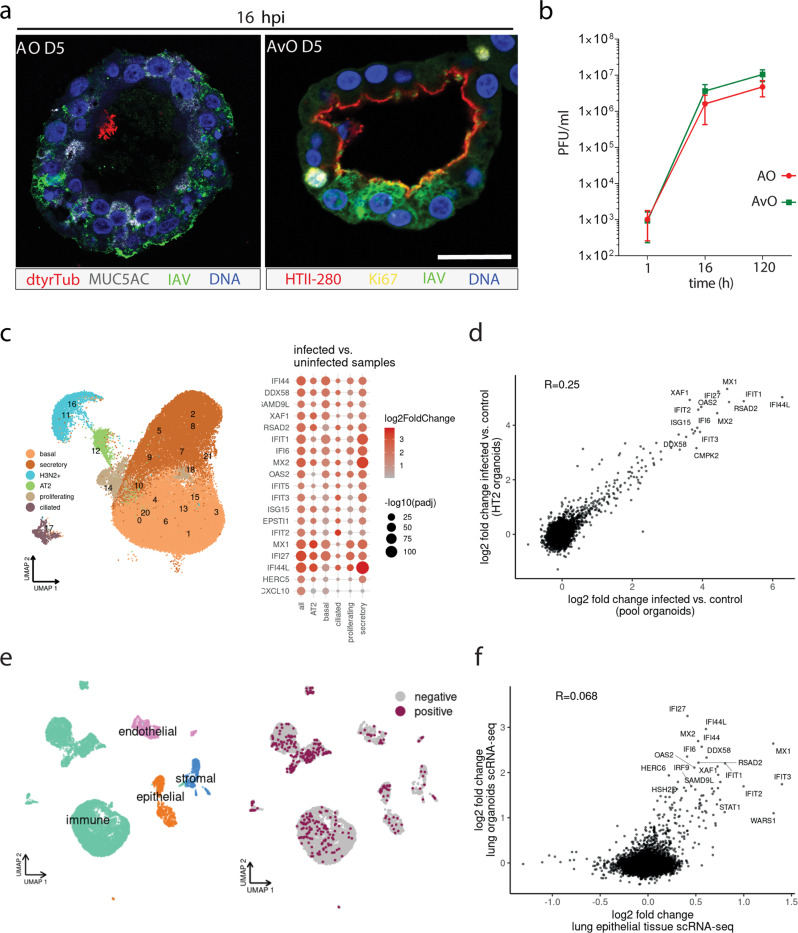
Mechanisms of epithelial renewal in the alveolar compartment remain incompletely understood. To this end, we aimed to characterize alveolar progenitors. Single-cell RNA-sequencing (scRNA-seq) analysis of the HTII-280+/EpCAM+ population from adult human lung revealed subclusters enriched for adult stem cell signature (ASCS) genes. We found that alveolar progenitors in organoid culture in vitro show phenotypic lineage plasticity as they can yield alveolar or bronchial cell-type progeny. The direction of the differentiation is dependent on the presence of the GSK-3β inhibitor, CHIR99021. By RNA-seq profiling of GSK-3β knockdown organoids we identified additional candidate target genes of the inhibitor, among others FOXM1 and EGF. This gives evidence of Wnt pathway independent regulatory mechanisms of alveolar specification. Following influenza A virus (IAV) infection organoids showed a similar response as lung tissue explants which confirms their suitability for studies of sequelae of pathogen-host interaction.


Conflict of interest statement

The authors declare no competing interests.

Figures

Fig. 1
Fig. 1. HTII-280+ lung compartment contains distinct progenitor subpopulations.
a scRNA-seq of isolated HTII-280+ cells shows that AT2 pneumocyte markers are ubiquitously expressed in contrast to bronchial lineage markers (n = 6 donors, 33375 cells). b Unsupervised clustering of HTII-280+ and EpCAM+/ HTII-280+-derived scRNA-seq data c Gene signature scores for adult stem cell signature (ASCS). d Confocal image after cytospin of HTII-280+ cells showing FOXM1 nuclear staining. Scale bar:20 µm. e SCENIC results of transcription factor regulons. f Confocal image representative of stainings from two different donor lungs showing proliferating AT2 cells (HTII-280 green, Ki67 red). g AT2 cells expressing FOXM1 transcription factor (HTII-280 green, FOXM1 red). Nuclei are counterstained with DAPI, and tissue is visualized by DIC. Scale bar: 20 µm.
Fig. 2
Fig. 2. HTII-280+ progenitors from adult human lung generate in vitro organoids.
a Experimental layout of the progenitor isolation and generation of HTII-280+-derived organoid lines. b Summary of clinical data for donor lung tissue processed to generate organoid lines. LTC- long-term culture, n.a.—not available. c HTII-280+ cells give rise to organoids in AOM and AOM+CHIR medium, while HTII-280- epithelial progenitors have higher organoid forming efficiency in the AOM medium. Also, non-sorted pool isolates show robust growth in AOM medium. d Quantification of organoid forming efficiency of HTII-280+ progenitors in AOM + CHIR and AOM medium. n = 5 and n = 3, respectively, where n are independent donor samples. Data represent mean +/–SEM. *p = 0.02 calculated by a two-tailed student t-test. e HTII-280-/EpCAM+ progenitors grow better in AOM medium compared to HTII-280+/EpCAM+ cells. The image is representative of three independent sort experiments. Scale bar: 100 µm.
Fig. 3
Fig. 3. HTII-280+-derived organoids maintain a stable AT2 phenotype in CHIR medium.
a HE staining and phase-contrast images showing the morphology of HTII-280+-derived organoids in CHIR medium. Scale bar: 100 µm. b Representative confocal images showing expression of the pneumocyte marker SFTPC (I, red) and maintained apical polarity (II, HTII-280, green,) in the long-term organoid culture (P3, ~3 months). Scale bar: 50 µm. c Representative transmission electron microscopy (TEM) images revealing fully formed junctions (arrow) and prominent microvilli (asterisk) of AT2 cells (yellow square). Abundantly secreted vesicles with lamellar membrane structures are present in the organoid lumen (violet square). Scale bars: 2.5 µm, 1 µm, 100 nm. d Protein levels of AT2 markers (SFTPC, NAPSIN A, HTII-280, and HOPX) in HTII-280+-derived alveolar organoids (AvO) compared to airway organoids (AO) of the same donor reveal sustained levels in all four lines, while no signal was detected in controls. e scRNA-seq analysis of alveolar organoids identifies clusters of AT2 cells, but also intermediate and airway cell types (secretory and basal cells) (n = 3 donors, 7784 cells). f Expression of HOPX, SFTPC, KRT5, and SCGB1A1 in the clusters derived from scRNA-seq of alveolar organoids. g Fractions of all identified cell types within the HTII-280+-derived organoids. h Relative expression level of SFTPC in HTII-280+-derived alveolar organoids treated with CHIR or CHIR+EGF relative to pool organoids grown in AOM for two different donors.
Fig. 4
Fig. 4. The differentiation route of HTII-280+ progenitors depends on the signaling environment.
a Comparative images from two different donor lines of HTII-280+-derived organoids grown in AOM reveal a shift in differentiation towards a higher expression of bronchial markers (SCGB1A1, dtyrTub), while SFTPC is only expressed in presence of the inhibitor (right image). Scale bar: 20 µm. b qPCR confirms a medium-dependent shift in phenotype. Data are represented as floating bars, min to max, with a line at mean. n = 3 independent donor lines.*p = 0.038 for TP63 and *p = 0.012 for SCGB1A1 calculated by Student´s t-test. c Layout of the resorting experiment. d Western blot of protein lysates showing medium-dependent regulation of the expression of bronchial (TP63) and alveolar marker (NAPSIN A) in newly formed organoids. Data represent two different alveolar donor lines in the stable expansion (P4) and corresponding resorted organoids. e Fold-change in mRNA expression level of Wnt target genes TCF4, LEF1 and AXIN2, as well as TGFB1 in HTII-280+-derived organoids under CHIR treatment. n = 4, where n represents independent donor lines. Data is presented as mean +/– SD *p = 0.027 for TCF4, and *p = 0.049 for TGFB1 calculated by two-tailed Student t-test.
Fig. 5
Fig. 5. CHIR 99021 is required for alveolar organoids formation and differentiation.
a Experimental outline of GSK-3β knockdown in alveolar organoids. b shGSK-3β progenitors do not have organoid forming potential in medium without CHIR99021, as shown on representative images from three independent biological replicates. Scale bar: 100 µm. c Relative quantification of gene expression in shGSK-3β and control organoids reveals a strong reduction in expression of bronchial markers in presence of CHIR, while the SFTPC level remains not significantly altered. n = 3 of 3 independent pairs of donor lines (shControl and shGSK-3β). Data are presented as mean +/− SD. **p = 0.006 for GSK3β, *p = 0.011 for TP63, *p = 0.037 for KRT5, calculated by two-tailed Students t-test. d Scatter plot of gene expression changes due to CHIR treatment in shGSK-3β and mock (non-mammalian shRNA) background derived from bulk RNA-seq data of two different donor organoid cultures. Genes with significant differences in the transcriptomic responses (adj. p-value < 0.05) are highlighted in red. Red and blue areas denote concordant responses with log2 fold-change > 0.8. e Normalized expression values of specific genes (GSK3B, Wnt targets LEF1 and WIF1, FOXM1, EGF) in both genetic backgrounds (ctrl and GSK3b) +/− CHIR treatment (ctrl and CHIR). ***p < 0.001, **p < 0.01, *p < 0.05 (DESeq2 Wald test).
Fig. 6
Fig. 6. Airway progenitors cannot be primed by CHIR treatment to the alveolar lineage.
a Cultivation of organoids in the CHIR medium triggers a transient spike in SFTPC expression. n = 3 where n are independent pool organoid cultures. Data are presented as floating bars, max to min, with a line at mean *p = 0.028 for condition AOM+CHIR, calculated by a two-tailed Student’s t-test. b Immunofluorescence image of passage 1 (P1) of a lung organoid showing a large domain of SFTPC (asterisk, red) expressing cuboidal epithelium next to columnar airway epithelium (arrow, CDH1, green). Nuclei are counterstained with DAPI (blue) and tissue structure is visualized by differential interference contrast (DIC). Scale bar: 50 µm. c qPCR shows a drop in SFTPC expression during passaging (P1, P3, P5) of AO, while airway markers FOXJ1, TP63, and SCGB1A1 remain stable. n = 3, where n are independent donor lines. *p = 0.043 for SFTPC, by two-tailed Student’s t-test. d Unsupervised clustering results (numbers) and broad classification (colors) in lung organoid scRNA-seq data (n = 5 donors, 63,826 cells). e Direct comparison of gene expression between HTII-280+-derived organoids and pool airway organoids showed upregulation of alveolar hallmark genes in all cell types. f Monocle 3 “pseudotime” analysis of HTII-280+-derived alveolar organoids and pool airway organoids showing differentiation path (dark dots representing progenitors and brighter colors more differentiated cells). g Immunofluorescence stainings of alveolar (AvO) organoids showing HTII-280+ cells co-expressing airway marker TP63 (arrow) and in h SFTPC+/KRT5+ cells (arrow). Confocal images are representative of staining from three different donor lines of AvO organoids. Nuclei are counterstained with DAPI, and tissue is visualized by DIC. Scale bar: 50 µm.
Fig. 7
Fig. 7. IAV infection of the organoids mimics lung tissue response.
a Confocal images of IAV-infected airway organoids (AO) (IAV, green, MUC5AC, gray, dtyrTub, red), and alveolar organoids (AvO) (HTII-280, red, Ki67, yellow). Scale bar: 20 µm. b Virus titers of the organoid infection in paired organoid lines over a 5-day time course reveal robust and sustained replication. Data represents n = 3 of paired organoid lines from different donors. Error bars (+/− SEM) are calculated from the number of plaque-forming units in the MDCK monolayer. The difference in replication between organoid types was determined to be non-significant. c scRNA-seq reveals IAV-dependent shift in cell type classification and appearance of an infected cluster (n = 3 donors, 53090 cells) (left). Differential gene expression analysis between infected samples and non-infected controls reveals a broad interferon response across all cell types (right). d Correlation of the antiviral response between bronchial and alveolar organoids. e Single-cell sequencing results of identified cell types from human lung tissue explants and distribution of IAV infection (n = 2 donors, 12368 cells). f Correlation of antiviral response between organoids and lung tissue epithelium.

References

    1. Kim J, Koo BK, Knoblich JA. Human organoids: model systems for human biology and medicine. Nat. Rev. Mol. Cell Biol. 2020;21:571–584. doi: 10.1038/s41580-020-0259-3. - DOI - PMC - PubMed
    1. Sato T, et al. Long-term expansion of epithelial organoids from human colon, adenoma, adenocarcinoma, and Barrett's epithelium. Gastroenterology. 2011;141:1762–1772. doi: 10.1053/j.gastro.2011.07.050. - DOI - PubMed
    1. Broutier L, et al. Culture and establishment of self-renewing human and mouse adult liver and pancreas 3D organoids and their genetic manipulation. Nat. Protoc. 2016;11:1724–1743. doi: 10.1038/nprot.2016.097. - DOI - PubMed
    1. Kessler M, et al. The Notch and Wnt pathways regulate stemness and differentiation in human fallopian tube organoids. Nat. Commun. 2015;6:8989. doi: 10.1038/ncomms9989. - DOI - PMC - PubMed
    1. Karthaus WR, et al. Identification of multipotent luminal progenitor cells in human prostate organoid cultures. Cell. 2014;159:163–175. doi: 10.1016/j.cell.2014.08.017. - DOI - PMC - PubMed

Publication types

Substances