. 2022 Sep;21(9):1019-1023.
doi: 10.1038/s41563-022-01288-0. Epub 2022 Aug 25.

Weak catch bonds make strong networks

Affiliations

Weak catch bonds make strong networks

Yuval Mulla et al. Nat Mater. 2022 Sep.

Abstract

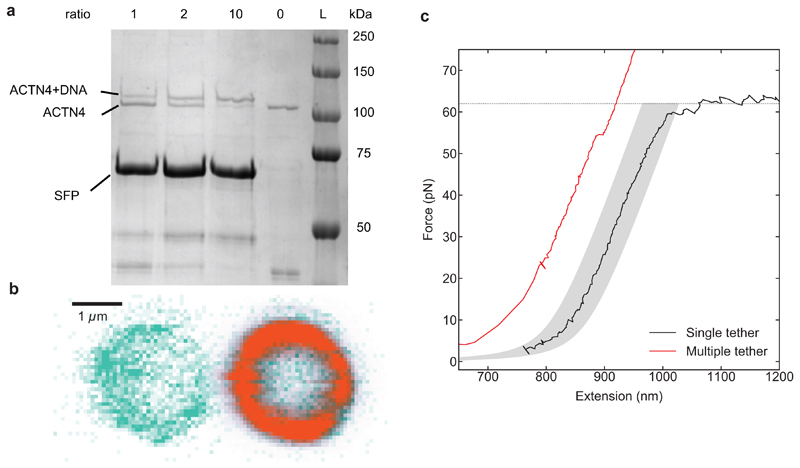
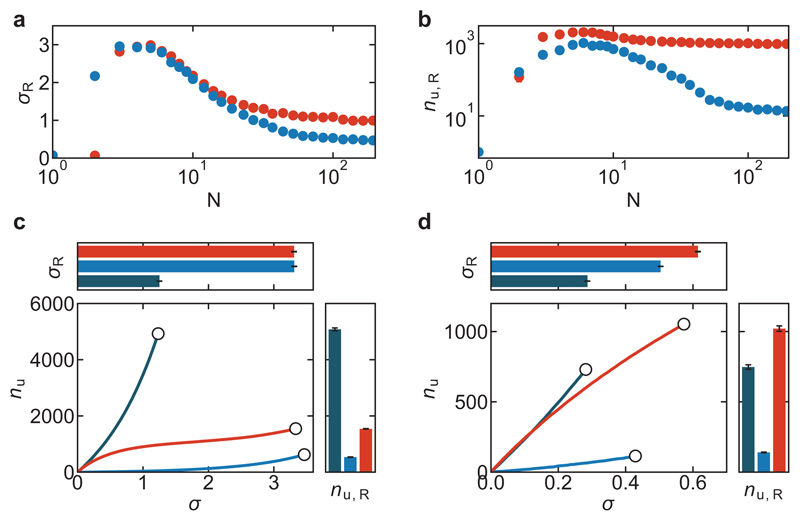
Molecular catch bonds are ubiquitous in biology and essential for processes like leucocyte extravasion1 and cellular mechanosensing2. Unlike normal (slip) bonds, catch bonds strengthen under tension. The current paradigm is that this feature provides 'strength on demand3', thus enabling cells to increase rigidity under stress1,4-6. However, catch bonds are often weaker than slip bonds because they have cryptic binding sites that are usually buried7,8. Here we show that catch bonds render reconstituted cytoskeletal actin networks stronger than slip bonds, even though the individual bonds are weaker. Simulations show that slip bonds remain trapped in stress-free areas, whereas weak binding allows catch bonds to mitigate crack initiation by moving to high-tension areas. This 'dissociation on demand' explains how cells combine mechanical strength with the adaptability required for shape change, and is relevant to diseases where catch bonding is compromised7,9, including focal segmental glomerulosclerosis10 caused by the α-actinin-4 mutant studied here. We surmise that catch bonds are the key to create life-like materials.


Conflict of interest statement

Competing interests: The authors declare no competing interests.

Figures

Extended Data Figure 1
Extended Data Figure 1. High-speed co-sedimentation measurements of the affinity of α-actinin-4 (WT) and K255E crosslinkers for actin filaments.
a, b, supernatant resulting from a high-speed centrifugation of a mixture of actin filaments and crosslinkers was run on an SDS-page gel. The bands on the bottom show the α-actinin-4 (WT) or K255E (resp. a and b, molecular weight ~ 100 kDa in both cases), while the bands on the top show actin (42 kDa). Each labeled column contained a different actin concentration as indicated. Some lanes were kept empty as spacers. The crosslinker concentration was fixed at 0.1 μM. A single measurement was performed per condition. c, The fraction of bound crosslinkers, as determined from the co-sedimentation assay, as a function of the actin concentration was fit to the equation: φbound=cactinKa, where Ka is the affinity of the crosslinker. d, Consistent with the high affinity of both crosslinkers, SDS-page gels of supernatant resulting from a high-speed centrifugation of a crosslinked actin network at the concentration used in all our experiments (48 μM actin together with 0.48 μM crosslinker) does not show any measurable fraction of unbound crosslinkers. A single measurement was performed per condition.
Extended Data Figure 2
Extended Data Figure 2. Fluorescence recovery after photobleaching measurements reveal that α-actinin-4 crosslinkers are more dynamic than the K255E mutant.
Example fluorescence recovery curves of α-actinin-4 (a) and K255E (b) in the presence of 48 μM actin show full recovery of both proteins after photobleaching at time t=0, but with different timescales. The solid lines represent exponential fits to the data (see Supplementary Methods). c, Average recovery time for α-actinin-4 (red) and for K255E (blue), with the standard error on basis of 5 measurements of different locations within the same sample per condition. Measurements were performed at 25 °C.
Extended Data Figure 3
Extended Data Figure 3. Generation and classification of α-actinin-4/actin tethers.
a, DNA was coupled to α-actinin-4 (WT or K255E) using an SFP synthase-mediated reaction. Because α-actinin-4 is a homodimer, the yBBr tag used for coupling is present in both monomers. To favour DNA attachment to only one monomer, we performed coupling reactions with several DNA titrations, and the coupling yields were quantified using SDS-PAGE gel electrophoresis. The DNA:α-actinin-4 molar ratios are indicated above each lane. At a molar ratio of 1:1, most of the α-actinin-4 is uncoupled, i.e. most dimers will be either not coupled or have only one monomer coupled to DNA. A single measurement was performed per condition. b, Concurrent confocal fluorescence images of a trapped bead coated with α-actinin-4 (left) and a trapped bead coated with actin filaments (right). The bead’s autofluorescence is depicted in green, and the fluorescent emission of Alexa Fluor 647-tagged actin is depicted in orange. In total, 36 images have been taken of 4 independent samples. This image shows representative examples. c, Force-extension curves showing the overstretching regime of a single dsDNA tether (black), and a case where the two beads are linked by multiple tethers, which yields a shorter contour length and higher forces without unzipping (red). Variability in bead radii and actin layer thickness results in force-extension curves that can be shifted along the Extension axis, from the theoretical 850 nm by ±30 nm. Grey area: ”single-tether region”. Tethers with a force-extension curve within this area that broke in a single step were regarded as single tethers and hence included in measuring the force-dependent lifetime.
Extended Data Figure 4
Extended Data Figure 4. Nonlinear and temperature-dependent rheology of actin networks crosslinked by α-actinin-4 or K255E.
Rheological measurements of wild type (red) and K255E mutant (light blue) α-actinin-4 crosslinking actin networks at 10 °Cand of K255E mutant crosslinked actin networks at 25 °C(dark blue). a-c, The storage (triangles) and loss moduli (circles) were measured using small amplitude oscillatory shear. The moduli are shown as a function of frequency (a) and as a function of the frequency normalized by the frequency at which the loss modulus peaks (b). Both curves are measured at 10 °C. Data are presented as mean values +/- the standard error indicated by bars and shaded regions on basis of 4 independent samples per condition. The collapses in b and c show that the crosslinker unbinding kinetics, but not the network structure, is significantly different for the different conditions (see Main Text). d, The stress relaxation frequency was extracted from Extended Data Figure 4a,c using Supplementary Methods Eq. 4-7. Data are presented as mean values +/- the standard error on basis of 4 independent samples per condition. e, Representative example curves of the differential storage modulus at 0.5 Hz (top) and of the strain rate (bottom) are plotted against the applied shear stress. We define the rupture strain as the data point where K' peaks. f-g, We apply a semiflexible polymer network model to fit the frequency-dependent differential elastic modulus as a function of prestress (see Supplementary Methods). h, Thus, we extract the crosslinker bound lifetime as a function of stress for both α-actinin-4 (red) and the K255E mutant (blue) at 25 °C. The shaded areas represent the error on basis of the fits. The bound lifetime of the mutant is significantly longer at low stress, but the lifetimes of both types become similar at high stress as the bound lifetime of the wild type increases. The abrupt decay of bound lifetime in the K255E-crosslinked network when the stress reaches 5 Pa is due to network fracturing. i, the fitted K’ shows quantitative agreement with the measured K’ for both catch and slip bonds.
Extended Data Figure 5
Extended Data Figure 5. Fracturing in the minimal 1D crosslinker model.
a, Time trace of the bound number of catch bonds (red) and slip bonds (blue) in a network undergoing a linearly increasing stress (see Supplementary Table 1 for parameters). As the catch bonds have faster dynamics than the slip bonds, a larger spread in the bound fraction is observed. After a long time of steady state fluctuations, the networks suddenly fracture as the number of linkers rapidly goes to 0. b, c, Kymographs showing at which positions there are bonds (red for catch bonds, blue for slip bonds) or no bonds (white). At steady state, linkers continuously bind and unbind (-1000 to approximately -300 steps). Cracks can spontaneously initiate and propagate through the network (the last ~300 steps of the simulation) for both catch and slip bonds in a similar manner. d, The fraction of 1D-networks that rupture when a gap of varying ablation length lablate is introduced for both catch (red) and slip bonds (blue). Inset: schematic of the ablation simulation.
Extended Data Figure 6
Extended Data Figure 6. Simulations show that catch bonds only provide a mechanical advantage over slip bonds when they are mobile and present in sufficiently large numbers.
The system size dependence of the rupture stress (a) and bond turnover at the point of rupture (b) reveals that catch bonds (red) are only stronger than slip bonds (blue) for networks larger than ~10 bonds, emphasizing that the increased network strength by catch bonding is an emergent property (Supplementary Note 1). Each data point is the average of 10 repeats and the standard errors are smaller than the symbol size. c, Catch bond-induced network strengthening is not observed when crosslinkers are immobile and rebind in the same location from which they unbound. The bond turnover as a function of stress reveals catch bonds (red) cause more dynamic materials (right), but do not enhance strength (top) compared to strong slip bonds (light blue) and are less dynamic than networks consisting of weak slip bonds (dark blue). Data are presented as mean values +/- the standard error on basis of 100 independent simulation runs per condition. d, We also considered a three-state model where linkers are doubly bound, singly bound or unbound (Supplementary Note 1). Similar to the two-state model, the bond turnover as a function of stress reveals that networks of catch bonds (red) are stronger and more deformable than networks of strong slip bonds (light blue) or weak slip bonds (dark blue). Data are presented as mean values +/- the standard error on basis of 5 independent simulation runs per condition.
Extended Data Figure 7
Extended Data Figure 7. Catch bonding is only effective when the bond lifetime is high.
a, Simulations of the rupture stress as a function of the bond lifetime kon/koff,0slip,, keeping koff,0slip/koff,0catch, fixed (see Supplementary Methods and Supplementary Table 1), shows that catch bonds (red) are only stronger than slip bonds (blue) when the binding rate is high. b, Consistent with the simulations, enhancing the bond lifetime in experiments by decreasing the temperature from 25 °C(light) to 10 °C(dark) increases the rupture stress more steeply for wild type α-actinin-4 (red) than for K255E (blue). The error bars represent the standard error (N=4 independent samples for each condition).
Extended Data Figure 8
Extended Data Figure 8. Actin network simulations.
a, Stress-strain curve of the simulated catch (red) and slip bond (blue) actin networks. The black circles indicate the yielding points of both networks (see Supplementary Methods). b, Distribution of tension on actin filaments in networks for simulated catch bond (red) and slip bond (blue) with 10 Pa stress. c, The polymer network simulation predicts that the average number of active crosslinkers per filament at 10 Pa is lower for catch bonds than for slip bonds, in line with the 1D simulations (panel a) and the catch bond’s lower bond lifetime. d, The average number of crosslinkers as a function of the filament tension shows that slip bonds are mainly enriched on low-tension filaments. The tension on the x-axis is binned such that each bin contains 10% of the filaments. e-f, Similar plots as Fig. 3d but then for the catch (d, red) and slip bond (e, blue) simulations separately: the active crosslinkers are binned according to tension acting on pairs of filaments (tension on filament 1 on x-axis, tension on filament 2 on y-axis) connected by the crosslinkers. 10x10 bins are used, and the distribution was smoothed using bicubic interpolation. The tension spacing along the x- and y-axis is non-uniform, such that each bin includes 10% of the filaments. These plots show that both catch and slip bonds preferentially connect tense filaments, likely because of geometrical reasons and/or because filament tension resulted from having more crosslinkers bound. However, catch bonds localize more strongly to tense filaments than slip bonds (Fig. 3d) because they bind less to the rest of the network due to their higher off-rate in the absence of force and therefore redistribute to the tense filaments (Fig. 3e).
Extended Data Figure 9
Extended Data Figure 9. Confocal fluorescence images of crosslinked actin networks.
10% of the actin monomers were labeled with Alexafluor-647. At a 1:100 crosslinker:actin molar ratio, the actin networks studied in this work are isotropic and spatially uniform, for both wild type (a) and K255E α-actinin-4 (b). We do not observe any discernable structure because the mesh size is ~200 nm, which is on the order of the diffraction limit, indicating that filaments are isotropically crosslinked rather than bundled. c, For comparison, actin bundle clusters were observed at a 1:25 α-actinin-4:actin molar ratio. The color coding was inverted for all images to improve the visual contrast between bundles and background. Scale bars are 20 μm. 10 images were taken of different locations within the same sample per condition and all images had similar results per condition.
Extended Data Figure 10
Extended Data Figure 10. Fracturing occurs within the actin network, not at the rheometer-network interface.
The rheology of wild type α-actinin-crosslinked actin networks was compared in the presence (dark green) or absence (light green) of a Polylysine-coated surface on both the bottom and top plate of the rheometer (see Supplementary Methods). a) a frequency sweep at zero prestress shows that the linear rheology is unaffected by changing the rheometer-network interface. The storage (triangles) and loss moduli (circles) were measured as a function of frequency using small amplitude oscillatory shear. b) the network rupture strain and c) rupture stress (bottom) are not significantly affected by the addition of Polylysine at the rheometer-network interface. The error bars representing the standard error (N=4 independent samples for each condition).
Figure 1
Figure 1. Single-molecule measurements of actin filament binding reveal catch bonding for wild type α-actinin-4 but not the K255E mutant.
a, Each monomer of the dimeric crosslinker α-actinin-4 (red) has two weak binding sites for actin filaments (green) and one strong binding site (white) that needs to be activated by force for the wild type (WT) protein (red), whereas it is always exposed for the K255E mutant (blue). The force-induced shape transition is exaggerated for clarity. b, The lifetime of a catch bond first rises and then decreases with increasing force, while a constitutively active variant that acts as a regular slip bond shows a decreasing lifetime. The schematic shows a simplified limit, in which the catch and slip bond lifetimes become equal at high force. c, Single-molecule force spectroscopy assay, where a crosslinker-coated and an actin-coated bead are trapped using optical tweezers. d, Example trace illustrating the approach-and-retract protocol to establish bonds between the crosslinkers and actin filaments (top panel). An increase in the force while retracting indicates the presence of a tether (green), and the lifetime is measured until the instant the tether breaks (ti, tj, bottom panel). e, Actin association affinity ka of α-actinin-4 (red) and K255E (blue) measured in a co-sedimentation assay. Data are presented as mean values +/- the standard error extracted from fitting the fraction of bound crosslinkers at 6 independent samples with different actin concentrations assuming Michaelis-Menten kinetics (Extended Data Figure 1a-c). f, Average lifetime of tethers as a function of applied force, as measured by optical tweezers (see panel d). The lifetime of wild type α-actinin-4 (red) initially rises, peaks at a force of ~4 pN, and then decreases, as expected for a catch bond. The K255E mutant shows an overall decreasing lifetime, typical of a slip bond. Data are presented as mean values +/- the standard error. Numbers of data points per bin in Figure 1f are: 14, 13, 12, 18, 6, 4, 4 for WT, and 3, 9, 9, 10, 13, 13, 10, 7 for the K255E mutant. Affinity and force spectroscopy data were obtained at 25 °C.
Figure 2
Figure 2. Catch bonds simultaneously enhance the mechanical strength and the deformability of cytoskeletal actin networks.
a, Scheme of rheology experiments to characterize actin network mechanics. We measure the shear deformation γ of actin networks crosslinked either with α-actinin-4 or with K255E by linearly increasing the shear stress σ in time with a stress rate of 2.0 mPa/s. b, Representative examples of the shear strain γ as function of the shear stress σ for α-actinin-4 (red), K255E (blue), both at 10 °C, and for K255E at an elevated temperature (25°C, dark blue) where its lifetime matches that of wild type α-actinin-4 at 10°C (Extended Data Figure 4c-d). The white circles indicate the rupture points (see Supplementary Methods). The top panel shows the average rupture stress and the right panel the average rupture strain for each condition. Data are presented as mean values +/- the standard error (N=4 independent samples for each condition). c, Actin networks are modelled as 1D arrays of reversible linkers that stochastically exchange between a bound and freely diffusing state. The applied load (σ) linearly increases in time and is shared over all bound linkers proportionally to the distance to the nearest neighbors li. d, The total number of unbinding events per bond nu as a function of applied stress (see Supplementary Methods), showing the same crosslinker dependence as the rheology experiments. The Data in the top and right panel are presented as mean values +/- the standard error (N=100 independent simulations for each condition).
Figure 3
Figure 3. Minimal model suggest that catch bonds strengthen networks by redistributing to tense areas.
a, The distribution of forces per bond f measured at steady state in 1D simulations. The average bond force (vertical lines, 0.241 ± 0.003 and 0.223 ± 0.001, mean ± standard error) is larger for catch bonds (red) than for slip bonds (blue), but the force distribution of the former is much narrower: bonds carrying normalized forces higher than 1 are more than two orders of magnitude more likely for slip than for catch bonds. b, Self-assembly mechanism explaining the mechanical advantage of weak catch bonds (red, left) over strong slip bonds (blue, right). The thickness of the colored arrows codes for the on- and off-rate of the linkers. 1. Catch bond linkers in low tension areas rapidly unbind, increasing the pool of unbound linkers (2). As a result, there is increased binding everywhere in the network (3), at the expense of only the linkers in low tension areas. The net result is that the force distribution homogenizes, preventing crack initiation. By contrast, slip bonds preferentially localize in low-stress areas.
Figure 4
Figure 4. Detailed actin network simulations confirm catch bond network strengthening via dissociation-on-demand
a, Schematic of actin network simulations. Actin filaments (F-actins, cyan) are simplified into serially connected cylindrical segments. Crosslinkers are simplified into two arm segments connected by elastic hinges. Yellow: crosslinkers binding to two F-actins to form a functional crosslink. Red: inactive crosslinkers bound to one F-actin. Bending (κb) and extensional (κs) stiffnesses govern the mechanical behaviors of these segments (see Supplementary Table 2). b, Schematic showing how the network (30×30×1 μm) is deformed by linearly increasing shear strain by fixing the bottom of the network and displacing the top in the +x direction. c, Ratio of catch and slip-bond crosslinkers in color as a function of the tension in the two filaments they connect, derived from two simulations at 10 Pa stress (one with catch bonds and one with slip bonds). Color scale: percentage relative enrichment of catch bonds over slip bonds bound between a pair of actin filaments for varying tension on filament 1 (vertical axis) and on filament 2 (horizontal axis). Specifically, the color scale is defined as ((cnatchnslip1)100%) when ncatch > nslip (shown in red) and ((nslipcnatch1)100%) when nslip > ncatch (shown in blue) where ncatch and nslip are the number of resp. catch and slip bond linkers connecting two filaments. Compression is reported as negative tension. 10x10 tension bins are used, and the distribution was smoothed using bicubic interpolation. The tension spacing is chosen such that each bin includes 10% of the filaments (Extended Data Figure 8b), is the same for the x- and y-axis and is only displayed on the y-axis for esthetic reasons. The simulations show that catch bonding linkers preferentially connect two high-tension filaments whereas slip bonding linkers are enriched on low-tension filament pairs.

References

    1. Marshall BT, et al. Direct observation of catch bonds involving cell-adhesion molecules. Nature. 2003;423:190–3. - PubMed
    1. Liu B, Chen W, Evavold BD, Zhu C. Accumulation of Dynamic Catch Bonds between TCR and Agonist Peptide-MHC Triggers T Cell Signaling. Cell. 2014;157:357–368. - PMC - PubMed
    1. Mbanga BL, Iyer BVS, Yashin VV, Balazs AC. Tuning the Mechanical Properties of Polymer-Grafted Nanoparticle Networks through the Use of Biomimetic Catch Bonds. Macromolecules. 2016;49:1353–1361.
    1. Thomas WE, Trintchina E, Forero M, Vogel V, Sokurenko EV. Bacterial Adhesion to Target Cells Enhanced by Shear Force. Cell. 2002;109:913–923. - PubMed
    1. Huang DL, Bax NA, Buckley CD, Weis WI, Dunn AR. Vinculin forms a directionally asymmetric catch bond with F-actin. Science (80-) 2017;357:1–5. - PMC - PubMed

Publication types