. 2022 Sep;7(9):1419-1430.
doi: 10.1038/s41564-022-01203-y. Epub 2022 Aug 25.

Wildfire-dependent changes in soil microbiome diversity and function

Affiliations

Wildfire-dependent changes in soil microbiome diversity and function

Amelia R Nelson et al. Nat Microbiol. 2022 Sep.

Abstract

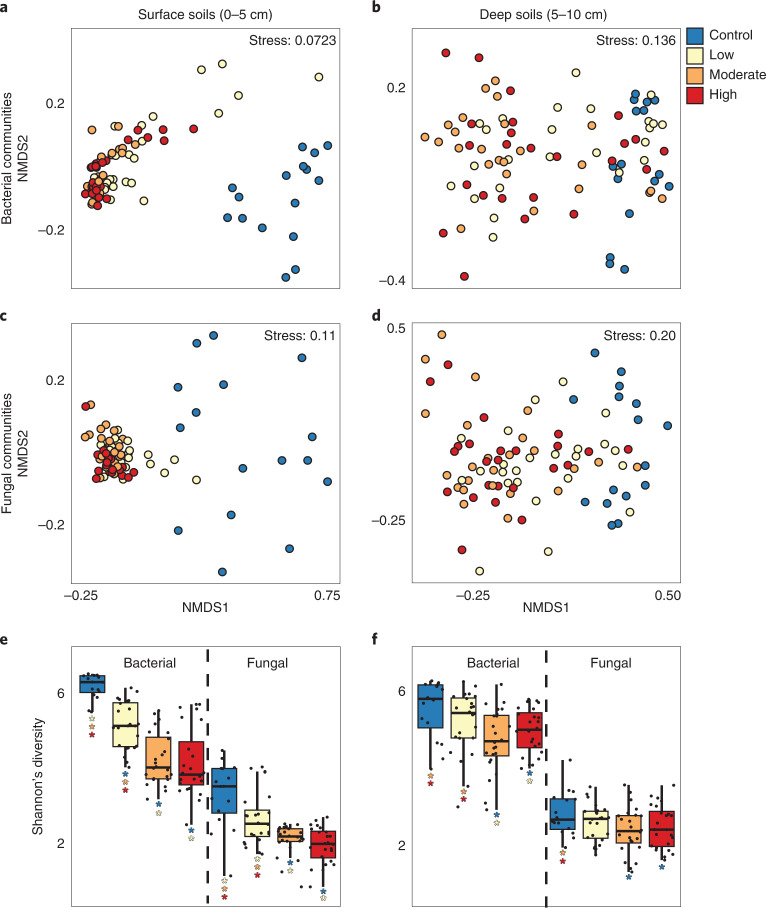
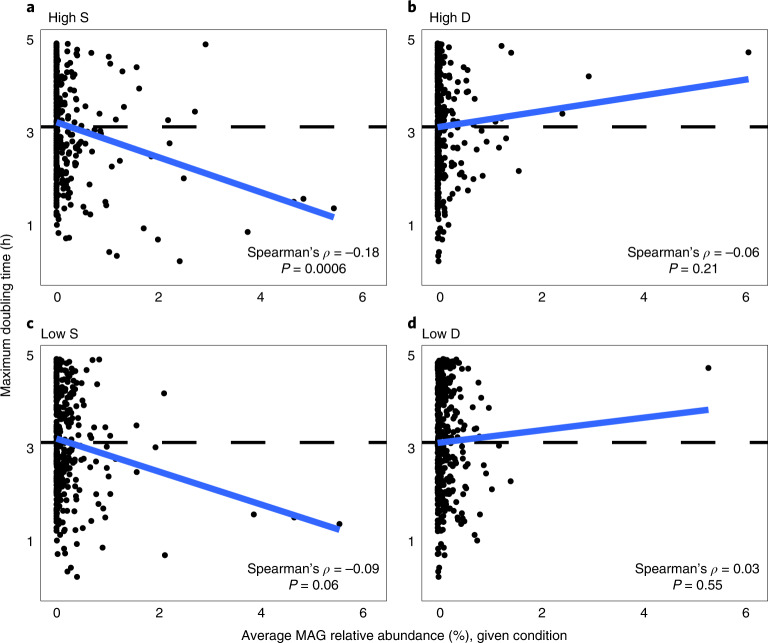
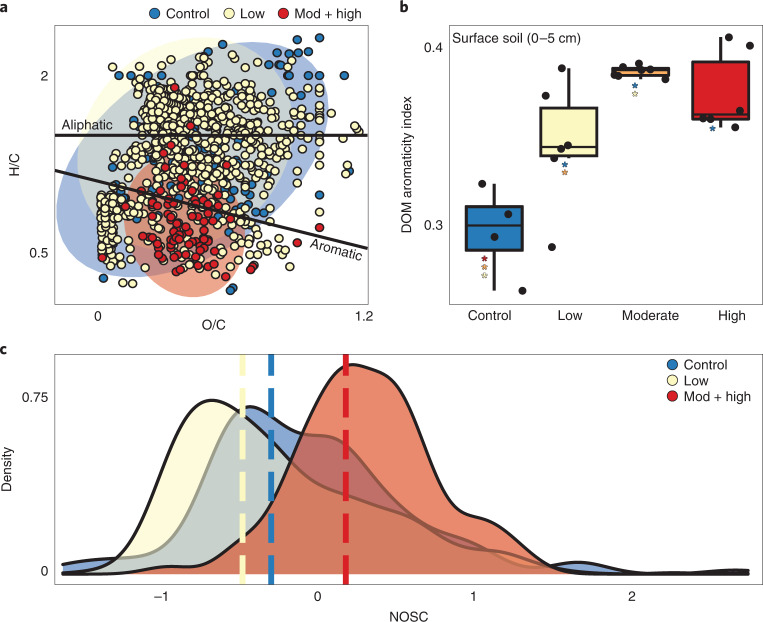
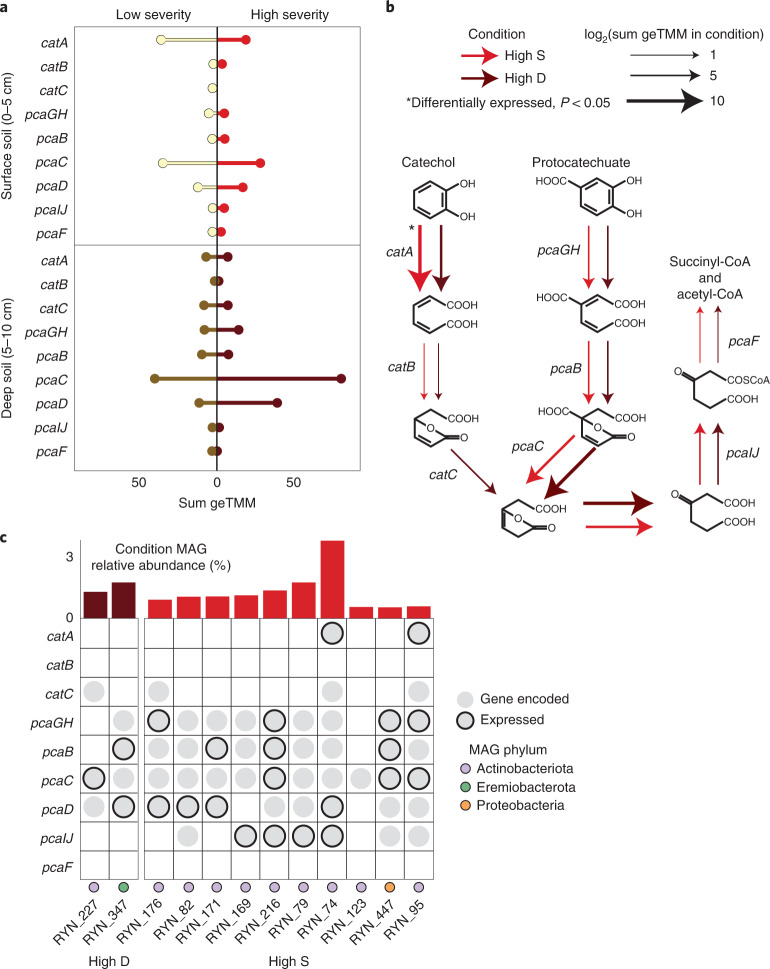
Forest soil microbiomes have crucial roles in carbon storage, biogeochemical cycling and rhizosphere processes. Wildfire season length, and the frequency and size of severe fires have increased owing to climate change. Fires affect ecosystem recovery and modify soil microbiomes and microbially mediated biogeochemical processes. To study wildfire-dependent changes in soil microbiomes, we characterized functional shifts in the soil microbiota (bacteria, fungi and viruses) across burn severity gradients (low, moderate and high severity) 1 yr post fire in coniferous forests in Colorado and Wyoming, USA. We found severity-dependent increases of Actinobacteria encoding genes for heat resistance, fast growth, and pyrogenic carbon utilization that might enhance post-fire survival. We report that increased burn severity led to the loss of ectomycorrhizal fungi and less tolerant microbial taxa. Viruses remained active in post-fire soils and probably influenced carbon cycling and biogeochemistry via turnover of biomass and ecosystem-relevant auxiliary metabolic genes. Our genome-resolved analyses link post-fire soil microbial taxonomy to functions and reveal the complexity of post-fire soil microbiome activity.


Conflict of interest statement

The authors declare no competing interests.

Figures

Fig. 1
Fig. 1. Surface soil microbiome undergoes homogenizing effect with burn.
ad, NMDS of surface (0–5 cm) (a,c) and deeper (5–10 cm) soil (b,d) bacterial (a,b) and fungal (c,d) communities shows increased separation of burned and unburned microbial communities in surface soils relative to deep soil communities. e,f, Shannon’s diversity (H) calculated from 16S rRNA and ITS gene sequencing in surface (e) and deep soils (f) further shows the increased susceptibility of microbiomes in surface soils to wildfire. Asterisks in e and f denote significant differences (pairwise t-test; P < 0.05) between conditions (n = 16 for control S and D, n = 24 for low, moderate and high severity-impacted S and D samples). Corresponding P values are listed in Supplementary Table 1. The lower and upper hinges of the boxplots represent the 25th and 75th percentiles, respectively, and the middle line is the median. The whiskers extend from the median by 1.5× the interquartile range. Data points represent outliers.
Fig. 2
Fig. 2. Potential fast growth rate favoured in soils impacted by high-severity wildfire.
ad, High S conditions (a) favour MAGs from organisms with faster potential growth rates (lower maximum doubling time, estimated using gRodon), indicated here by a significant negative correlation (two-sided Spearman’s rho test; Spearman’s ρ = −0.18, P < 0.05). This trend is not present in the other three conditions (bd). MAG average maximum doubling time is shown by the dashed line.
Fig. 3
Fig. 3. Pyrogenic dissolved organic matter becomes increasingly aromatic with wildfire burn severity.
a, Van Krevelen diagram showing unique formulas in unburned, low, and moderate and high (combined) surface soils. b, Aromaticity index of DOM pools extracted from surface soils across the burn severity gradient (n = 4 for control, 6 for low, 5 for moderate and 6 for high severity). Corresponding P values are shown in Supplementary Fig. 4b from one-sided pairwise t-test. The lower and upper hinges of the boxplot represent the 25th and 75th percentiles, respectively, and the middle line is the median. The whiskers extend from the median by 1.5× the interquartile range. Data points represent outliers. Coloured asterisks indicate significant difference between the two conditions (pairwise t-test, P < 0.05). c, Density plot of unique formula NOSC value distributions between different conditions. Dashed line shows NOSC median for each condition.
Fig. 4
Fig. 4. Dominant MAGs express genes for utilizing aromatic carbon.
a, The summed geTMM of each gene for catechol and protocatechuate ortho-cleavage in each condition. b, The pathway for catechol and protocatechuate ortho-cleavage, with arrows indicating the log normalized sum geTMM of the gene for high severity surface and deep soils. Asterisk indicates genes that are differentially expressed in the condition (Wald’s test in DESeq2; P = 0.0055 for catA in High S). c, The genomic potential and expression of each gene in the pathway for the MAGs of interest in High S and High D samples. The bar chart at the top shows the featured MAG relative abundance in that condition, coloured by featured condition.
Fig. 5
Fig. 5. Dominant MAGs are increasingly targeted by viruses in post-fire soils.
Each MAG’s relative abundance within (a) High S and (b) D and (c) Low S and (d) D conditions plotted against the number of putative viral linkages identified by VirHostMatcher. Dashed line indicates the dataset average of 196 virus-host linkages. Correlation and significance between MAG relative abundance and number of putative viral linkages were assessed using the two-sided Spearman rho test.
Extended Data Fig. 1
Extended Data Fig. 1. Overview of field sampling design.
There were four replicate burn severity gradients (two at Ryan Fire and two at Badger Creek Fire); six subsamples were collected in each burn condition at each gradient.
Extended Data Fig. 2
Extended Data Fig. 2. Shifting soil microbiome composition with wildfire burn severity.
The percent change in relative abundance from control to low, moderate, and high severity in surface soil of each main bacterial and fungal phylum. Phyla with relative abundance less than 0.5% were discarded for this analysis. Note that although the Firmicutes have the largest increase with burn (inset) their overall relative abundance in burned samples is still low relative to Actinobacteria (1.21% vs 25.6% relative abundance). Phyla with significant (one-sided pairwise t-test; p < 0.05) differences in relative abundance between the unburned and burned conditions are denoted with an asterisk.
Extended Data Fig. 3
Extended Data Fig. 3. Phyla distribution of bacterial metagenome-assembled genomes (MAGs).
Phyla distribution of the 637 medium- and high-quality MAGs (> 50% completion, <10% contamination) from burned surface and deep soils.
Extended Data Fig. 4
Extended Data Fig. 4. Average relative abundance of MAGs of interest across severities.
The relative abundances in Low and high severity of MAGs that are significantly enriched (one-sided pairwise t-test; p < 0.05; p-values in Supplementary Data 2) in High S vs. Low S (7 MAGs) or High D vs. Low D (2 MAGs) that match the designated criteria for discussion in the text (average relative abundance > 0.05% and standard deviation less than average relative abundance). Overlayed points show relative abundance of MAGs in each samples (n = 3 for each condition).
Extended Data Fig. 5
Extended Data Fig. 5. MAG GC content higher in MAGs reconstructed from high severity-impacted surface soils.
GC content of MAGs reconstructed from each condition. P-values are indicated between conditions if there are significant differences (one-sided pairwise t-test, p < 0.05). The lower and upper hinges of the boxplots represent the 25th and 75th percentile and the middle line is the median. The upper whisker extends to the median plus 1.5x interquartile range and the lower whisker extends to the median minus 1.5x interquartile range. Jittered points represent individual MAGs (n = 131 reconstructed from Low S samples, n = 111 from High S, n = 247 from Low D, n = 148 from High D).
Extended Data Fig. 6
Extended Data Fig. 6. Widespread potential and expression of catechol and protocatechuate meta-cleavage in MAG dataset.
(a) Number of MAGs encoding and expressing each gene of the catechol and protocatechuate meta-cleavage pathways. (b) Phyla distribution of MAGs encoding 50% of either pathway.
Extended Data Fig. 7
Extended Data Fig. 7. Genomic evidence of other aerobic aromatic C degradation pathways.
The benzoyl-CoA oxidation pathway (a) and phenylacetyl-CoA oxidation pathway (b) with overlaid gene names and whether there was encoded or expressed evidence of these genes. Colored circles indicate whether a MAG from that phyla encoded that gene, bolded circles indicate that metatranscriptomic reads mapped to the gene, and asterisks indicate the gene was being highly expressed in any given condition.

Comment in

  • Soil microbiota takes the heat.
    Brunello L. Brunello L. Nat Rev Microbiol. 2022 Nov;20(11):638. doi: 10.1038/s41579-022-00806-w. Nat Rev Microbiol. 2022. PMID: 36138155 No abstract available.

References

    1. Dennison PE, Brewer SC, Arnold JD, Moritz MA. Large wildfire trends in the western United States, 1984–2011. Geophys. Res. Lett. 2014;41:2928–2933.
    1. Higuera, P. E. & Abatzoglou, J. T. Record‐setting climate enabled the extraordinary 2020 fire season in the western United States. Glob. Change Biol. 10.1111/gcb.15388 (2020). - PubMed
    1. Parks, S. A. & Abatzoglou, J. T. Warmer and drier fire seasons contribute to increases in area burned at high severity in western US forests from 1985 to 2017. Geophys. Res. Lett.47, e2020GL089858 (2020).
    1. Benavides-Solorio JDD, MacDonald LH. Measurement and prediction of post-fire erosion at the hillslope scale, Colorado Front Range. Int. J. Wildl. Fire. 2005;14:457–474.
    1. Pierson DN, Robichaud PR, Rhoades CC, Brown RE. Soil carbon and nitrogen eroded after severe wildfire and erosion mitigation treatments. Int. J. Wildl. Fire. 2019;28:814–821.

Publication types