. 2022 Aug 25;79(9):498.
doi: 10.1007/s00018-022-04521-w.

Sertoli cell survival and barrier function are regulated by miR-181c/d-Pafah1b1 axis during mammalian spermatogenesis

Affiliations

Sertoli cell survival and barrier function are regulated by miR-181c/d-Pafah1b1 axis during mammalian spermatogenesis

Yue Feng et al. Cell Mol Life Sci. .

Abstract

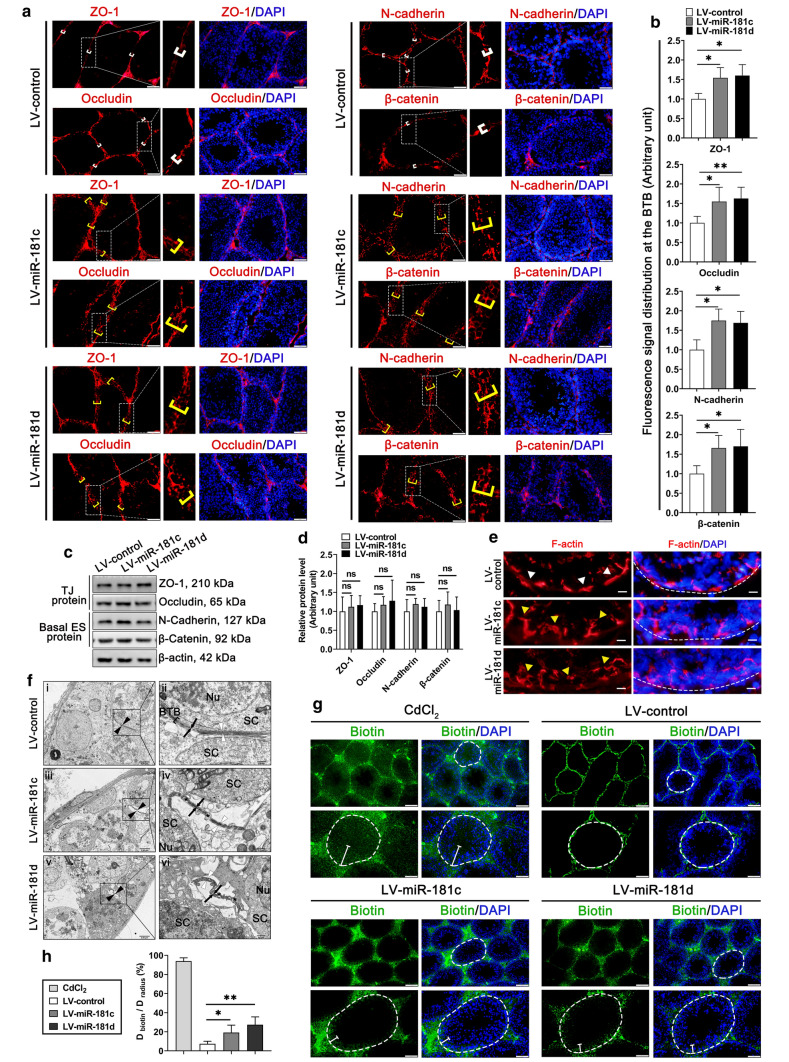
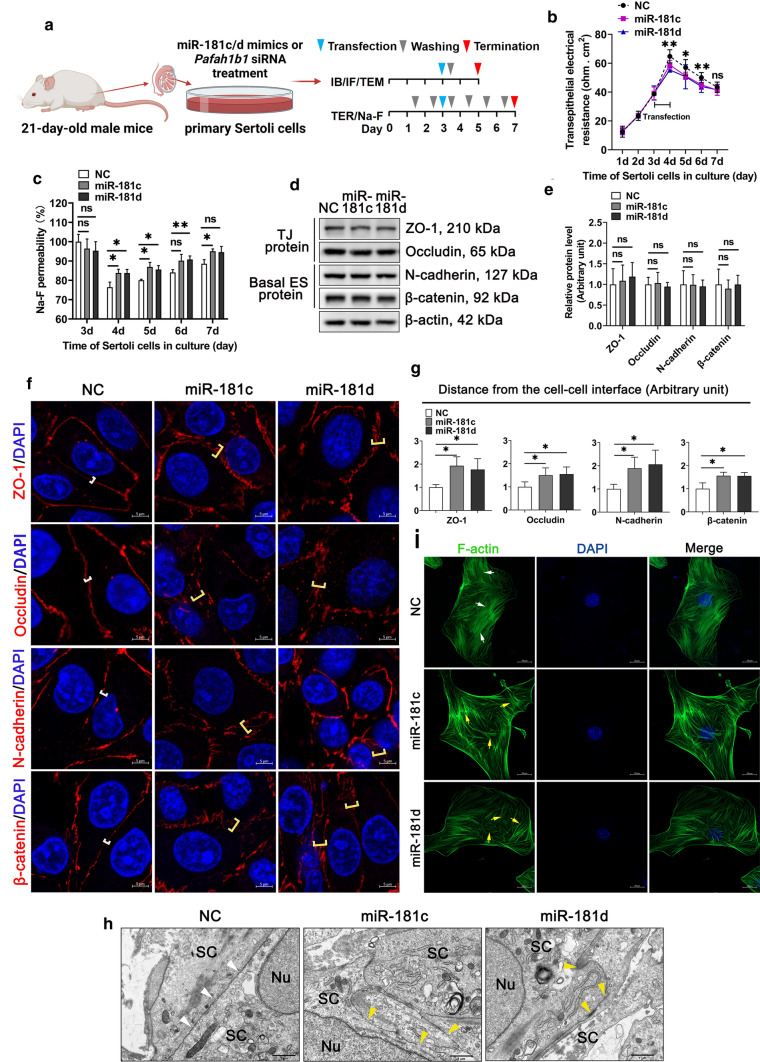
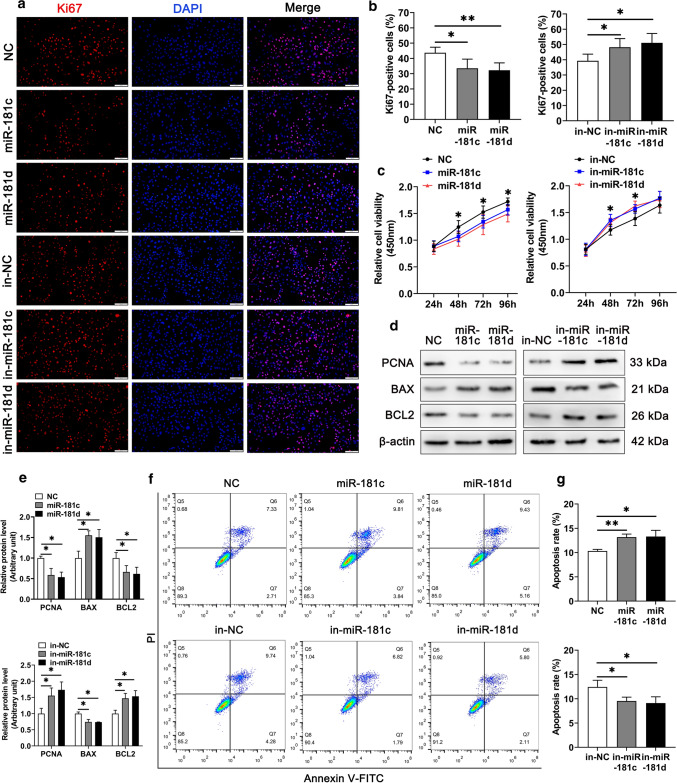
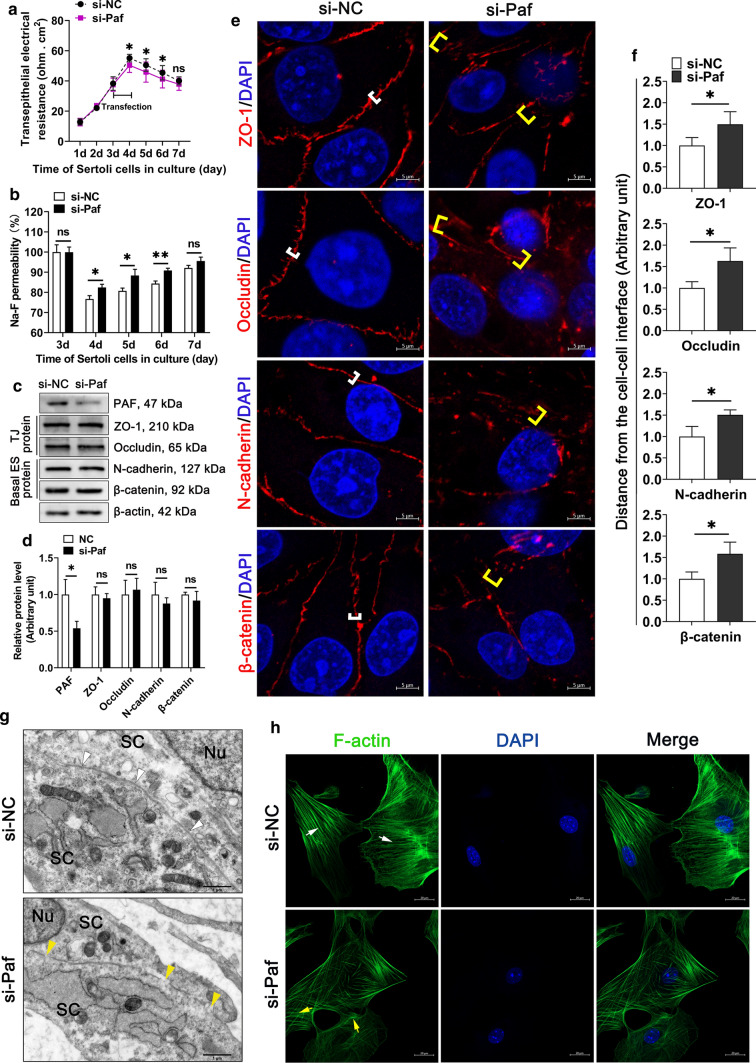
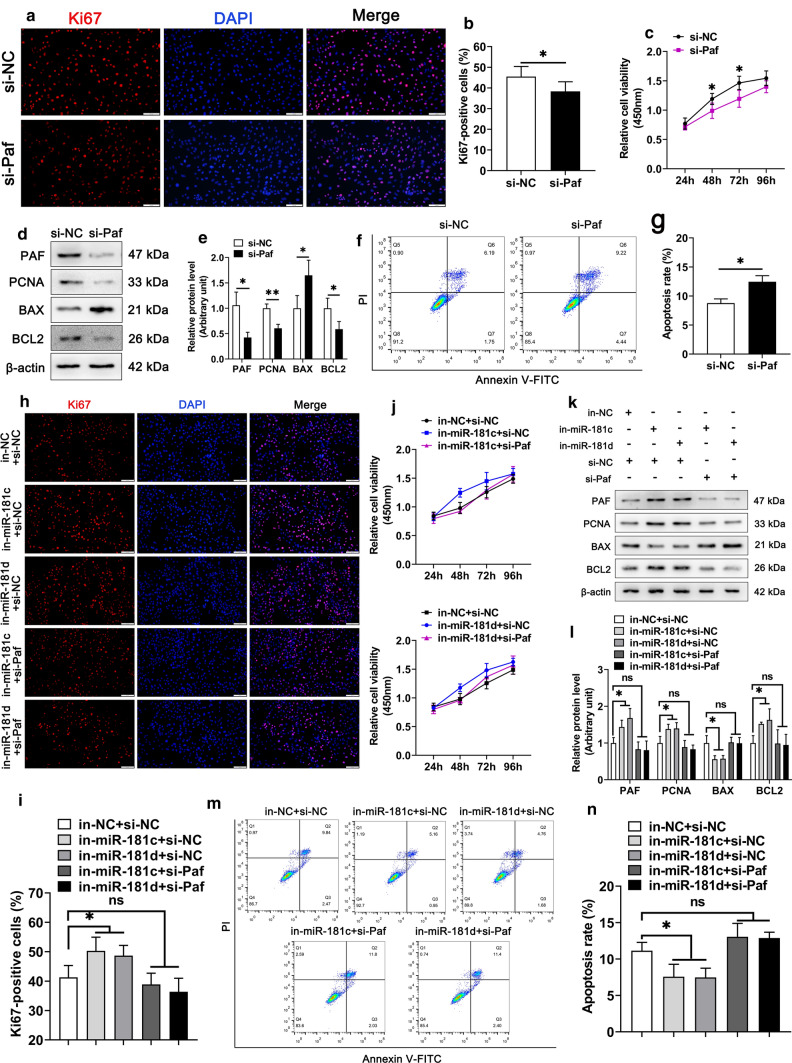
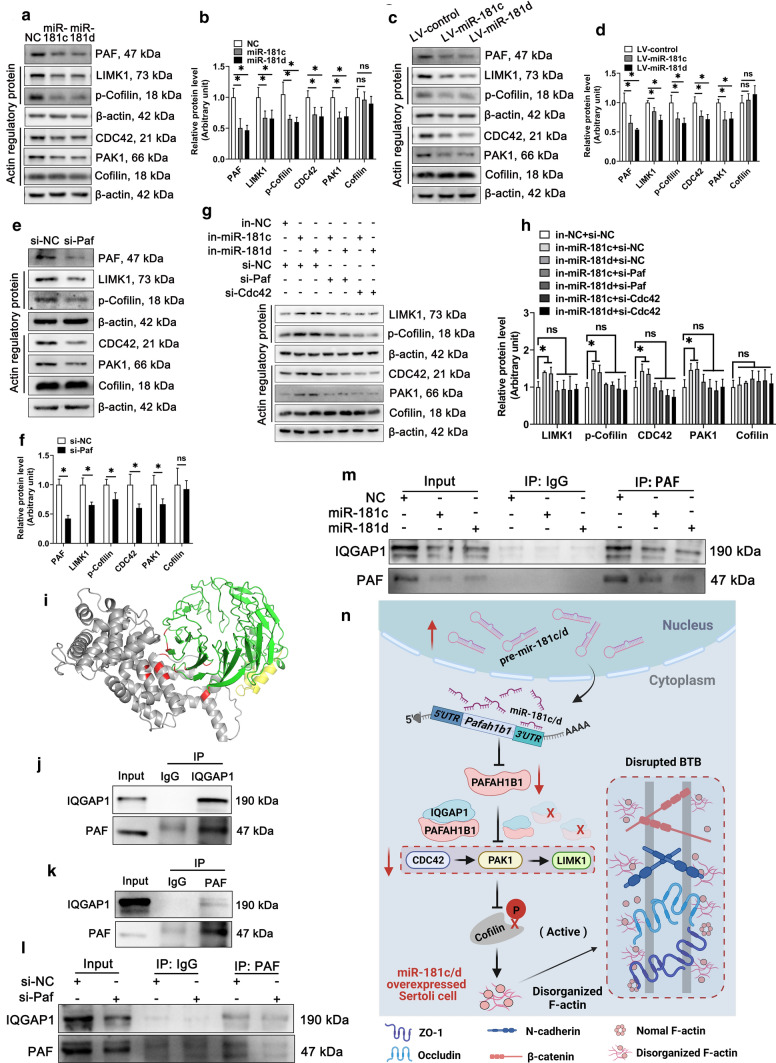
Sertoli cells contribute to the formation of the blood-testis barrier (BTB), which is necessary for normal spermatogenesis. Recently, microRNAs (miRNAs) have emerged as posttranscriptional regulatory elements in BTB function during spermatogenesis. Our previous study has shown that miR-181c or miR-181d (miR-181c/d) is highly expressed in testes from boars at 60 days old compared with at 180 days old. Herein, we found that overexpression of miR-181c/d via miR-181c/d mimics in murine Sertoli cells (SCs) or through injecting miR-181c/d-overexpressing lentivirus in murine testes perturbs BTB function by altering BTB-associated protein distribution at the Sertoli cell-cell interface and F-actin organization, but this in vivo perturbation disappears approximately 6 weeks after the final treatment. We also found that miR-181c/d represses Sertoli cell proliferation and promotes its apoptosis. Moreover, miR-181c/d regulates Sertoli cell survival and barrier function by targeting platelet-activating factor acetylhydrolase 1b regulatory subunit 1 (Pafah1b1) gene. Furthermore, miR-181c/d suppresses PAFAH1B1 expression, reduces the complex of PAFAH1B1 with IQ motif-containing GTPase activating protein 1, and inhibits CDC42/PAK1/LIMK1/Cofilin pathway which is required for F-actin stabilization. In total, our results reveal the regulatory axis of miR-181c/d-Pafah1b1 in cell survival and barrier function of Sertoli cells and provide additional insights into miRNA functions in mammalian spermatogenesis.

Keywords: Blood-testis barrier; Ectoplasmic specialization; Mammals; Pafah1b1; Sertoli cells; Spermatogenesis; Tight junction; miR-181c/d.


Conflict of interest statement

The authors declare that they have no conflict of interest.

Figures

Fig. 1
Fig. 1
LV-miR-181c/d administration perturbs the BTB function in vivo. Mice were analyzed at 2 weeks post the final LV-miR-181c/d administration. a Immunofluorescence staining of TJ proteins (ZO-1, Occludin) (red) and basal ES proteins (N-cadherin, β-catenin) (red) in testes (n = 3). These proteins are tightly localized at the BTB (white brackets) or diffusely localized at the BTB (yellow brackets) near the basement membrane. Scale bars: 50 μm and 10 μm. b Quantification of fluorescence signal distributed at the BTB. c Western blot analysis of TJ proteins and basal ES proteins in testes. The quantification of protein level is shown in the bar graph (d). e F-actin staining (red) in mouse testis sections (n = 3). In LV-miR-181c/d mice, F-actin is no longer lined up properly along the BTB (yellow arrowheads) as found in the LV-control mice (white arrowheads). Scale bar: 10 μm. f TEM ultrastructural analysis of mouse testis (n = 3). Black arrowheads represent the interface of two SCs; black arrows represent the TJs structure. In the LV-control mice, white arrowheads represent the normal actin bundles. In LV-miR-181c/d mice, white arrowheads represent the dissolved actin bundles; asterisks represent the swollen intercellular space between adjacent SCs. Nu, nucleus; SC, Sertoli cell. Scale bars: 2.5 μm (i, iii, v), 0.5 μm (ii, iv, vi). g In vivo BTB integrity assay (n = 3). CdCl2-treated mice were used as positive controls. Disruption of the BTB is reflected by diffusion distance (white segments) of the indicator from the basal lamina (white broken circles) to the tubule lumen. Scale bars: 100 and 50 μm. h Histogram illustrating results of the BTB integrity assay. Data are presented as mean ± SD of at least three independent experiments. *p < 0.05; **p < 0.01; ns, not significant
Fig. 2
Fig. 2
miR-181c/d overexpression disturbs the Sertoli cell barrier in vitro. Primary murine Sertoli cells (SCs) were transfected with mimics NC or miR-181c/d mimics. miR-181c mimics, miR-181d mimics, and mimics NC are abbreviated to miR-181c, miR-181d, and NC, respectively. a Schematic illustration of the treatment regimen. b, c The permeability of the Sertoli cell barrier was assessed in vitro by quantifying TER (b) or measuring the permeability of Na-F (c) in miR-181c/d mimics treated murine SCs. d Western blot analysis of TJ proteins and basal ES proteins in miR-181c/d mimics treated murine SCs. The quantification of protein level is shown in the bar graph (e). f Immunofluorescence staining of TJ proteins (red) and basal ES proteins (red) in miR-181c/d mimics treated murine SCs. These proteins are tightly localized (white brackets) or diffusively localized (yellow brackets) at the Sertoli cell–cell interface. Scale bar: 5 μm. g Quantification of fluorescence signal distributed at the cell–cell interface. h TEM ultrastructural analysis in miR-181c/d mimics treated murine SCs. Intact (white arrowheads) or disrupted (yellow arrowheads) TJ structures between adjacent murine SC contact. Scale bar: 1 μm. Nu, nucleus; SC, Sertoli cell. i F-actin staining (green) in miR-181c/d mimics treated murine SCs. Ordered (white arrows) or disordered (yellow arrows) F-actin are indicated. Scale bar: 20 μm. Data are presented as mean ± SD of at least three independent experiments. *p < 0.05; **p < 0.01; ns, not significant
Fig. 3
Fig. 3
miR-181c/d inhibits proliferation and promotes apoptosis of murine Sertoli cells. The murine SCs were transfected with mimics NC, miR-181c/d mimics, inhibitors NC, or miR-181c/d inhibitors. miR-181c inhibitors, miR-181d inhibitors, and inhibitors NC are abbreviated to in-miR-181c, in-miR-181d, and in-NC, respectively. a Immunofluorescence staining of the cell proliferation marker Ki67 (red) in miR-181c/d mimics or inhibitors treated murine SCs. Scale bar: 100 µm. b Quantification of Ki67-positive cells in miR-181c/d mimics or inhibitors treated murine SCs. c CCK-8 assay performed in miR-181c/d mimics or inhibitors treated murine SCs. d Western blot analysis of PCNA, BAX, and BCL2 in miR-181c/d mimics or inhibitors treated murine SCs. The quantification of protein level is shown in the bar graph (e). f Annexin V-FITC/PI and flow cytometry analysis was used to examine cell apoptotic rate in miR-181c/d mimics or inhibitors treated murine SCs. g Quantification of cell apoptotic rate in miR-181c/d mimics or inhibitors treated murine SCs. Data are presented as mean ± SD of at least three independent experiments. *p < 0.05; **p < 0.01
Fig. 4
Fig. 4
Inhibition of Pafah1b1 disturbs the Sertoli cell barrier in vitro. The murine SCs were transfected with NC siRNA or Pafah1b1 siRNA. NC siRNA and Pafah1b1 siRNA are abbreviated to si-NC and si-paf, respectively. a, b The permeability of the Sertoli cell barrier was assessed in vitro by quantifying TER (a) or measuring the permeability of Na-F (b) in Pafah1b1 siRNA treated murine SCs. c Western blot analysis of TJ proteins and basal ES proteins in Pafah1b1 siRNA treated murine SCs. The quantification of protein level is shown in the bar graph (d). e Immunofluorescence staining of TJ proteins (red) and basal ES proteins (red) in Pafah1b1 siRNA treated murine SCs. These proteins are tightly localized (white brackets) or diffusively localized (yellow brackets) at the Sertoli cell–cell interface. Scale bar: 5 μm. f Quantification of fluorescence signal distributed at the cell–cell interface. g TEM ultrastructural analysis in Pafah1b1 siRNA treated murine SCs. Intact (white arrowheads) or disrupted (yellow arrowheads) TJ structures between adjacent murine SC contact. Scale bar: 1 μm. Nu, nucleus; SC, Sertoli cell. h F-actin staining (green) in Pafah1b1 siRNA treated murine SCs. Ordered (white arrows) or disordered (yellow arrows) F-actin are indicated. Scale bar: 20 μm. Data are presented as mean ± SD of at least three independent experiments. *p < 0.05; **p < 0.01; ns, not significant
Fig. 5
Fig. 5
Pafah1b1 knockdown reverses the pro-growth of miR-181c/d inhibited murine Sertoli cells. The murine SCs were transfected with NC siRNA or Pafah1b1 siRNA. a Immunofluorescence staining of Ki67 (red) in Pafah1b1 siRNA treated murine SCs. Scale bar: 100 µm. b Quantification of Ki67-positive cells in Pafah1b1 siRNA treated murine SCs. c CCK-8 assay performed in Pafah1b1 siRNA treated murine SCs. d Western blot analysis of PAFAH1B1, PCNA, BAX, and BCL2 in Pafah1b1 siRNA treated murine SCs. The quantification of protein level is shown in the bar graph (e). f Annexin V-FITC/PI and flow cytometry analysis was used to examine cell apoptotic rate in Pafah1b1 siRNA treated murine SCs. g The quantification of cell apoptotic rate in Pafah1b1 siRNA treated murine SCs. Five co-transfection treatments were constructed in this experiment, including inhibitors NC + NC siRNA, miR-181c inhibitors + NC siRNA, miR-181d inhibitors + NC siRNA, miR-181c inhibitors + Pafah1b1 siRNA, and miR-181d inhibitors + Pafah1b1 siRNA. h-j Ki67 staining (h) and CCK-8 (j) assay were performed in murine SCs treated with co-transfections. Quantification of Ki67-positive murine SCs treated with co-transfections (i). Scale bar: 100 µm. k Western blot analysis of PAFAH1B1, PCNA, BAX, and BCL2 in murine SCs treated with co-transfections. The quantification of protein level is shown in the bar graph (l). m Annexin V-FITC/PI and flow cytometry analysis was used to examine cell apoptotic rate in murine SCs treated with co-transfections. n The quantification of cell apoptotic rate in murine SCs treated with co-transfections. Data are presented as mean ± SD of at least three independent experiments. *p < 0.05; **p < 0.01; ns, not significant
Fig. 6
Fig. 6
PAFAH1B1 regulates the expression of actin-regulatory proteins by interacting with IQGAP1 in murine Sertoli cells. a-h Western blot analysis and quantification for CDC42, PAK1, LIMK1, Cofilin, and p-Cofilin proteins in miR-181c/d mimics treated murine SCs (a, b), LV-miR-181c/d treated murine testes (c, d), Pafah1b1 siRNA treated murine SCs (e, f), and miR-181c/d inhibitors + Pafah1b1 siRNA or miR-181c/d inhibitors + Cdc42 siRNA co-treated murine SCs (g, h). i The interaction between PAFAH1B1 and IQGAP1 was predicted by the ZDOCK server. PAFAH1B1 is indicated in green plus yellow; IQGAP1 is indicated in gray; the region of interaction is indicated in red. j, k Co-immunoprecipitation of PAFAH1B1 with IQGAP1 in murine SCs. l, m Immunoprecipitation assay was performed in Pafah1b1 siRNA (l) or miR-181c/d mimics (m) treated murine SCs. n A schematic diagram illustrating the regulatory roles of the miR-181c/d-PAFAH1B1 axis on the Sertoli cell barrier function. Overexpression of miR-181c/d in murine SCs inhibits PAFAH1B1, which reduces the PAFAH1B1-IQGAP1 complex, resulting in the downregulation of CDC42 and its downstream PAK1, LIMK1, and p-Cofilin. Thus, changes in the expression of these actin-regulatory proteins impede the organization of F-actin, which could be a potential reason for perturbing the stabilization of the attachment sites between BTB-associated proteins and F-actin and disturbing the Sertoli cell barrier function

Similar articles

Cited by

References

    1. Fallarino F, Luca G, Calvitti M, Mancuso F, Nastruzzi C, Fioretti MC, Grohmann U, Becchetti E, Burgevin A, Kratzer R, et al. Therapy of experimental type 1 diabetes by isolated Sertoli cell xenografts alone. J Exp Med. 2009;206(11):2511–2526. doi: 10.1084/jem.20090134. - DOI - PMC - PubMed
    1. Wang Z, Xu X, Li JL, Palmer C, Maric D, Dean J. Sertoli cell-only phenotype and scRNA-seq define PRAMEF12 as a factor essential for spermatogenesis in mice. Nat Commun. 2019;10(1):5196. doi: 10.1038/s41467-019-13193-3. - DOI - PMC - PubMed
    1. Orth JM, Gunsalus GL, Lamperti AA. Evidence from Sertoli cell-depleted rats indicates that spermatid number in adults depends on numbers of Sertoli cells produced during perinatal development. Endocrinology. 1988;122(3):787–794. doi: 10.1210/endo-122-3-787. - DOI - PubMed
    1. Mruk DD, Cheng CY. The mammalian blood-testis barrier: Its biology and regulation. Endocr Rev. 2015;36(5):564–591. doi: 10.1210/er.2014-1101. - DOI - PMC - PubMed
    1. Hui L, Nie Y, Li S, Guo M, Yang W, Huang R, Chen J, Liu Y, Lu X, Chen Z, et al. Matrix metalloproteinase 9 facilitates Zika virus invasion of the testis by modulating the integrity of the blood-testis barrier. PLoS Pathog. 2020;16(4):e1008509. doi: 10.1371/journal.ppat.1008509. - DOI - PMC - PubMed