. 2022 Aug 2;12(8):1069.
doi: 10.3390/biom12081069.

Isolation, Characterization, and Autophagy Function of BECN1-Splicing Isoforms in Cancer Cells

Affiliations

Isolation, Characterization, and Autophagy Function of BECN1-Splicing Isoforms in Cancer Cells

Chinmay Maheshwari et al. Biomolecules. .

Abstract

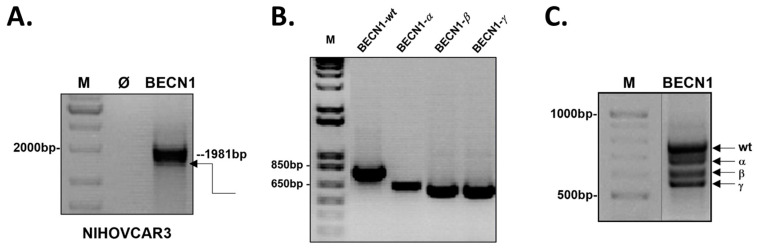
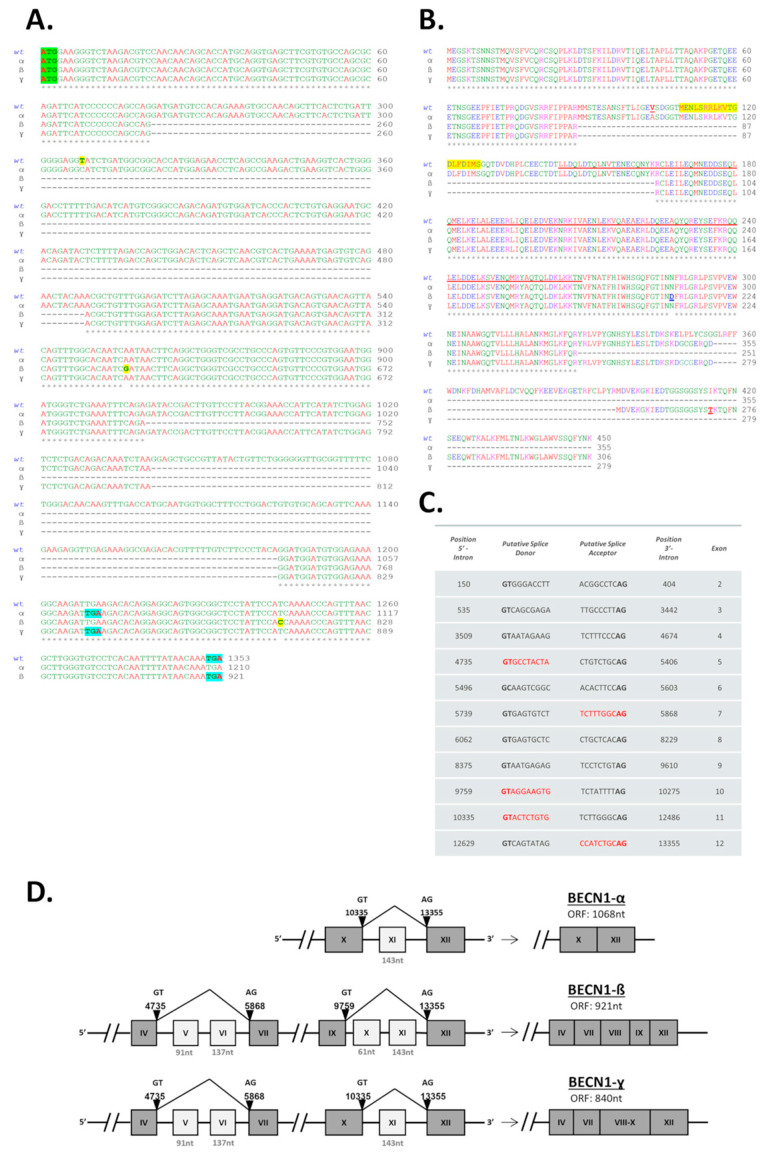
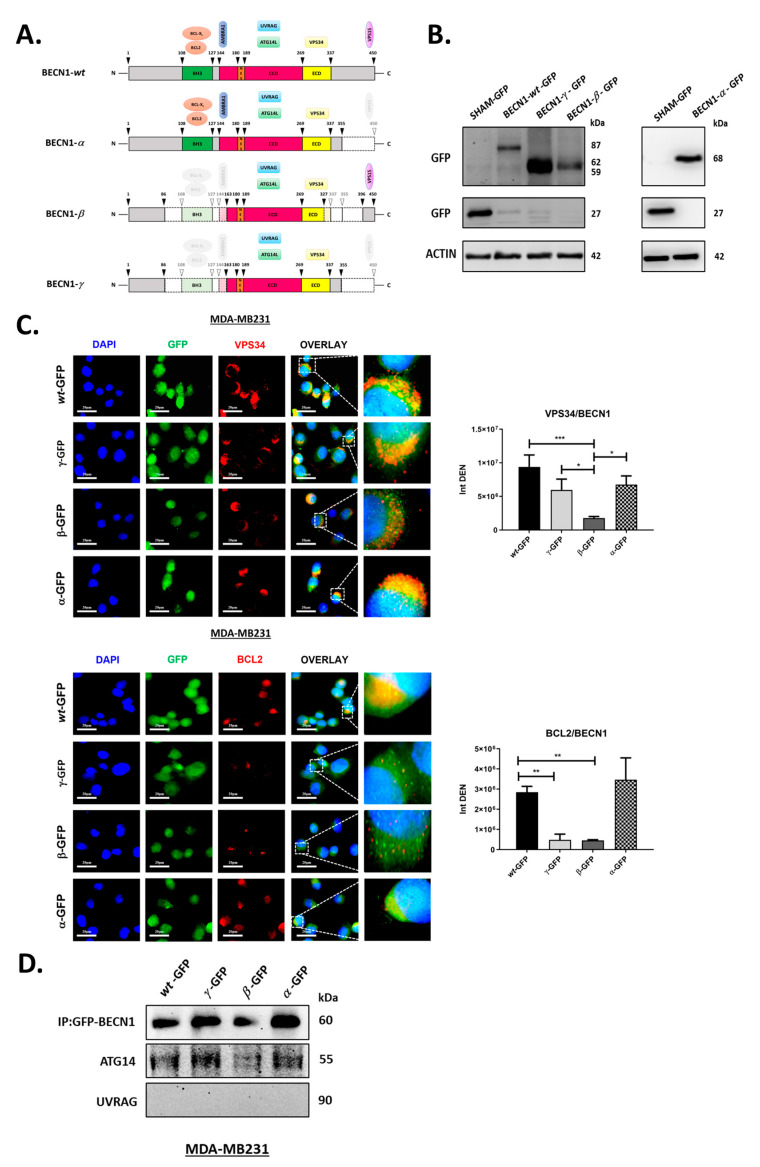
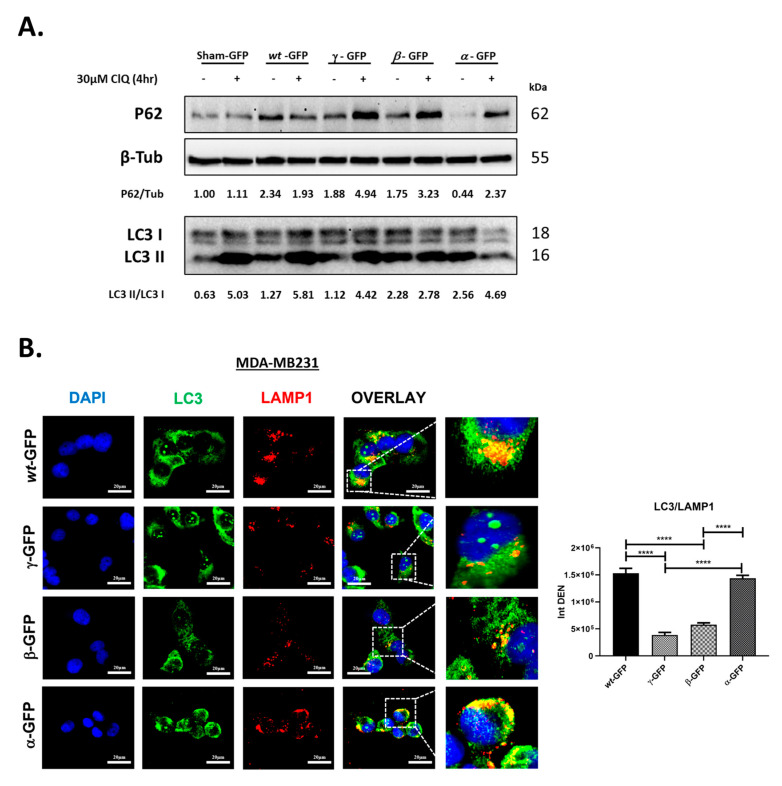
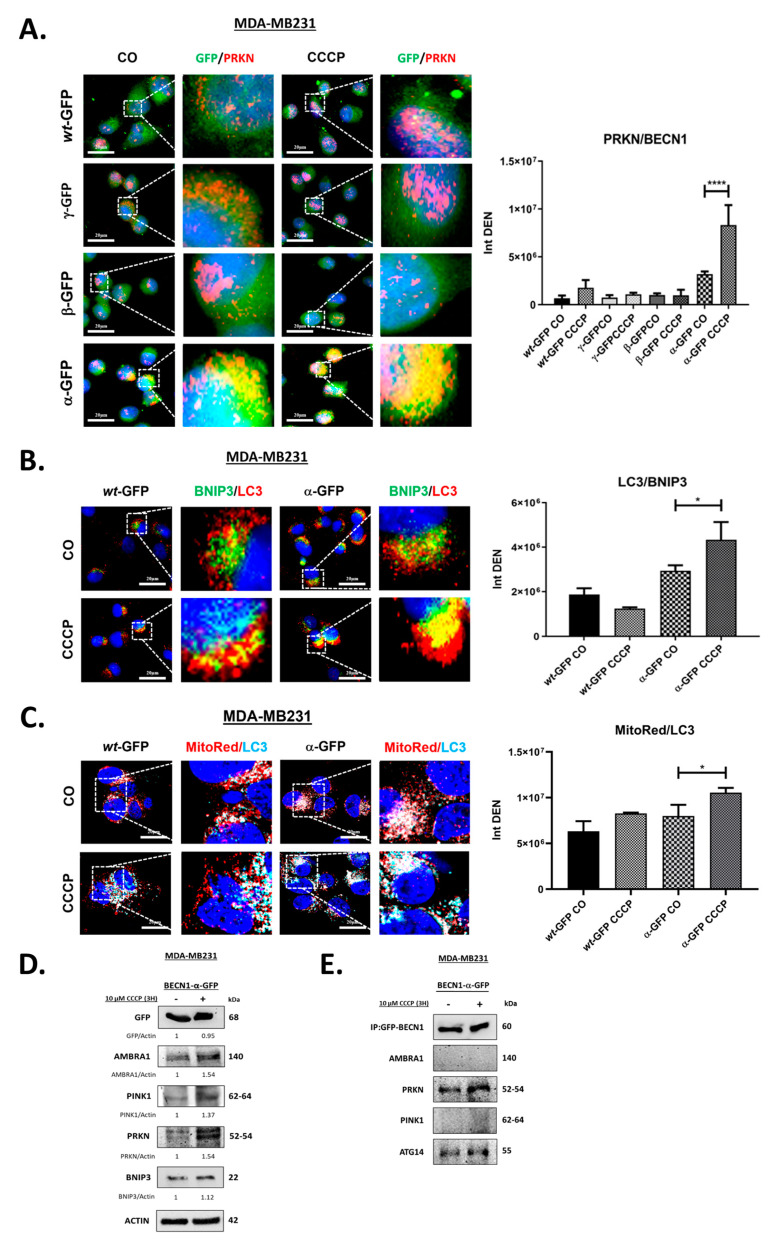
Alternative splicing allows the synthesis of different protein variants starting from a single gene. Human Beclin 1 (BECN1) is a key autophagy regulator that acts as haploinsufficient tumor suppressor since its decreased expression correlates with tumorigenesis and poor prognosis in cancer patients. Recent studies show that BECN1 mRNA undergoes alternative splicing. Here, we report on the isolation and molecular and functional characterization of three BECN1 transcript variants (named BECN1-α, -β and -γ) in human cancer cells. In ovarian cancer NIHOVCAR3, these splicing variants were found along with the canonical wild-type. BECN1-α lacks 143 nucleotides at its C-terminus and corresponds to a variant previously described. BECN1-β and -γ lack the BCL2 homology 3 domain and other regions at their C-termini. Following overexpression in breast cancer cells MDA-MB231, we found that BECN1-α stimulates autophagy. Specifically, BECN1-α binds to Parkin and stimulates mitophagy. On the contrary, BECN1-β reduces autophagy with a dominant negative effect over the endogenous wild-type isoform. BECN1-γ maintains its ability to interact with the vacuolar protein sorting 34 and only has a slight effect on autophagy. It is possible that cancer cells utilize the alternative splicing of BECN1 for modulating autophagy and mitophagy in response to environmental stresses.

Keywords: BH3 domain breast cancers; Bcl-2; Beclin 1; alternative splicing; autophagy; isoforms; mitophagy; ovarian cancers.


Conflict of interest statement

The authors declare no conflict of interest.

Figures

Figure 1
Figure 1
Isolation of BECN1 transcript variants from ovarian cancer cells NIHOVCAR3. Agarose gel electrophoresis of the products of (A) the RT-PCR, (B) screening PCR, and (C) nested PCR. Expected bands for the wild-type BECN1 isoform are indicated ((A,B), dotted lines). Arrow in (A) indicates putative additional RT-PCR product. Arrows in (C) indicate the wild-type BECN1 (wt) and the short BECN1 isoforms α, β, and γ. Molecular weight standard, M. Negative control (no template), Ø.
Figure 2
Figure 2
Sequencing analysis of BECN1 transcript variants. (A) Multiple sequence alignment of the nucleotide coding sequences of the BECN1 isoforms (wt, α, β, and γ) isolated from NIHOVCAR3. Nucleotide numbering: nucleotide +1 is the A of the ATG-translation initiation codon in the BECN1-wt mRNA. ATG-translation initiation codons are in green. TGA stop codons are in blue. Missense point mutations (308C>T, 855A>G, and 1244T>C) found in the isoforms BECN1-wt and -β are in yellow. (B) Multiple sequence alignment of the amino acid sequences of the BECN1 isoforms (wt, α, β, and γ). Amino acids 108–127 of the BH3D domain are highlighted in yellow. Amino acids 144–269 of the CCD domain are underlined in red. Substitutions Asn211Asp and Ile271Thr resulting from the missense point mutations found in the isoform BECN1-β are in underlined bold letters. (C) Putative splicing donor (GT/GC) and acceptor (AG) sites recognized by the software ASSP. Nucleotide sequences of the donor/acceptor site for the splicing generating the 3 short BECN1 isoforms are in red. Nucleotide numbering: Nucleotide +1 is the first nucleotide of the primary transcript (NCBI Reference Sequence: NC_000017.11). Nucleotide positions define splice site boundaries (nucleotide position at 5 and 3′ introns). (D) Schematic representation of the exon skipping resulting from the alternative splicing of the BECN1 isoforms α, β, and γ. Skipped exons are in light gray. Nucleotide positions of the splicing donor/accepter involved in the alternative splicing are indicated (arrowheads).
Figure 3
Figure 3
BECN1 isoforms show different alterations in their interactions with VPS34 and BCL2 while maintaining their ability to bind to ATG14. (A) Schematic representation of BECN1 isoforms primary protein structure and domains. BECN1 domains and interacting proteins investigated in this study are shown. Arrowheads indicate the positions of the amino acids flanking BECN1 domains, or of the deletions found in the short isoforms. (B) MDA-MB231 cells were transfected with the empty pEGFP-N1 vector (SHAM-GFP) or with the vector carrying BECN1-wt-GFP, BECN1-α-GFP, BECN1-β-GFP, or BECN1-γ-GFP. After 48 h, cells were harvested and processed for immunoblotting with anti-GFP antibody. Molecular weights of the bands expected for GFP or for each BECN1 isoform fused with the GFP are shown. (C) MDA-MB231 cells plated on coverslips and transfected with pEGFP-N1 vector carrying BECN1-wt-GFP (wt-GFP), BECN1-α-GFP(α-GFP), BECN1-β-GFP (β-GFP), or BECN1-γ-GFP (γ-GFP). After 48 h, cells were fixed, stained for either VPS34 (upper panel, red) or BCL2 (lower panel, red) and imaged by fluorescence microscopy. GFP fluorescence (green) labels the BECN1-GFP fusion proteins. Nuclei were stained with DAPI (blue). Scale bars: 20 μm. Histograms show the intensity densities of yellow signals (Int DEN), which result from close green and red fluorescence and are representative of the level of colocalization between BECN1/VPS34 or BECN1/BCL2. Asterisks indicate significantly different yellow signal intensities (* p < 0.05, ** p < 0.01, *** p < 0.001). Error bars, SD. (D) MDA-MB231 cells were plated on Petri dishes and transfected as in (C). After 48 h, cells were processed for the immunoprecipitation of BECN1-GFP isoforms as described in the Materials and Methods section. Immune complexes were separated by SDS-PAGE and processed for immunoblotting with the indicated antibodies.
Figure 4
Figure 4
BECN1 isoforms have idiosyncratic effects on autophagy. (A) MDA-MB231 cells were transfected with pEGFP-N1 empty vector (Sham-GFP) or the vector carrying BECN1-wt-GFP (wt-GFP), BECN1-α-GFP(α-GFP), BECN1-β-GFP (β-GFP), or BECN1-γ-GFP (γ-GFP). After 48 h, cells were harvested and processed for immunoblotting with the indicated antibodies. Where indicated, cells were exposed to 30 µM Clq for the last 4 h. Band intensities were determined by densitometric analysis and LC3-II/I or p62/tubulin ratios are shown. (B) MDA-MB231 cells plated on coverslips were transfected as in (A). After 48 h, cells were fixed, stained for LAMP1 (red) and LC3 (green), and imaged by fluorescence microscopy. Nuclei were stained with DAPI (blue). Cells shown in the panels were all positive for GFP fluorescence, indicating that all the cells were expressing the exogenous isoforms. Scale bars: 20 μm. Histograms show the intensity densities of yellow signals (Int DEN), which result from close green and red fluorescence and are representative of the level of colocalization between LAMP and LC3. Asterisks indicate significantly different yellow signal intensities (**** p < 0.0001). Error bars, SD.
Figure 5
Figure 5
BECN1-α interacts with PRKN stimulating mitophagy. (A) MDA-MB231 cells plated on coverslips were transfected with pEGFP-N1 vector carrying BECN1-wt-GFP (wt-GFP), BECN1-α-GFP (α-GFP), BECN1-β-GFP (β-GFP), or BECN1-γ-GFP (γ-GFP). After 48 h, cells were fixed, stained for PRKN (red) and imaged by florescence microscopy. Where indicated, cells were treated with 10 μM CCCP for the last 3 h. Nuclei were stained with DAPI (blue). Scale bars: 20 μm. Histograms show the intensity densities of yellow signals (Int DEN), which result from close green and red fluorescence and are representative of the level of colocalization between PRKN and GFP. Asterisks indicate significantly different yellow signal intensity (**** p < 0.0001). Error bars, SD. (B) MDA-MB231 were plated on coverslips and transfected with pEGFP-N1 vector carrying BECN1-wt-GFP (wt-GFP) or BECN1-α-GFP (α-GFP). After 48 h, cells were fixed, stained for LC3 (red) and BNIP3 (green), and imaged by fluorescence microscopy. Where indicated, cells were treated with 10 μM CCCP for the last 3 h. Nuclei were stained with DAPI (blue). Scale bars: 20 μm. Histograms show the intensity densities of yellow signals (Int DEN), which result from close green and red fluorescence and are representative of the level of colocalization between BNIP3 and LC3. Asterisks indicate significantly different yellow signal intensity (* p < 0.05). Error bars, SD. (C) MDA-MB231 were plated on coverslips and transfected and treated as in (B). After 48 h, cells were incubated with 500 nM Mitotracker™ RED (MitoRed) for the last 15 min at 37 °C. Following Mitotracker incubation, cells were washed with PBS, fixed, stained for LC3 (cyan), and imaged by fluorescence microscopy. Nuclei were stained with DAPI (blue). Scale bars: 20 μm. Histograms show the intensity densities of white signals (Int DEN), which result from close red and cyan fluorescence and are representative of the level of colocalization between Mitotracker and LC3. Asterisks indicate significantly different white signal intensity (* p < 0.05). Error bars, SD. (D) MDA-MB231 cells were plated on Petri dishes and transfected with pEGFP-N1 vector carrying BECN1-α-GFP (α-GFP). After 48 h, cells were harvested and processed for immunoblotting with the indicated antibodies. Where indicated, cells were treated with 10 μM CCCP for the last 3 h. Band intensities were determined by densitometric analysis and GFP/Actin, AMBRA1/Actin, PINK1/Actin, PRKN/Actin, BNIP3/Actin ratios are shown. (E) Cell homogenates from (C) were processed for the immunoprecipitation of BECN1-α-GFP isoform, as described in the Materials and Methods section. Immune complexes were separated by SDS-PAGE and processed for immunoblotting with the indicated antibodies.

Similar articles

Cited by

References

    1. Liang X.H., Jackson S., Seaman M., Brown K., Kempkes B., Hibshoosh H., Levine B. Induction of Autophagy and Inhibition of Tumorigenesis by Beclin 1. Nature. 1999;402:672–676. doi: 10.1038/45257. - DOI - PubMed
    1. Aita V.M., Liang X.H., Murty V.V., Pincus D.L., Yu W., Cayanis E., Kalachikov S., Gilliam T.C., Levine B. Cloning and Genomic Organization of Beclin 1, a Candidate Tumor Suppressor Gene on Chromosome 17q21. Genomics. 1999;59:59–65. doi: 10.1006/geno.1999.5851. - DOI - PubMed
    1. Qu X., Yu J., Bhagat G., Furuya N., Hibshoosh H., Troxel A., Rosen J., Eskelinen E.-L., Mizushima N., Ohsumi Y., et al. Promotion of Tumorigenesis by Heterozygous Disruption of the Beclin 1 Autophagy Gene. J. Clin. Investig. 2003;112:1809–1820. doi: 10.1172/JCI20039. - DOI - PMC - PubMed
    1. Yue Z., Jin S., Yang C., Levine A.J., Heintz N. Beclin 1, an Autophagy Gene Essential for Early Embryonic Development, Is a Haploinsufficient Tumor Suppressor. Proc. Natl. Acad. Sci. USA. 2003;100:15077–15082. doi: 10.1073/pnas.2436255100. - DOI - PMC - PubMed
    1. Cicchini M., Chakrabarti R., Kongara S., Price S., Nahar R., Lozy F., Zhong H., Vazquez A., Kang Y., Karantza V. Autophagy Regulator BECN1 Suppresses Mammary Tumorigenesis Driven by WNT1 Activation and Following Parity. Autophagy. 2014;10:2036–2052. doi: 10.4161/auto.34398. - DOI - PMC - PubMed

Publication types