Review
. 2022 Aug 4;12(8):1076.
doi: 10.3390/biom12081076.

Detergent-Free Isolation of Membrane Proteins and Strategies to Study Them in a Near-Native Membrane Environment

Affiliations
Review

Detergent-Free Isolation of Membrane Proteins and Strategies to Study Them in a Near-Native Membrane Environment

Bankala Krishnarjuna et al. Biomolecules. .

Abstract

Atomic-resolution structural studies of membrane-associated proteins and peptides in a membrane environment are important to fully understand their biological function and the roles played by them in the pathology of many diseases. However, the complexity of the cell membrane has severely limited the application of commonly used biophysical and biochemical techniques. Recent advancements in NMR spectroscopy and cryoEM approaches and the development of novel membrane mimetics have overcome some of the major challenges in this area. For example, the development of a variety of lipid-nanodiscs has enabled stable reconstitution and structural and functional studies of membrane proteins. In particular, the ability of synthetic amphipathic polymers to isolate membrane proteins directly from the cell membrane, along with the associated membrane components such as lipids, without the use of a detergent, has opened new avenues to study the structure and function of membrane proteins using a variety of biophysical and biological approaches. This review article is focused on covering the various polymers and approaches developed and their applications for the functional reconstitution and structural investigation of membrane proteins. The unique advantages and limitations of the use of synthetic polymers are also discussed.

Keywords: NMR; cryoEM; detergent-free membrane protein isolation; ionic and non-ionic polymers; lipid-nanodisc; membrane protein stability and structure.


Conflict of interest statement

The authors declare no conflict of interest.

Figures

Figure 6
Figure 6
Schematic showing the formation of polymer-nanodiscs upon mixing synthetic lipids/membranes (liposomes; yellow/blue) with an amphipathic polymer (green). Polymer dissolves lipid aggregates and self-assemble to form discoidal nano-size particles called “polymer-nanodiscs”. The size of the nanodisc depends on the lipid:polymer ratio. The time course of dissolution and nanodiscs formation depends on the type of polymer and lipids used. The stability of nanodiscs against temperature, divalent metal ions (such as Ca2+ and Mg2+), and pH also depend on the type of polymer and lipids used. This Figure and caption are adopted from reference [129] with copyright permission.
Figure 14
Figure 14
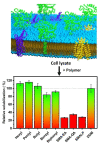
E. coli membrane solubilization by inulin-based non-ionic polymers possessing different types of hydrophobic functional groups (see Figure 2 for the chemical structure). The solubilization efficacy of inulin-based polymers is compared with that of SMA-based polymers and DDM. This Figure and caption are adopted from reference [202] with copyright permission.
Figure 1
Figure 1
Schematic representation of membrane protein purification using the traditional detergent-based approach and the detergent-free polymer-based approach. The steps include protein expression, cell lysis, and purification. Unlike the detergent-based approach, in the detergent-free polymer-based method, a synthetic polymer is added to cell lysates to dissolve them to form polymer–membrane complexes from which nanodiscs containing the desired protein are isolated. In the nanodisc-membrane, the lipids are orderly packed, facing the hydrophobic tails inward and the hydrophilic head groups exposed to an aqueous environment.
Figure 2
Figure 2
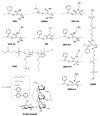
Chemical structures of nanodiscs-forming synthetic amphipathic polymers. These polymers have been developed and successfully shown to dissolve lipid-protein aggregates and form nanodiscs for reconstitution, detergent-free isolation, and characterization of membrane proteins in a near-native membrane environment. While research in this area continues to develop novel nanodisc-forming molecules (such as amphipathic polymers and peptides), these already reported polymers (including cationic, anionic, zwitterionic, and non-ionic) render studies on most (if not all) membrane proteins. An additional list of reported polymers can be found in the literature ([100,101,102,103,104,105,106,107]) and on the SMALP website (https://www.smalp.net/polymers.html, accessed on July 25 2022). The polymer structures were generated using ChemDraw [19.1.1.21].
Figure 3
Figure 3
Influence of various environmental parameters on SMA-based solubilization of E. coli membranes expressing KcsA in 10 mM Tris buffer at pH 8. Other parameters were varied, as indicated in the figure, with standard conditions being: 0.25% (w/v) SMA, 2 h incubation at 25 °C in 300 mM NaCl, and 15 mM KCl. (A) Influence of SMA concentration. The amount of membrane material was kept constant, and SMA was added at different final concentrations in the range of 0.05–1% (w/v). (B) Influence of incubation time and temperature. (C) Influence of salt concentration. Different amounts of NaCl were added at a constant ratio of NaCl/KCl of 20. The sample devoid of NaCl contained 5 mM KCl to ensure the structural stability of the KcsA tetramer. (D) Influence of divalent cations (M2+). CaCl2 or MgCl2 was used at a concentration of 0–10 mM; all samples contained 15 mM KCl in Tris-HCl 50 mM, pH 8. Data are averages of 2 independent samples, with the error margin indicating the difference in solubilization between both samples. Overall, increasing SMA concentration, temperature (~25 to 37 °C), incubation time, and salt concentration (~300 to 450 mM) are shown to enhance the solubilization yield of KcsA. pH is also shown strongly influence efficiency of SMA, with maximum efficiency reached for pH 8 or 8.5. This Figure and caption are adapted with permission from reference [111].
Figure 4
Figure 4
Model for the formation of membrane patches on SMA treatment. (A) SMA-resistant high-expression RC-LH1-X membranes have a low lipid:protein ratio and limited regions of the lipid bilayer. (B) Fusion with lipids or SMA-amenable bilayer-rich membranes introduces lipid-rich regions (pale green) between domains of closely packed RC-LH1-X complexes. (C) The addition of SMA causes solubilization of bilayer-rich regions as SMA-lipid nanodiscs (red/olive green). (D) This treatment liberates protein-rich membrane fragments that are sufficiently small to stay in solution (blue) during clearing ultracentrifugation spins and pass through the matrices of chromatography columns. (E) Extraction efficiencies of RC-LH1-PufX (blue), LH2 (green), and the cytbc1 complex (magenta) in membranes prepared from cells grown under semi-aerobic (SA) or low light (LL) and medium light (ML) photosynthetic conditions. The left panel shows solubilization in 2.5% w/v SMA polymer, the center panel shows low light membranes solubilized in 3% w/v β-DDM, and the right panel shows results where no solubilizing agents were added. Solid bars show values obtained by spectroscopy, and hatched bars show values for cytc1 by heme staining. Error bars indicate the standard error of the mean for three replicates. The inefficient solubilization was due to the polymer’s inability to disrupt the highly ordered and closely packed arrays formed by RC-LH1-PufX complexes. Figure 4A–D and caption are adopted from reference [118]. Figure 4E and caption are adopted from reference [114] with copyright permission.
Figure 5
Figure 5
Schematic diagram that summarizes the effects of SMA composition and pH on the molecular conformation and solubilization efficiency of the SMA copolymer. The amphipathic polymer is represented as a cartoon in which the hydrophobic domains enriched in styrene units are shown in red, while the maleic acid-rich hydrophilic part of the polymer is shown in black. The efficiency of cell membrane solubilization is depicted according to color coding. (Dark green) Complete and fast solubilization; (blue) solubilization is induced but remains incomplete; and (red) the polymer is not able to solubilize at all due to self-assembly and aggregation. It should be noted that the exact conditions vary with the protein under investigation. This Figure and caption are adopted from reference [120] with copyright permission.
Figure 7
Figure 7
Analysis of phospholipids in the local lipid polymer-nanodiscs. (A) TLC of lipids present in membranes and nanodiscs was identified by running pure synthetic samples of each as a standard (not shown). Bands above the labeled lipids are attributed to photoreaction center ([RC] from the purple bacterium Rhodobacter sphaeroides) pigments. DDM was visualized, but LDAO did not stain. Additional bands in the DDM and LDAO profiles are unidentified. No lipids could be detected in the samples solubilized by detergents DDM and LDAO, indicating the detergent removal of lipids [133]. (B) TLC of chloroform-methanol extracts of the yeast mitochondria and of CytcO-SMA native nanodiscs. From left to right: the 1st and the 2nd lanes are lipid standards (0.04 mg CL, 0.05 mg of each of DOPC, DOPE, PI, and PS); the 3rd lane is the extract of the yeast mitochondria (the loaded lipids were extracted from a sample that originally contained ~0.6 mg protein); the 4th and 5th lanes are extracts of two preparations of CytcO-SMA. The loaded lipids (at the arrow) were extracted from a sample that originally contained ~0.2 mg protein. The bands in lane 4 are slightly weaker than those in lane 5, presumably because slightly less material was applied in the former. The bands were visualized by iodine staining [113]. (C) Mitochondria subjected to mock SMA incubation (lane 4), or incubated with SMA, to form mitochondrial-LipodisqsW (lane 5) were analyzed for lipid content by thin-layer chromatography. Lipid standards are shown in lanes 1–3 [130]. (D) 31P NMR spectra of native E. coli lipids present in the polymer-nanodiscs and of the synthetic lipids (a reference sample). PE: phosphatidylethanolamine, CL: cardiolipin, and PG: phosphatidylglycerol, * indicates the uncharacterized E. coli lipids [55]. (E,F) Mass spectrometry analysis of SMA extracted AcrB after exchange into A8–35 and DDM. Initial native MS results of A8–35_Ex (E) and DDM_Ex (F) [134]. Figure 7A,B and captions are adopted from the references [113,133] with copyright permission. Figure 7C–F and captions are adopted from the references [55,130,134].
Figure 8
Figure 8
The structure of alternative Complex III (PDB id: 6BTM) from Flavobacterium johnsoniae [184], AcrB (PDB id: 6BAJ) from E. coli (K-12) [182], KimA (PDB id: 6S3K) from Bacillus subtilis [157], HwBr (PDB id: 5ITC) from Haloquadratum walsbyi [119], cytochrome bo3 (PDB id: 7CUQ) from E. coli [171], SLAC1 (PDB id: 7EN0) from Brachypodium distachyon SLAC1 [173], bacterial pLGIC (PDB id: 7L6Q) [172], the glycine receptor open conformation (PDB id: 6PM6; the Gly residues are shown in red spheres) and taurine-bound closed conformation (top view) (PDB id: 6PM3; taurine is shown in blue spheres) from zebrafish [185]. The 6PM3 structure is shown with 50% transparency to highlight taurine. ASIC1 (PDB id: 6VTK) from chicken [186], and EspP-BamA complex structure (PDB id: 7TTC) from E. coli [136]. The structures were generated using PyMOL.
Figure 8
Figure 8
The structure of alternative Complex III (PDB id: 6BTM) from Flavobacterium johnsoniae [184], AcrB (PDB id: 6BAJ) from E. coli (K-12) [182], KimA (PDB id: 6S3K) from Bacillus subtilis [157], HwBr (PDB id: 5ITC) from Haloquadratum walsbyi [119], cytochrome bo3 (PDB id: 7CUQ) from E. coli [171], SLAC1 (PDB id: 7EN0) from Brachypodium distachyon SLAC1 [173], bacterial pLGIC (PDB id: 7L6Q) [172], the glycine receptor open conformation (PDB id: 6PM6; the Gly residues are shown in red spheres) and taurine-bound closed conformation (top view) (PDB id: 6PM3; taurine is shown in blue spheres) from zebrafish [185]. The 6PM3 structure is shown with 50% transparency to highlight taurine. ASIC1 (PDB id: 6VTK) from chicken [186], and EspP-BamA complex structure (PDB id: 7TTC) from E. coli [136]. The structures were generated using PyMOL.
Figure 9
Figure 9
(A) Absorbance spectra of recombinant ~16-kDa rabbit cytochrome-b5 isolated in native E. coli native lipid-nanodiscs using an anionic SMA-EA polymer: oxidized form (409 nm) (blue), sodium dithionite-reduced form (424, 526 and 556 nm) (magenta), and difference spectra (reduced minus oxidized) (green). (B) 2D 1H/15N TROSY-HSQC NMR spectrum of 15N-labelled cytochrome-b5 in E. coli native lipid polymer-nanodiscs. This Figure and caption are adopted from reference [55].
Figure 10
Figure 10
Schematic showing the lipid-nanodiscs containing positively-charged polymers and a positively-charged protein (left), negatively-charged polymers, and a negatively-charged protein (right). Due to opposite charges, non-specific interactions occur between the belt-forming polymers and the reconstituted protein at a given pH which would reduce the stability of nanodiscs and also lead to structural changes and aggregation. Hence, the synthetic polymer used and the membrane protein to be reconstituted/studied should possess the same net charge.
Figure 11
Figure 11
Reconstitution and functional characterization of CYP450 2B4 in differently charged polymer-nanodiscs and DPC micelles: (a) Schematic showing CYP450 with heme coordination spheres of the CO-bound state reconstituted in an SMA-QA:DMPC nanodisc. (b) UV-vis absorption spectra of CYP450 reconstituted in different SMA polymer-nanodiscs or in DPC micelles in its ferric state (left column) and in a ferrous state in complex with CO (right column). UV-vis absorption spectra of a positively-charged CYP450 reconstituted in negatively-charged SMA-EA nanodiscs: (c) in the presence of the indicated NaCl concentrations and (d) the ferrous-CO complex (d). UV-vis spectra of a positively-charged CYP450 reconstituted in positively-charged SMA-QA-based DMPC nanodiscs and (e) in the presence of NaCl and (f) the ferrous-CO complex. These results demonstrate the importance of a membrane mimetic and polymer charge in nanodisc for the functional reconstitution of membrane proteins. The inactive CYP450 (i.e., P420) in the presence of DPC detergent or an anionic-polymer (like SMA or SMA-EA) is undesirable. The positively-charged SMA-QA retains the functional form of CYP450. This Figure and caption are adopted from reference [199].
Figure 12
Figure 12
Reconstitution and structural characterization of cytochrome-b5 in various SMA-based DMPC-nanodiscs: (a) schematic representation of a negatively charged ~16 kDa rabbit cytochrome-b5 reconstituted in negatively charged SMA-EA-based DMPC-nanodiscs. (b) Static light scattering (SLS) profiles of cationic SMA-QA-based DMPC-nanodiscs containing cytochrome-b5 at low (100 mM) and high (500 mM) NaCl concentrations. (c) Projections of 2D 1H/15N TROSY-HSQC NMR spectra of a uniformly-15N-labelled cytochrome-b5 reconstituted in SMALP (d), SMA-QA with 100 mM NaCl (e), SMA-QA with 500 mM NaCl (f), and SMA-EA (g) DMPC-nanodiscs. The presence of aggregates in the sample containing 100 mM NaCl, indicated by the SLS profile in (b), explains the reason for the absence of resonances in the 2D NMR spectrum (e). On the other hand, the appearance of NMR resonance in (f) (and the SLS profile) due to the use of a high concentration of NaCl confirms the formation of non-specific charge-charge coulombic interactions between the positively-charged SMA-QA polymer belt and the negatively-charged cytochrome-b5. Although the use of high salt concentration enables NMR data acquisition, it is not physiologically relevant. It can damage proteins in NMR samples by causing serious radio-frequency-induced heating in the sample to. This Figure and caption are adopted from reference [199].
Figure 13
Figure 13
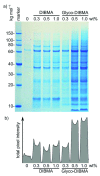
Isolation of the membrane proteome of E. coli cells into polymer-nanodiscs using Glyco-DIBMA and DIBMA polymers. Shown are (a) a Coomassie-stained gel after SDS-PAGE of polymer-solubilized membrane fractions and (b) a projection of the total pixel intensity across all lanes in the SDS-PAGE gel. Insoluble cell debris and water-soluble proteins were removed by centrifugation, and samples were gently agitated overnight at 23 °C in the presence of Glyco-DIBMA or DIBMA. Prior to SDS-PAGE, insoluble material and polymer were removed by ultracentrifugation and organic solvent extraction, respectively. A control without polymers was produced under otherwise identical conditions. This Figure and caption are adopted from reference [107].
Figure 15
Figure 15
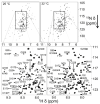
2D [1H–15N]-TROSY-HSQC NMR spectra of 75 μM 15N-labelled FBD in nanodiscs recorded at an 800 MHz NMR spectrometer. For easy reading, expanded regions are shown below, highlighting a few peaks with a substantial signal improvement at higher temperature (32 °C). The observation of well dispersed NMR spectral lines demonstrate the absence of any interaction between the polymer belt and FBD. Figure and caption are adopted from reference [58].
Figure 16
Figure 16
(a) UV-visible absorbance spectra of pentyl-inulin, DIBMA, SMAEA, and SL25010 polymers. Pentyl-inulin showed no absorbance in the 230–700 nm wavelength range. Due to aromatic rings, both SMA-based polymers SMA-EA and SL25010 showed substantial absorbance near 260 nm wavelength. (b) SDS-PAGE analysis of (lane-1) ~10 kDa SMA25010, (lane-2) ~2 kDa SMA-EA, (lane-3) ~12 kDa DIBMA, and (lane-4) ~3 kDa pentyl-inulin. This Figure and caption are adopted from reference [58].

Similar articles

Cited by

References

    1. Fagerberg L., Jonasson K., von Heijne G., Uhlén M., Berglund L. Prediction of the human membrane proteome. Proteomics. 2010;10:1141–1149. doi: 10.1002/pmic.200900258. - DOI - PubMed
    1. Overington J.P., Al-Lazikani B., Hopkins A.L. How many drug targets are there? Nat. Rev. Drug Discov. 2006;5:993–996. doi: 10.1038/nrd2199. - DOI - PubMed
    1. Dilworth M.V., Piel M.S., Bettaney K.E., Ma P., Luo J., Sharples D., Poyner D.R., Gross S.R., Moncoq K., Henderson P.J.F., et al. Microbial expression systems for membrane proteins. Methods. 2018;147:3–39. doi: 10.1016/j.ymeth.2018.04.009. - DOI - PubMed
    1. Bernaudat F., Frelet-Barrand A., Pochon N., Dementin S., Hivin P., Boutigny S., Rioux J.-B., Salvi D., Seigneurin-Berny D., Richaud P., et al. Heterologous expression of membrane proteins: Choosing the appropriate host. PLoS ONE. 2011;6:e29191. doi: 10.1371/journal.pone.0029191. - DOI - PMC - PubMed
    1. Schlegel S., Hjelm A., Baumgarten T., Vikström D., de Gier J.W. Bacterial-based membrane protein production. BBA-Mol. Cell Res. 2014;1843:1739–1749. doi: 10.1016/j.bbamcr.2013.10.023. - DOI - PubMed

Publication types

LinkOut - more resources