

In Silico Pleiotropy Analysis in KEGG Signaling Networks Using a Boolean Network Model
- PMID: 36009032
- PMCID: PMC9406064
- DOI: 10.3390/biom12081139
In Silico Pleiotropy Analysis in KEGG Signaling Networks Using a Boolean Network Model
Abstract
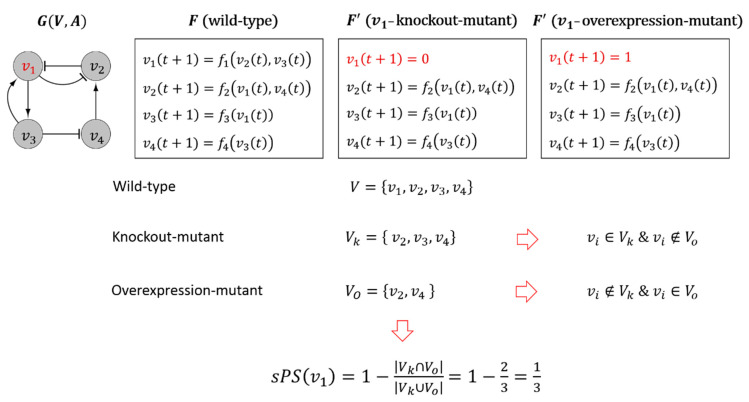
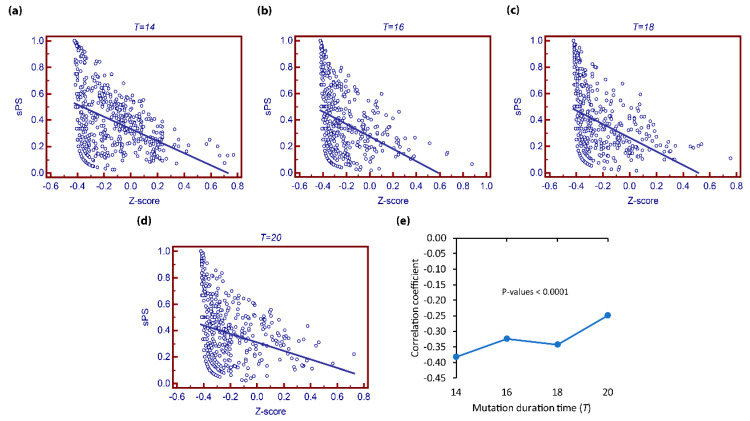
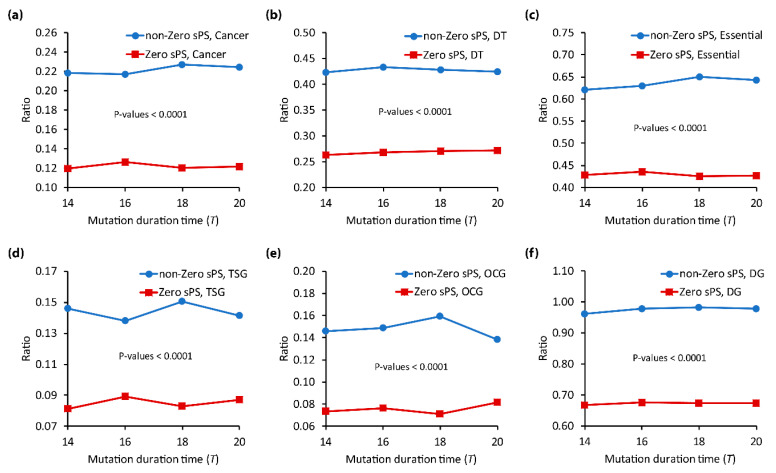
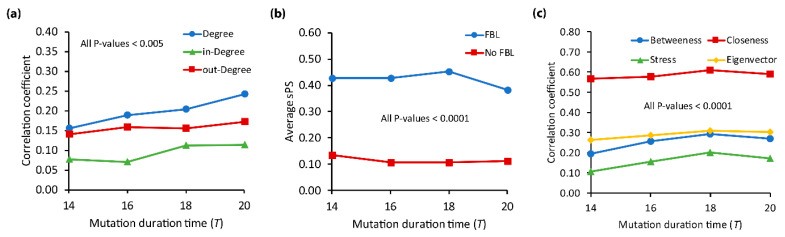
Pleiotropy, which refers to the ability of different mutations on the same gene to cause different pathological effects in human genetic diseases, is important in understanding system-level biological diseases. Although some biological experiments have been proposed, still little is known about pleiotropy on gene-gene dynamics, since most previous studies have been based on correlation analysis. Therefore, a new perspective is needed to investigate pleiotropy in terms of gene-gene dynamical characteristics. To quantify pleiotropy in terms of network dynamics, we propose a measure called in silico Pleiotropic Scores (sPS), which represents how much a gene is affected against a pair of different types of mutations on a Boolean network model. We found that our model can identify more candidate pleiotropic genes that are not known to be pleiotropic than the experimental database. In addition, we found that many types of functionally important genes tend to have higher sPS values than other genes; in other words, they are more pleiotropic. We investigated the relations of sPS with the structural properties in the signaling network and found that there are highly positive relations to degree, feedback loops, and centrality measures. This implies that the structural characteristics are principles to identify new pleiotropic genes. Finally, we found some biological evidence showing that sPS analysis is relevant to the real pleiotropic data and can be considered a novel candidate for pleiotropic gene research. Taken together, our results can be used to understand the dynamics pleiotropic characteristics in complex biological systems in terms of gene-phenotype relations.
Keywords: Boolean network dynamics; feedback loops; gene–gene interactions; pleiotropy; signaling networks.
Conflict of interest statement
The authors declare no conflicts of interest.
Figures
Similar articles
-
Quantifying pleiotropy through directed signaling networks: A synchronous Boolean network approach and in-silico pleiotropic scoring.Biosystems. 2025 Apr;250:105416. doi: 10.1016/j.biosystems.2025.105416. Epub 2025 Feb 21. Biosystems. 2025. PMID: 39988275
-
Construction and analysis of gene-gene dynamics influence networks based on a Boolean model.BMC Syst Biol. 2017 Dec 21;11(Suppl 7):133. doi: 10.1186/s12918-017-0509-y. BMC Syst Biol. 2017. PMID: 29322926 Free PMC article.
-
Inferring gene function and network organization in Drosophila signaling by combined analysis of pleiotropy and epistasis.G3 (Bethesda). 2013 May 20;3(5):807-14. doi: 10.1534/g3.113.005710. G3 (Bethesda). 2013. PMID: 23550134 Free PMC article.
-
Statistical Analysis of Multiple Phenotypes in Genetic Epidemiologic Studies: From Cross-Phenotype Associations to Pleiotropy.Am J Epidemiol. 2018 Apr 1;187(4):855-863. doi: 10.1093/aje/kwx296. Am J Epidemiol. 2018. PMID: 29020254 Free PMC article. Review.
-
Pleiotropy and the evolution of floral integration.New Phytol. 2016 Jan;209(1):80-5. doi: 10.1111/nph.13583. Epub 2015 Jul 30. New Phytol. 2016. PMID: 26224529 Review.
Cited by
-
Network analysis reveals that the tumor suppressor lncRNA GAS5 acts as a double-edged sword in response to DNA damage in gastric cancer.Sci Rep. 2022 Oct 31;12(1):18312. doi: 10.1038/s41598-022-21492-x. Sci Rep. 2022. PMID: 36316351 Free PMC article.
-
Leveraging pleiotropy for the improved treatment of psychiatric disorders.Mol Psychiatry. 2025 Feb;30(2):705-721. doi: 10.1038/s41380-024-02771-7. Epub 2024 Oct 10. Mol Psychiatry. 2025. PMID: 39390223 Free PMC article. Review.
References
Publication types
MeSH terms
LinkOut - more resources
Full Text Sources
