Altered Development of Prefrontal GABAergic Functions and Anxiety-like Behavior in Adolescent Offspring Induced by Prenatal Stress
- PMID: 36009078
- PMCID: PMC9406165
- DOI: 10.3390/brainsci12081015
Altered Development of Prefrontal GABAergic Functions and Anxiety-like Behavior in Adolescent Offspring Induced by Prenatal Stress
Abstract
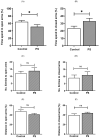
Maternal stress can afflict fetal brain development, putting the offspring at risk of cognitive deficits, including anxiety. The prefrontal cortex (PFC), a protracted maturing region, is notably affected by prenatal stress (PS). However, it remains unclear how PS interferes with the maturation of the GABAergic system, considering its functional adjustment in the PFC during adolescence. The present study thus investigated the long-lasting consequences of PS on the prefrontal GABAergic functions of adolescent offspring. Pregnant Sprague-Dawley rats were divided into controls and the PS group, which underwent restraint stress during the last week of gestation. Male pups from postnatal days (PND) 40-42 were submitted to the elevated plus maze (EPM) test. Proteins essentially involved in GABAergic signaling were then examined in PFC tissues, including the K+-Cl- cotransporter (KCC2), Na+-K+-Cl- cotransporter (NKCC1), α1 and α5 subunits of GABA type A receptors (GABAA receptors), and parvalbumin (PV), along with cAMP response element-binding protein phosphorylation (pCREB), which reacts in the plasticity regulation of PV-positive interneurons. The results revealed that the higher anxiety-like behavior of PS adolescent rats concurred with the significant decreases of the KCC2 and α1 subunits, with PV- and pCREB-lowered levels. The findings suggested that PS disrupts the continuance of PFC maturity by reducing the essential elements of GABAergic functions. These changes likely underlie the anxiety emerging in adolescence, possibly progressing to mental disorders.
Keywords: GABAergic functions; adolescence; anxiety; prefrontal cortex; prenatal stress.
Conflict of interest statement
The authors declare no conflict of interest.
Figures


Similar articles
-
Maternal restraint stress delays maturation of cation-chloride cotransporters and GABAA receptor subunits in the hippocampus of rat pups at puberty.Neurobiol Stress. 2015 Dec 14;3:1-7. doi: 10.1016/j.ynstr.2015.12.001. eCollection 2016 Jun. Neurobiol Stress. 2015. PMID: 26844244 Free PMC article.
-
Emergence of GABAergic-dependent regulation of input-specific plasticity in the adult rat prefrontal cortex during adolescence.Psychopharmacology (Berl). 2014 Apr;231(8):1789-96. doi: 10.1007/s00213-013-3216-4. Epub 2013 Aug 2. Psychopharmacology (Berl). 2014. PMID: 23907651 Free PMC article.
-
Adolescent Stress Disrupts the Maturation of Anxiety-related Behaviors and Alters the Developmental Trajectory of the Prefrontal Cortex in a Sex- and Age-specific Manner.Neuroscience. 2018 Oct 15;390:265-277. doi: 10.1016/j.neuroscience.2018.08.030. Epub 2018 Sep 1. Neuroscience. 2018. PMID: 30179643
-
Involvement of NR1, NR2A different expression in brain regions in anxiety-like behavior of prenatally stressed offspring.Behav Brain Res. 2013 Nov 15;257:1-7. doi: 10.1016/j.bbr.2013.08.044. Epub 2013 Sep 9. Behav Brain Res. 2013. PMID: 24029697 Review.
-
Prenatal stress and increased susceptibility to anxiety-like behaviors: role of neuroinflammation and balance between GABAergic and glutamatergic transmission.Stress. 2021 Sep;24(5):481-495. doi: 10.1080/10253890.2021.1942828. Epub 2021 Jun 28. Stress. 2021. PMID: 34180763 Review.
Cited by
-
Pharmacodynamics study of remimazolam besylate in anxious patients undergoing gastroscopy: a biased-coin design up-and-down sequential allocation trial.BMC Anesthesiol. 2025 Jul 29;25(1):363. doi: 10.1186/s12871-025-03235-3. BMC Anesthesiol. 2025. PMID: 40731317 Free PMC article. Clinical Trial.
References
-
- Van den Bergh B.R.H., van den Heuvel M.I., Lahti M., Braeken M., de Rooij S.R., Entringer S., Hoyer D., Roseboom T., Räikkönen K., King S., et al. Prenatal developmental origins of behavior and mental health: The influence of maternal stress in pregnancy. Neurosci. Biobehav. Rev. 2020;117:26–64. doi: 10.1016/j.neubiorev.2017.07.003. - DOI - PubMed
Grants and funding
LinkOut - more resources
Full Text Sources
Miscellaneous

