

Modeling Aversion Resistant Alcohol Intake in Indiana Alcohol-Preferring (P) Rats
- PMID: 36009105
- PMCID: PMC9406111
- DOI: 10.3390/brainsci12081042
Modeling Aversion Resistant Alcohol Intake in Indiana Alcohol-Preferring (P) Rats
Abstract
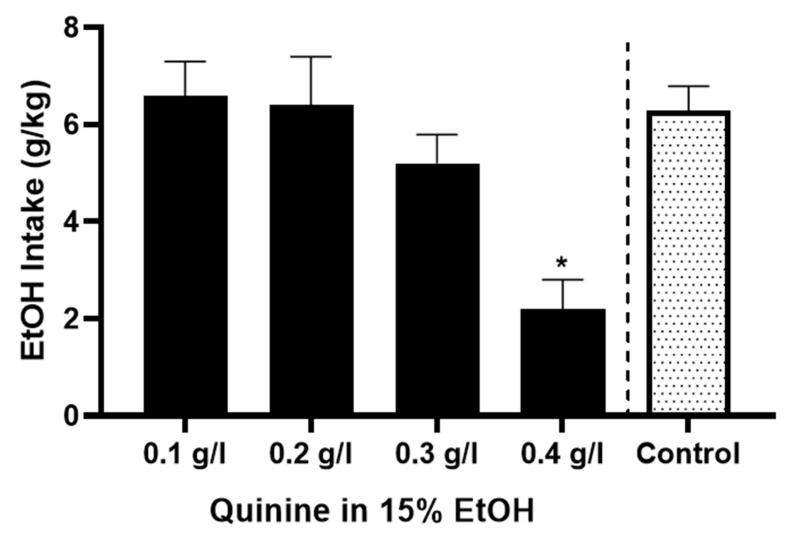
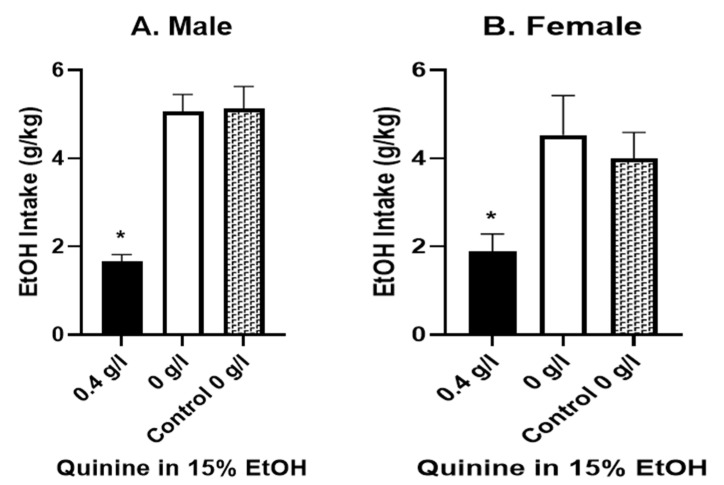
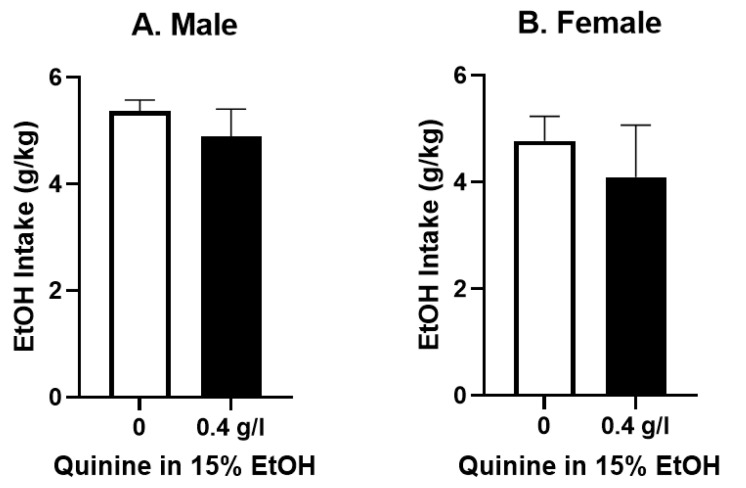
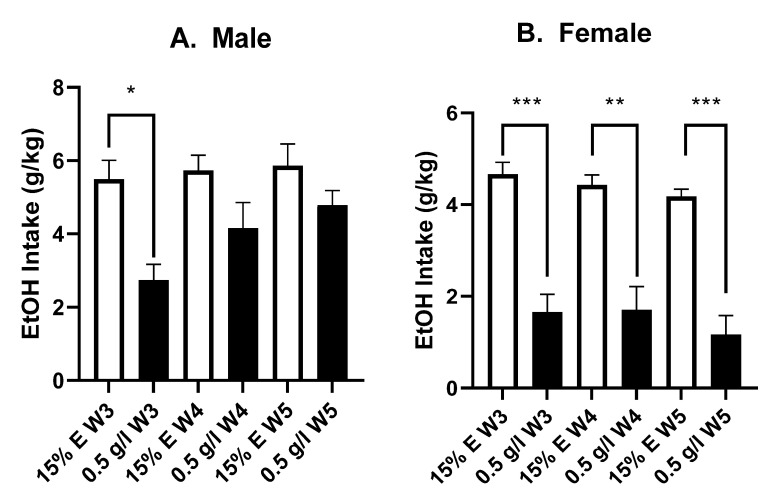
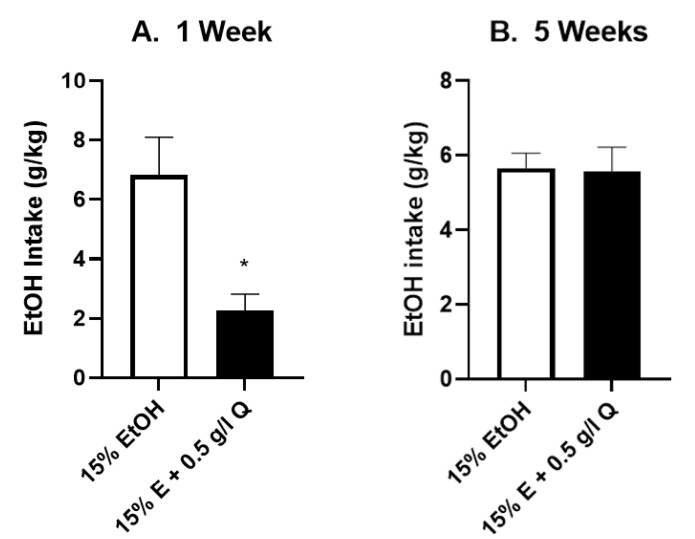
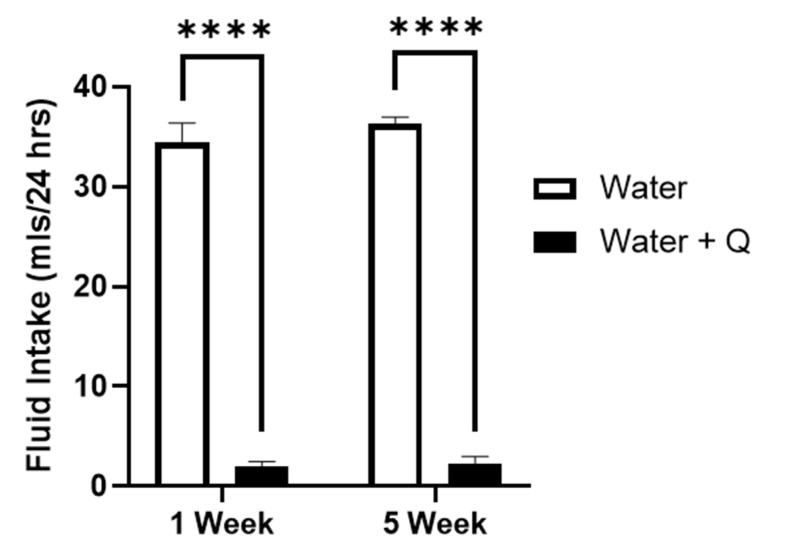
With the substantial social and medical burden of addiction, there is considerable interest in understanding risk factors that increase the development of addiction. A key feature of alcohol use disorder (AUD) is compulsive alcohol (EtOH) drinking, where EtOH drinking becomes “inflexible” after chronic intake, and animals, such as humans with AUD, continue drinking despite aversive consequences. Further, since there is a heritable component to AUD risk, some work has focused on genetically-selected, EtOH-preferring rodents, which could help uncover critical mechanisms driving pathological intake. In this regard, aversion-resistant drinking (ARD) takes >1 month to develop in outbred Wistar rats (and perhaps Sardinian-P EtOH-preferring rats). However, ARD has received limited study in Indiana P-rats, which were selected for high EtOH preference and exhibit factors that could parallel human AUD (including front-loading and impulsivity). Here, we show that P-rats rapidly developed compulsion-like responses for EtOH; 0.4 g/L quinine in EtOH significantly reduced female and male intake on the first day of exposure but had no effect after one week of EtOH drinking (15% EtOH, 24 h free-choice paradigm). Further, after 4−5 weeks of EtOH drinking, males but not females showed resistance to even higher quinine (0.5 g/L). Thus, P-rats rapidly developed ARD for EtOH, but only males developed even stronger ARD with further intake. Finally, rats strongly reduced intake of quinine-adulterated water after 1 or 5 weeks of EtOH drinking, suggesting no changes in basic quinine sensitivity. Thus, modeling ARD in P-rats may provide insight into mechanisms underlying genetic predispositions for compulsive drinking and lead to new treatments for AUDs.
Keywords: addiction; alcohol preference; alcoholism; compulsive drinking; gender studies; genetic model; selected lines.
Conflict of interest statement
The authors declare no conflict of interest.
Figures
Similar articles
-
Animal models of compulsion alcohol drinking: Why we love quinine-resistant intake and what we learned from it.Front Psychiatry. 2023 Mar 24;14:1116901. doi: 10.3389/fpsyt.2023.1116901. eCollection 2023. Front Psychiatry. 2023. PMID: 37032937 Free PMC article. Review.
-
Assessing initial/early aversion-resistant drinking across male and female alcohol-preferring and non-preferring rats.Alcohol Clin Exp Res (Hoboken). 2025 Feb;49(2):476-487. doi: 10.1111/acer.15518. Epub 2024 Dec 26. Alcohol Clin Exp Res (Hoboken). 2025. PMID: 39725675 Free PMC article.
-
Sex Differences in Binge-Like and Aversion-Resistant Alcohol Drinking in C57BL/6J Mice.Alcohol Clin Exp Res. 2019 Feb;43(2):243-249. doi: 10.1111/acer.13923. Epub 2018 Dec 9. Alcohol Clin Exp Res. 2019. PMID: 30431655
-
Increased Responding for Alcohol and Resistance to Aversion in Female Mice.Alcohol Clin Exp Res. 2020 Jul;44(7):1400-1409. doi: 10.1111/acer.14384. Epub 2020 Jun 18. Alcohol Clin Exp Res. 2020. PMID: 32472651
-
Rodent models for compulsive alcohol intake.Alcohol. 2014 May;48(3):253-64. doi: 10.1016/j.alcohol.2014.03.001. Epub 2014 Mar 27. Alcohol. 2014. PMID: 24731992 Free PMC article. Review.
Cited by
-
The role of beta- and alpha-adrenergic receptors on alcohol drinking.Neuropharmacology. 2023 Aug 15;234:109545. doi: 10.1016/j.neuropharm.2023.109545. Epub 2023 Apr 25. Neuropharmacology. 2023. PMID: 37100382 Free PMC article.
-
Drinking history dependent functionality of the dorsolateral striatum on gating alcohol and quinine-adulterated alcohol front-loading and binge drinking.Alcohol. 2022 Dec;105:43-51. doi: 10.1016/j.alcohol.2022.09.005. Epub 2022 Oct 12. Alcohol. 2022. PMID: 36240946 Free PMC article.
-
Different mechanisms underlie compulsive alcohol self-administration in male and female rats.Biol Sex Differ. 2024 Feb 17;15(1):17. doi: 10.1186/s13293-024-00592-5. Biol Sex Differ. 2024. PMID: 38368341 Free PMC article.
-
Non-Consummatory Behavior Signals Predict Aversion-Resistant Alcohol Drinking in Head-Fixed Mice.bioRxiv [Preprint]. 2023 Oct 5:2023.06.20.545767. doi: 10.1101/2023.06.20.545767. bioRxiv. 2023. Update in: Neuropharmacology. 2024 Jan 1;242:109762. doi: 10.1016/j.neuropharm.2023.109762. PMID: 37873153 Free PMC article. Updated. Preprint.
-
Animal models of compulsion alcohol drinking: Why we love quinine-resistant intake and what we learned from it.Front Psychiatry. 2023 Mar 24;14:1116901. doi: 10.3389/fpsyt.2023.1116901. eCollection 2023. Front Psychiatry. 2023. PMID: 37032937 Free PMC article. Review.
References
-
- CDC . Excessive Drinking Costs U.S. $223.5 Billion. Center for Disease Control; Atlanta, GA, USA: 2014.
Grants and funding
LinkOut - more resources
Full Text Sources
