. 2022 Jul 27;11(8):1463.
doi: 10.3390/antiox11081463.

Unraveling the Effects of Carotenoids Accumulation in Human Papillary Thyroid Carcinoma

Affiliations

Unraveling the Effects of Carotenoids Accumulation in Human Papillary Thyroid Carcinoma

Alessandra di Masi et al. Antioxidants (Basel). .

Abstract

Among the thyroid cancers, papillary thyroid cancer (PTC) accounts for 90% of the cases. In addition to the necessity to identify new targets for PTC treatment, early diagnosis and management are highly demanded. Previous data indicated that the multivariate statistical analysis of the Raman spectra allows the discrimination of healthy tissues from PTC ones; this is characterized by bands typical of carotenoids. Here, we dissected the molecular effects of carotenoid accumulation in PTC patients by analyzing whether they were required to provide increased retinoic acid (RA) synthesis and signaling and/or to sustain antioxidant functions. HPLC analysis revealed the lack of a significant difference in the overall content of carotenoids. For this reason, we wondered whether the carotenoid accumulation in PTC patients could be related to vitamin A derivative retinoic acid (RA) biosynthesis and, consequently, the RA-related pathway activation. The transcriptomic analysis performed using a dedicated PCR array revealed a significant downregulation of RA-related pathways in PTCs, suggesting that the carotenoid accumulation in PTC could be related to a lower metabolic conversion into RA compared to that of healthy tissues. In addition, the gene expression profile of 474 PTC cases previously published in the framework of the Cancer Genome Atlas (TGCA) project was examined by hierarchical clustering and heatmap analyses. This metanalysis study indicated that the RA-related pathways resulted in being significantly downregulated in PTCs and being associated with the follicular variant of PTC (FV-PTC). To assess whether the possible fate of the carotenoids accumulated in PTCs is associated with the oxidative stress response, the expression of enzymes involved in ROS scavenging was checked. An increased oxidative stress status and a reduced antioxidant defense response were observed in PTCs compared to matched healthy thyroids; this was possibly associated with the prooxidant effects of high levels of carotenoids. Finally, the DepMap datasets were used to profile the levels of 225 metabolites in 12 thyroid cancer cell lines. The results obtained suggested that the high carotenoid content in PTCs correlates with tryptophan metabolism. This pilot provided novel possible markers and possible therapeutic targets for PTC diagnosis and therapy. For the future, a larger study including a higher number of PTC patients will be necessary to further validate the molecular data reported here.

Keywords: antioxidant; carotenoid; papillary thyroid cancer; retinoic acid.


Conflict of interest statement

The authors declare no conflict of interest.

Figures

Figure 1
Figure 1
HPLC profiles of carotenoids recorded in the healthy and tumoral thyroid lobes of PTC patients. (A) Representative carotenoids HPLC chromatogram: (1) lutein; (2) unknown 1; (3) unknown 2; (4) unknown 3; (5) unknown 4; (6) α-carotene; (7) β-carotene; (8) unknown 5; (9) unknown 6; (10) unknown 7; (11 and 12) lycopene. (B) Mean values of α-carotene, β-carotene, lutein, and lycopene concentrations (ng/g of thyroid tissue) quantified in the healthy and pathological lobes of the thyroids derived from four PTC patients (i.e., TIR22, TIR54, TIR77, and TIR94), together with seven unidentified peaks attributable to molecules with absorbances measured at 450 and 472 nm.
Figure 2
Figure 2
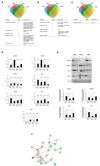
Transcriptome data analysis derived from PTC patients. Four PTC patients (i.e., TIR48, TIR50, TIR70, and TIR94) were analyzed by comparing the healthy and pathological lobes. (A) Venn diagram of the differentially expressed genes (DEGs) that were found significantly modulated in the four PTC patients analyzed. Twenty-three DEGs were found significantly modulated in all four of the patients, and a further 27 DEGs were found modulated in at least three patients (foldchange (FC)| >1.5|). (B) Venn diagram of the significantly down-regulated DEGs. Among the overall 23 transcripts significantly downregulated, five were found downregulated in all the three PTC analyzed patients and 18 were downregulated in at least three out of four PTC patients. (C) Venn diagram of the only significantly up-regulated DEG. Venn diagrams were calculated and drawn using the software available at the Bioinformatics & Evolutionary Genomics website (http://bioinformatics.psb.ugent.be/webtools/Venn/; accessed on 13 January 2022). (D) To validate DEGs, RT-qPCR experiments were performed using the RNA extracted from the healthy and PTC lobes of TIR48, TIR50, TIR70, and TIR94 patients. The expression levels of CRABP2, CYP26B1, DHRS3, RARγ, RDH10, RET, and RXRß genes have been reported as relative quantity in the PTC lobe with respect to the healthy one for each patient analyzed, according to the 2−ΔΔCt method. Data are reported as mean ±SD of experiments repeated at least three times (Student’s t-test, **** p < 0.0001, *** p < 0.001, with respect to the relative healthy lobe). (E) To validate DEGs, immunoblot experiments were performed using the protein lysates derived from the healthy and PTC lobes of TIR45, TIR46, and TIR48 patients. The expression levels of ALDH1A, CRABP2, DH10, and RARα proteins in the PTCs lobes have been normalized to the healthy lobe of each patient analyzed. Both representative images of the immunoblot and their quantification are reported. Graphs illustrate the mean ± SD of experiments repeated at least three times (Student’s two-tailed t-test, * p < 0.05; ** p < 0.01; *** p < 0.001, with respect to the relative healthy lobe). (F) Protein–protein interactions network involving the DEGs significantly modulated in the PTC patients were identified using the STRING database. A PPI network with 22 interaction pairs of the DEGs was identified.
Figure 3
Figure 3
Gene expression metanalysis of external datasets using the RA-regulated genes. (A) Hierarchical clustering of “Human Retinoid Acid Pathway”-regulated genes in the framework of the TCGA-PTC dataset representing 474 PTC cases [22]. (B) Contingency analysis of PTC subtype distribution in CL1 or CL2 samples as in (A). Significance was calculated by the Likelihood Ratio test (JMP 16.0; SAS).
Figure 4
Figure 4
Oxidative stress and antioxidant response in PTCs. To evaluate the oxidative stress levels and the antioxidant response, protein lysates obtained from patients TIR45, TIR46, and TIR48 were analyzed by immunoblot. (A) Representative immunoblots are reported together with the relative quantification of pSer139-H2AX (γH2AX) and OGG1 proteins expression normalized to β-actin. Violin plots represent the mean value ±SD of the expression of each protein normalized to the healthy counterparts, in the three analyzed patients (Student’s t-test, * p < 0.05; ** p < 0.01 with respect to healthy lobes). (B) Representative immunoblots are reported together with the relative quantification of CAT, GpX-4, HO-1, NOX-4, NQO-1, and SOD-1 proteins expression normalized to β-actin. Violin plots represent the mean value ± SD of expression of each protein normalized to the healthy counterparts, in the three analyzed patients (Student’s t-test, * p < 0.05; ** p < 0.01 with respect to healthy lobes).
Figure 5
Figure 5
Dissection of the metabolic status of PTCs. We extrapolated from the DepMap portal (https://depmap.org/portal/; accessed on 31 January 2022) the profile of 225 metabolites in 12 thyroid cancer cell lines (i.e., three PTC (i.e., SW579, BCPAP, and BHT101), four FTC (i.e., CGTHW1, FTC238, ML1, TT2609C02), four anaplastic (i.e., 8305C, 8505C, CAL62; FTC133), one medullary (i.e., TT), and one thyroid sarcoma (i.e., S117)). Some of the metabolites involved in tryptophan metabolism (i.e., anthranilic acid, NAD, 6-phosphogluconate, adenine, and PEP) were found significantly higher in PTC cells compared to all the other thyroid cancer cell lines. Each dot in the plots represents the measured value of the indicated metabolite in one single thyroid cancer cell line (Student’s t-test, * p < 0.05 with respect to healthy lobes). Crude and analyzed data are given in Supplementary Tables S7 and S8.

References

    1. Kitahara C.M., Sosa J.A. Understanding the ever-changing incidence of thyroid cancer. Nat. Rev. Endocrinol. 2020;16:617–618. doi: 10.1038/s41574-020-00414-9. - DOI - PMC - PubMed
    1. Rossi E.D., Pantanowitz L., Hornick J.L. A worldwide journey of thyroid cancer incidence centred on tumour histology. Lancet Diabetes Endocrinol. 2021;9:193–194. doi: 10.1016/S2213-8587(21)00049-8. - DOI - PubMed
    1. Fagin J.A., Wells S.A., Jr. Biologic and Clinical Perspectives on Thyroid Cancer. N. Engl. J. Med. 2016;375:1054–1067. doi: 10.1056/NEJMra1501993. - DOI - PMC - PubMed
    1. Sbroscia M., Di Gioacchino M., Ascenzi P., Crucitti P., Di Masi A., Giovannoni I., Longo F., Mariotti D., Naciu A.M., Palermo A., et al. Thyroid cancer diagnosis by Raman spectroscopy. Sci. Rep. 2020;10:13342. doi: 10.1038/s41598-020-70165-0. - DOI - PMC - PubMed
    1. Sodo A., Verri M., Palermo A., Naciu A.M., Sponziello M., Durante C., Di Gioacchino M., Paolucci A., Di Masi A., Longo F., et al. Raman Spectroscopy Discloses Altered Molecular Profile in Thyroid Adenomas. Diagnostics. 2021;11:43. doi: 10.3390/diagnostics11010043. - DOI - PMC - PubMed

LinkOut - more resources