. 2022 Jul 31;11(8):1505.
doi: 10.3390/antiox11081505.

Mitochondria Targeted Antioxidant Significantly Alleviates Preeclampsia Caused by 11β-HSD2 Dysfunction via OPA1 and MtDNA Maintenance

Affiliations

Mitochondria Targeted Antioxidant Significantly Alleviates Preeclampsia Caused by 11β-HSD2 Dysfunction via OPA1 and MtDNA Maintenance

Jing Long et al. Antioxidants (Basel). .

Abstract

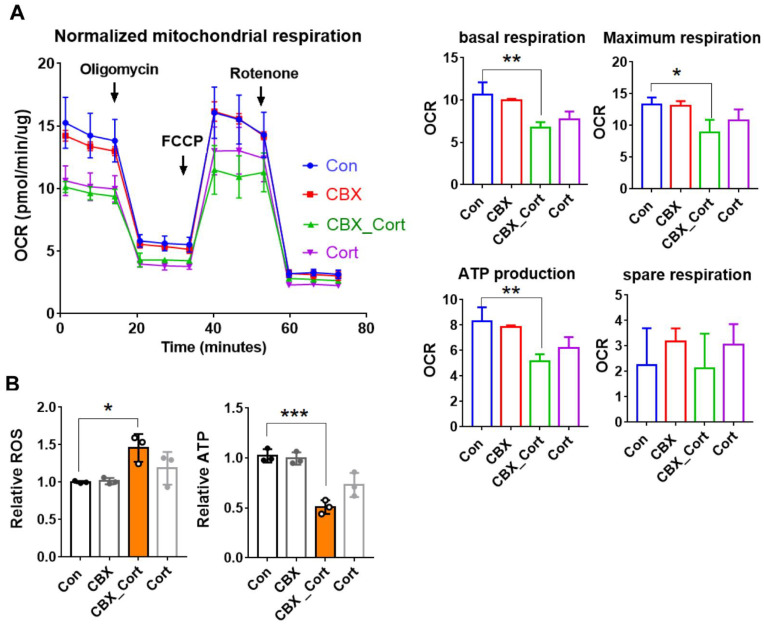
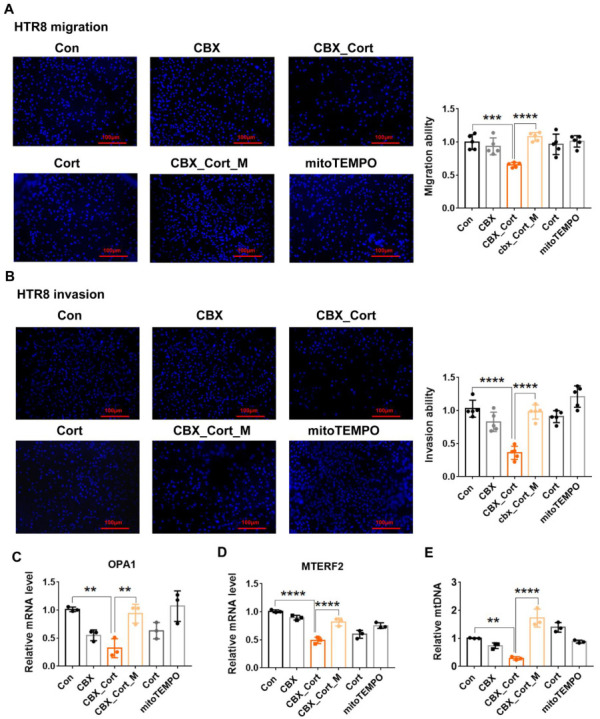
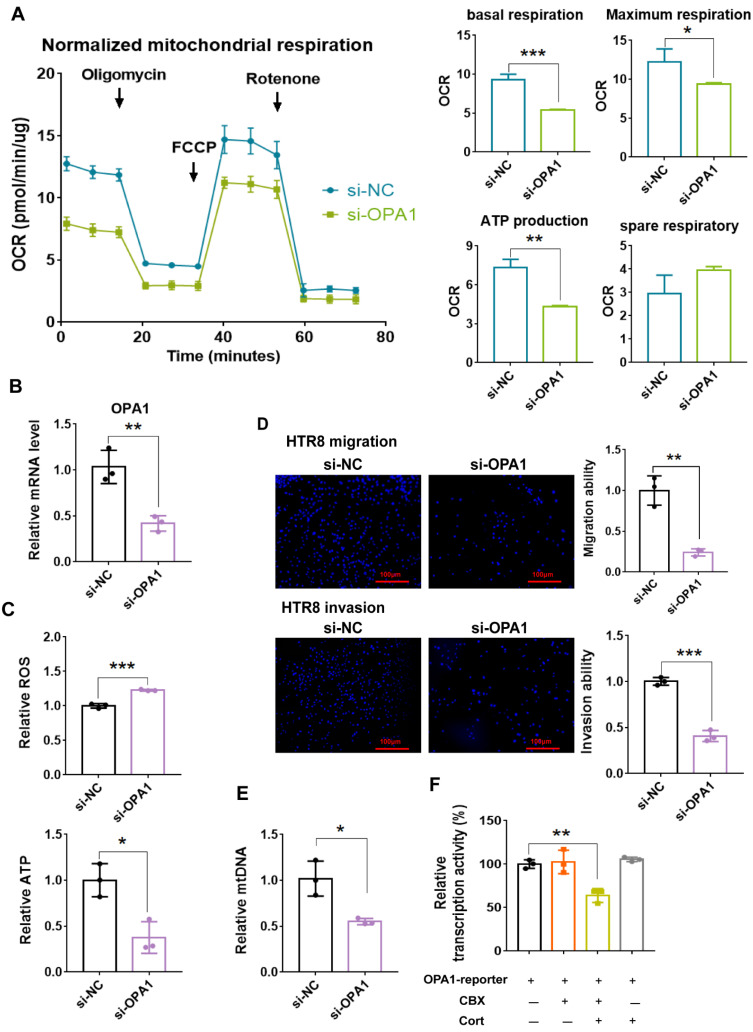
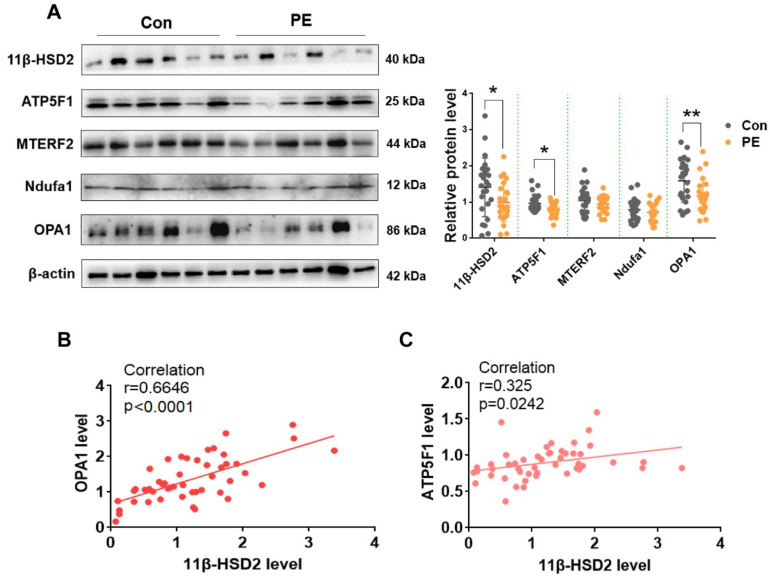
We have previously demonstrated that placental 11β-hydroxysteroid dehydrogenase type 2 (11β-HSD2) dysfunction contributes to PE pathogenesis. We sought to elucidate molecular mechanisms underlying 11β-HSD2 dysfunction-induced PE and to seek potential therapeutic targets using a 11β-HSD2 dysfunction-induced PE-like rat model as well as cultured extravillous trophoblasts (EVTs) since PE begins with impaired function of EVTs. In 11β-HSD2 dysfunction-induced PE-like rat model, we revealed that placental mitochondrial dysfunction occurred, which was associated with mitDNA instability and impaired mitochondrial dynamics, such as decreased optic atrophy 1 (OPA1) expression. MitoTEMPO treatment significantly alleviated the hallmark of PE-like features and improved mitDNA stability and mitochondrial dynamics in the placentas of rat PE-like model. In cultured human EVTs, we found that 11β-HSD2 dysfunction led to mitochondrial dysfunction and disrupted mtDNA stability. MitoTEMPO treatment improved impaired invasion and migration induced by 11β-HSD2 dysfunction in cultured EVTs. Further, we revealed that OPA1 was one of the key factors that mediated 11β-HSD2 dysfunction-induced excess ROS production, mitochondrial dysfunction and mtDNA reduction. Our data indicates that 11β-HSD2 dysfunction causes mitochondrial dysfunctions, which impairs trophoblast function and subsequently results in PE development. Our study immediately highlights that excess ROS is a potential therapeutic target for PE.

Keywords: OXPHOS; mitochondria; mtDNA; placenta; preeclampsia.


Conflict of interest statement

The authors declare no conflict of interest.

Figures

Figure 1
Figure 1
Transcriptomics and metabolomics of the placentas in rat PE−like model. Pregnant rats were administrated with CBX or saline from GD 7.5 to GD 17.5. The placentas were collected on GD 20.5 for RNA-seq and untargeted metabolomics. (A) volcano plot of differential genes in RNA-Seq between PE-like rats and controls. Orange: genes associated with PE. Blue: genes in OXPHOS, TCA cycle and glutathione metabolism. n = 5 in each group. (B) Cluster heat map of the differential metabolites. n = 8 in each group. (C) KEGG enrichment analysis combined with transcriptomics and metabolomics. Con: control. Tran: transcriptomics; Met: metabolomics.
Figure 2
Figure 2
OXPHOS and mitochondrial functions are impaired in the placentas of PE-like model and mitoTEMPO treatment reverses them. Pregnant rats were administrated with CBX or saline from GD 7.5 to GD 17.5. The rats were sacrificed on GD 20.5, and the placentas were collected for analysis of mRNA and protein expression of various genes, targeted metabolomics and morphology. (A) the mRNA of the gene in OXPHOS electron transport chain components. (B) the protein levels of the gene in OXPHOS electron transport chain components. Left panel: representative images of Western blotting. Right panel: cumulative data of each protein expression level. (C) targeted metabolomics analysis of central carbon metabolism. Statistical chart shows peak area abundance of significantly altered metabolites in TCA cycle. (D) mitochondrial function assay of ROS, ATP and MMP. (E) electron microscope analysis of placental tissue. Representative images of electron microscope (10,000×). Red arrow: mitochondria. * p  <  0.05, ** p  <  0.01, *** p  <  0.001, **** p  <  0.0001. Con: control.
Figure 3
Figure 3
MitoTEMPO alleviates PE-like feature and improves placental blood flow and placentation in PE-like model. Pregnant rats were administrated with CBX, CBX combined with mitoTEMPO or saline from GD 7.5 to GD 17.5. Urine was collected from GD 18.5 to GD 19.5. After determination of arterial BP, the rats were sacrificed on GD 20.5 for collection of blood and tissues. (A) MAP measured from GD 9.5 until GD 17.5. (B) SBP measured on GD 20.5. (C) the circulatory sFlt1 and sEng levels in the rat model. (D) protein/creatinine (mg/mg) in urine in the rat model. (E) morphology of glomeruli stained by H&E and PAS. Left panel: the representative images (400×). Right panel: histopathological score of glomerular pathology. (F) fetal and placental weight from 8 dams (each group) measured on GD 20.5. It represents as individual fetal or placental weight and mean fetal and placental weight from each dam. (G) Doppler ultrasonography. Upper panel: the representative images of SA in implantation sites, canal in placentas and fetal UmbA visualized by ultrasound biomicroscopy. Lower panel: cumulative data of the PSV of SA, Canal and UmbA. (H) placental morphology, placental vasculature network and SP remodeling in the rat model. Representative H&E images of labyrinth zone (400×), representative immunofluorescence image of CD31 (100×), representative image of CK7 staining in SA, and representative image of α-SMA staining in SA (200×). * p  <  0.05, ** p  <  0.01, *** p  <  0.001, **** p  <  0.0001. Con: control; CBX_M: CBX combined with mitoTEMPO treatment.
Figure 4
Figure 4
MitoTEMPO improves MtDNA stability and mitochondrial dynamics in the placentas of PE-like model. Pregnant rats were administrated with CBX, CBX combined with mitoTEMPO or saline from GD 7.5 to GD 17.5. The rats were sacrificed on GD 20.5 for collection of blood and placental tissues. (A) the transcriptional levels of the genes that control mtDNA maintenance. Left panel: heatmap of the genes related to mtDNA maintenance in RNA-seq. Right panel: cumulative data of Q-PCR analysis. (B) MTERF2 protein expression level. (C) mtDNA copy number. (D) the mRNA levels of mitochondrial dynamic genes. (E) protein levels of OPA1, Parkin and LC3. Left panel: representative images of Western blotting. Right panel: cumulative data of each protein expression level. * p  <  0.05, ** p  <  0.01, *** p  <  0.001, **** p  <  0.0001. Con: control; CBX_M: CBX combined with mitoTEMPO treatment.
Figure 5
Figure 5
The effects of 11β-HSD2 dysfunction on mitochondrial function and MtDNA content in EVTs. HTR8 cells were treated with cortisol (10−6 M) in the presence and absence of CBX (10−6 M) for 24–48 h, and then the cells were used for OCR analysis, or harvested for mitochondria isolation and Q-PCR analysis. (A) Seahorse mitochondrial stress assay. Left panel: representative traces of OCR. Right panel: cumulative data of basal respiration, maximal respiration, ATP production and spare respiratory capacity. (B) mitochondrial function assay of ROS and ATP production. n = 3 independent cultures. * p < 0.05, ** p  <  0.01, *** p  <  0.001 Con: control; Cort: cortisol, CBX_Cort: CBX combined with cortisol.
Figure 6
Figure 6
MitoTEMPO treatment improves impaired migration and invasion function, MtDNA maintenance and mitochondria dynamic caused by 11β-HSD2 dysfunction in EVTs. HTR8 cells were treated with cortisol (10−6 M), CBX (10−6 M), mitoTEMPO (10−7 M) or their combination for 24 to 48 h. The cells were then used for the migration and invasion analysis as described in Methods. In some cases, cells were harvested for Q-PCR analysis. (A) the migration function analysis. Left panel: the fluorescence microscopic images show that the cells moved to the underside of the membrane (100 ×. Right panel: histogram shows the cumulative data of migration function. (B) the invasion function analysis. Left panel: the fluorescence microscopic images show that the cells moved to the underside of the membrane (100×). Right panel: histogram shows the cumulative data of invasion function. (C,D) the mRNA levels of MTERF2 and OPA1. (E) mtDNA copy number. n = 3 independent cultures. ** p < 0.01, *** p < 0.001, **** p < 0.0001. Con: control; Cort: cortisol, CBX_Cort: CBX combined with cortisol. CBX_Cort_M: CBX combined with cortisol and mitoTEMPO treatment.
Figure 7
Figure 7
OPA1 downregulation leads to mitochondrial dysfunction and impaired migration and invasion function in EVTs and OPA1 transcription is regulated by 11β-HSD2 in EVTs. HTR8 cells were transfected with scramble siRNA (si-NC) and OPA1 siRNA (si-OPA1) for 24 h, respectively. Then the cells were used for OCR analysis or harvested for mitochondria isolation and Western blotting and Q-PCR analysis. In some cases, the cells were used for migration and invasion analysis as described in Methods. (A) Seahorse mitochondrial stress assay. Left panel: representative traces of OCR. Right panel: cumulative data of basal respiration, maximal respiration, ATP production and spare respiratory capacity. (B) validation of OPA1 knockdown at protein level by Western blotting. (C) mitochondrial function assay of ROS and ATP production. (D) the migration and invasion function in HTR8 cells. Upper left panel: the fluorescence microscopic images show that the cells moved to the underside of the membrane (100×). Upper right panel: histogram shows the cumulative data of migration function. Lower left panel: the fluorescence microscopic images show that the cells moved to the underside of the membrane (100×). Lower right panel: histogram shows the cumulative data of invasion function. (E) mtDNA copy number. (F) transcriptional activity of OPA1 promoter. HTR8 cells were transfected with pGL3-luciferase reporter containing OPA1 promoter and combination with pRL-TK-Renilla-luciferase plasmid for 12 h. Cells were then treated with cortisol (10−6 M) combined with CBX (10−6 M) for 24 h. Luciferase assays were performed using the dual luciferase assay kit. n = 3 independent cultures. * p  <  0.05, ** p  <  0.01, *** p  <  0.001.
Figure 8
Figure 8
The correlation analysis of 11β-HSD2 level with OPA1, MTERF2, Ndufa1 and ATP5F1 levels in placentas of PE patients. (A) the expression levels of 11β-HSD2, OPA1, MTERF2, Ndufa1 and ATP5F1 in normotension (Con) and PE placentas. Left panel: representative images of Western blotting. Right panel: cumulative data of each protein expression level. (B) correlation analysis of grayscale value between 11β-HSD2 and OPA1. (C) correlation analysis of grayscale value between11β-HSD2 and ATP5F1. n = 24 in each group. * p  <  0.05, ** p  <  0.01.

Similar articles

Cited by

References

    1. Rana S., Lemoine E., Granger J.P., Karumanchi S.A. Preeclampsia: Pathophysiology, Challenges, and Perspectives. Circ. Res. 2019;124:1094–1112. doi: 10.1161/CIRCRESAHA.118.313276. - DOI - PubMed
    1. Ives C.W., Sinkey R., Rajapreyar I., Tita A.T.N., Oparil S. Preeclampsia-Pathophysiology and Clinical Presentations: JACC State-of-the-Art Review. J. Am. Coll. Cardiol. 2020;76:1690–1702. doi: 10.1016/j.jacc.2020.08.014. - DOI - PubMed
    1. Harrison S., LaForgia M. Seedling traits predict drought-induced mortality linked to diversity loss. Proc. Natl. Acad. Sci. USA. 2019;116:5576–5581. doi: 10.1073/pnas.1818543116. - DOI - PMC - PubMed
    1. Solano M.E., Arck P.C. Steroids, Pregnancy and Fetal Development. Front. Immunol. 2019;10:3017. doi: 10.3389/fimmu.2019.03017. - DOI - PMC - PubMed
    1. Busada J.T., Cidlowski J.A. Mechanisms of Glucocorticoid Action During Development. Curr. Top. Dev. Biol. 2017;125:147–170. doi: 10.1016/bs.ctdb.2016.12.004. - DOI - PubMed

LinkOut - more resources