. 2022 Aug 3;11(8):1512.
doi: 10.3390/antiox11081512.

Exogenously Applied Rohitukine Inhibits Photosynthetic Processes, Growth and Induces Antioxidant Defense System in Arabidopsis thaliana

Affiliations

Exogenously Applied Rohitukine Inhibits Photosynthetic Processes, Growth and Induces Antioxidant Defense System in Arabidopsis thaliana

Sajad Ahmed et al. Antioxidants (Basel). .

Abstract

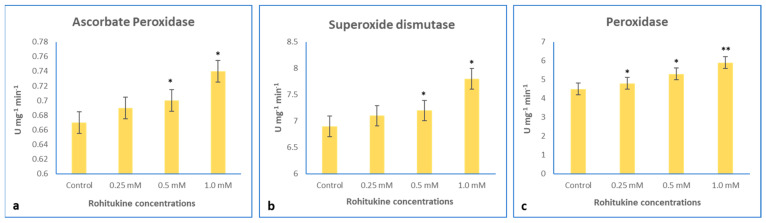
The secondary metabolite rohitukine has been reported in only a few plant species, including Schumanniophyton magnificum, S. problematicum, Amoora rohituka, Dysoxylum acutangulum and D. gotadhora. It has several biological activities, such as anticancer, anti-inflammatory, antiadipogenic, immunomodulatory, gastroprotective, anti-implantation, antidyslipidemic, anti-arthritic and anti-fertility properties. However, the ecological and physiological roles of rohitukine in parent plants have yet to be explored. Here for the first time, we tried to decipher the physiological effect of rohitukine isolated from D. gotadhora on the model system Arabidopsis thaliana. Application of 0.25 mM and 0.5 mM rohitukine concentrations moderately affected the growth of A. thaliana, whereas a remarkable decrease in growth and the alteration of various morphological, physiological and biochemical mechanisms were observed in plants that received 1.0 mM of rohitukine as compared to the untreated control. A. thaliana showed considerable dose-dependent decreases in leaf area, fresh weight and dry weight when sprayed with 0.25 mM, 0.5 mM and 1.0 mM of rohitukine. Rohitukine exposure resulted in the disruption of photosynthesis, photosystem II (PSII) activity and degradation of chlorophyll content in A. thaliana. It also triggered oxidative stress in visualized tissues through antioxidant enzyme activity and the expression levels of key genes involved in the antioxidant system, such as superoxide dismutase (SOD), peroxidase (POD) and ascorbate peroxidase (APX). Rohitukine-induced changes in levels of metabolites (amino acids, sugars, organic acids, etc.) were also assessed. In light of these results, we discuss (i) the likely ecological importance of rohitukine in parent plants as well as (ii) the comparison of responses to rohitukine treatment in plants and mammals.

Keywords: Arabidopsis; ROS; antioxidants; metabolome; rohitukine.


Conflict of interest statement

The authors declare no conflict of interest.

Figures

Figure 1
Figure 1
HPLC and MS chromatograms showing the purity of rohitukine isolated from leaves of D. gotadhora. (a) Chromatogram of standard rohitukine, 1 mg/mL. (b) Peak of rohitukine isolated from D. gotadhora. (c,d) Mass spectra showing the presence of a single peak of rohitukine (MW 305.3).
Figure 2
Figure 2
Detection and quantification of rohitukine in treated A. thaliana samples. (a) Structure of rohitukine. (b) Calibration curve of standard rohitukine. (c) Rohitukine standard, 1 mg/mL. (d) A. thaliana control peaks showing no traces of rohitukine. (eg) Peaks indicating the presence of rohitukine at 0.25 mM, 0.5 mM and 1.0 mM concentrations.
Figure 3
Figure 3
Morphology of A. thaliana plants treated with T0 (Control), T1 (0.25 mM), T2 (0.5 mM) and T3 (1.0 mM) rohitukine concentrations. (a) Five-week-old A. thaliana plants with and without rohitukine treatment. (b) Effects of 0.25 mM, 0.5mM and 1mM Rohitukine on leaf area of A. thaliana plants. (c) Average fresh weight of plants. (d) Effect of 0.25 mM, 0.5mM and 1mM Rohitukine on the dry weight of A. thaliana. The results are the means of more than three replicates expressed as means ± SD values. Statistical significance was determined by Student’s t-test. Asterisks * and ** denote the significance level of values at p-values < 0.5 and 0.05, respectively.
Figure 4
Figure 4
Effects of 0.25 mM, 0.5 mM and 1.0 mM rohitukine on (a) actual PSII efficiency, (b) maximum PSII efficiency, (c) intrinsic PSII efficiency, (d) photochemical quenching, (e) non-photo chemical quenching, (f) electron transport rate and (g) total chlorophyll content in five-week-old A. thaliana plants treated with rohitukine. Data are presented for the treatments as means ± SDs (n = 3). Statistical significance was determined using Dunnett’s multiple comparisons test. Asterisks *, ** and *** denote significance level at p-values < 0.5, 0.05 and 0.01, respectively.
Figure 5
Figure 5
The effects of rohitukine concentrations on T0 (control), T1 (0.25 mM), T2 (0.5 mM) and T3 (1.0 mM) as detected through histochemical detection of ROS in A. thaliana leaves. Superoxide ions were detected with NBT staining dye; the H2O2 visualization in leaves was performed via DAB staining.
Figure 6
Figure 6
Effects of 0.25 mM, 0.5 mM and 1.0 mM rohitukine on (a) APX, (b) SOD and (c) POD of five-week-old A. thaliana plants treated with rohitukine. Data are presented for the treatments as means ± SDs (n = 3). Statistical significance was determined by Dunnett’s multiple comparisons test. Asterisks * and ** denote significance level at p-values < 0.5 and 0.05, respectively.
Figure 7
Figure 7
qRT-PCR-based expression analysis of key genes of the antioxidant system of A. thaliana. The bar diagrams represent the fold change expression of each gene upon 0.25 mM, 0.5 mM and 1 mM rohitukine exposure as compared to untreated controls. The results are presented as the means of three replicates and as means ± SDs. Statistical significance was determined by Student’s t-test. Asterisks * and ** denote the significance of fold changes at p-values < 0.05 and 0.005, respectively, as compared to untreated controls.
Figure 8
Figure 8
Heatmap illustration of quantities of commonly found metabolites in A. thaliana after 0.25 mM, 0.5 mM and 1.0 mM rohitukine treatments as compared to controls. The colour intensities of each box represent the level of each metabolite in each rohitukine-treated group.

References

    1. Akula R., Ravishankar G.A. Influence of abiotic stress signals on secondary metabolites in plants. Plant Signal. Behav. 2011;6:1720–1731. doi: 10.4161/psb.6.11.17613. - DOI - PMC - PubMed
    1. Jan R., Asaf S., Numan M., Kim K.-M. Plant secondary metabolite biosynthesis and transcriptional regulation in response to biotic and abiotic stress conditions. Agronomy. 2021;11:968. doi: 10.3390/agronomy11050968. - DOI
    1. Aftab T. A review of medicinal and aromatic plants and their secondary metabolites status under abiotic stress. J. Med. Plant. 2019;7:99–106.
    1. Varma V. Advancements in the production of secondary metabolites. J. Nat. Prod. 2010;3:112–123.
    1. Jain C., Khatana S., Vijayvergia R. Bioactivity of secondary metabolites of various plants: A review. Int. J. Pharm. Sci. Res. 2019;10:494–504.

LinkOut - more resources