

Cellular Antioxidant Effect of an Aronia Extract and Its Polyphenolic Fractions Enriched in Proanthocyanidins, Phenolic Acids, and Anthocyanins
- PMID: 36009281
- PMCID: PMC9405024
- DOI: 10.3390/antiox11081561
Cellular Antioxidant Effect of an Aronia Extract and Its Polyphenolic Fractions Enriched in Proanthocyanidins, Phenolic Acids, and Anthocyanins
Abstract
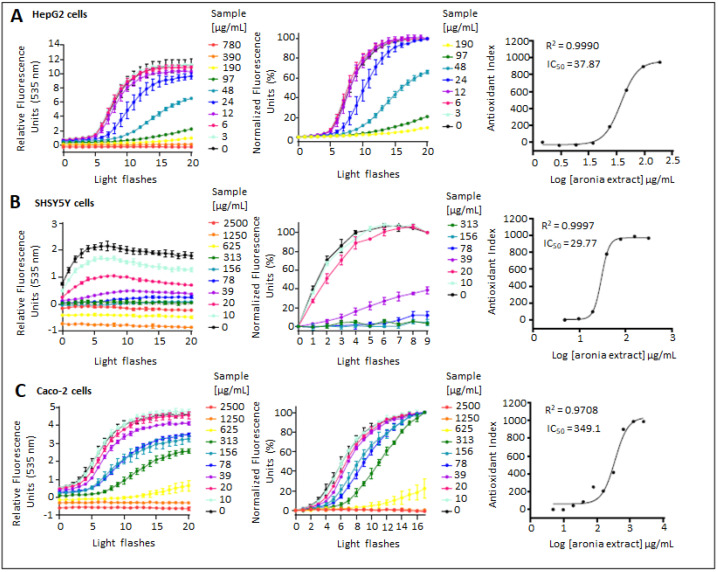
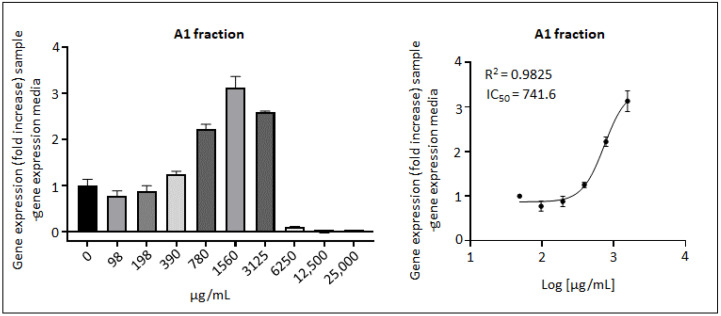
Oxidative stress and chronic inflammation contribute to some chronic diseases. Aronia berries are rich in polyphenols. The aim of the present study was to characterize the cellular antioxidant effect of an aronia extract to reflect the potential physiological in vivo effect. Cellular in vitro assays in three cell lines (Caco-2, HepG2, and SH-SY5Y) were used to measure the antioxidant effect of AE, in three enriched polyphenolic fractions (A1: anthocyanins and phenolic acids; A2: oligomeric proanthocyanidins; A3: polymeric proanthocyanidins), pure polyphenols and microbial metabolites. Both direct (intracellular and membrane radical scavenging, catalase-like effect) and indirect (NRF2/ARE) antioxidant effects were assessed. AE exerted an intracellular free radical scavenging activity in the three cell lines, and A2 and A3 fractions showed a higher effect in HepG2 and Caco-2 cells. AE also exhibited a catalase-like activity, with the A3 fraction having a significant higher activity. Only A1 fraction activated the NRF2/ARE pathway. Quercetin and caffeic acid are the most potent antioxidant polyphenols, whereas cyanidin and 5-(3',4'-dihydroxyphenyl)-γ-valerolactone showed the highest antioxidant effect among polyphenol metabolites. AE rich in polyphenols possesses broad cellular antioxidant effects, and proanthocyanidins are major contributors. Polyphenol metabolites may contribute to the overall antioxidant effect of such extract in vivo.
Keywords: (poly)phenols; NRF2; anthocyanins; antioxidant cell bioassays; aronia; chokeberry; oxidative stress; phenolic acids; proanthocyanidins.
Conflict of interest statement
J.A.V.R. and D.G. are employees of Symrise TN&H. C.D., M.R., C.G. and C.F. work for the Anti Oxidant Power company, which developed and owns the AOP1 bioassay patent. The other authors declare no conflicts of interest.
Figures

Similar articles
-
Black chokeberry (Aronia melanocarpa) polyphenols reveal different antioxidant, antimicrobial and neutrophil-modulating activities.Food Chem. 2019 Jun 30;284:108-117. doi: 10.1016/j.foodchem.2019.01.108. Epub 2019 Jan 23. Food Chem. 2019. PMID: 30744834
-
Underutilized chokeberry (Aronia melanocarpa, Aronia arbutifolia, Aronia prunifolia) accessions are rich sources of anthocyanins, flavonoids, hydroxycinnamic acids, and proanthocyanidins.J Agric Food Chem. 2013 Sep 11;61(36):8581-8. doi: 10.1021/jf402449q. Epub 2013 Aug 26. J Agric Food Chem. 2013. PMID: 23941506
-
Harvest date affects aronia juice polyphenols, sugars, and antioxidant activity, but not anthocyanin stability.Food Chem. 2015 Nov 15;187:189-96. doi: 10.1016/j.foodchem.2015.04.106. Epub 2015 Apr 23. Food Chem. 2015. PMID: 25977015
-
Potential Benefits of Black Chokeberry (Aronia melanocarpa) Fruits and Their Constituents in Improving Human Health.Molecules. 2022 Nov 13;27(22):7823. doi: 10.3390/molecules27227823. Molecules. 2022. PMID: 36431924 Free PMC article. Review.
-
Black Chokeberry Aronia melanocarpa L.-A Qualitative Composition, Phenolic Profile and Antioxidant Potential.Molecules. 2019 Oct 15;24(20):3710. doi: 10.3390/molecules24203710. Molecules. 2019. PMID: 31619015 Free PMC article. Review.
Cited by
-
Supplementation with a cranberry extract favors the establishment of butyrogenic guilds in the human fermentation SHIME system.Microbiome Res Rep. 2024 Jun 14;3(3):34. doi: 10.20517/mrr.2024.17. eCollection 2024. Microbiome Res Rep. 2024. PMID: 39421251 Free PMC article.
-
Metabolic Fate of Orally Ingested Proanthocyanidins through the Digestive Tract.Antioxidants (Basel). 2022 Dec 22;12(1):17. doi: 10.3390/antiox12010017. Antioxidants (Basel). 2022. PMID: 36670878 Free PMC article. Review.
-
Influence of Storage Conditions on Stability of Phenolic Compounds and Antioxidant Activity Values in Nutraceutical Mixtures with Edible Flowers as New Dietary Supplements.Antioxidants (Basel). 2023 Apr 19;12(4):962. doi: 10.3390/antiox12040962. Antioxidants (Basel). 2023. PMID: 37107337 Free PMC article.
-
Antioxidant potential of tree bark extracts: Insight from the multi-level output of the Antioxidant Power 1 assay.PLoS One. 2025 Jul 28;20(7):e0328790. doi: 10.1371/journal.pone.0328790. eCollection 2025. PLoS One. 2025. PMID: 40720417 Free PMC article.
-
Oligomeric Proanthocyanidins: An Updated Review of Their Natural Sources, Synthesis, and Potentials.Antioxidants (Basel). 2023 Apr 26;12(5):1004. doi: 10.3390/antiox12051004. Antioxidants (Basel). 2023. PMID: 37237870 Free PMC article. Review.
References
-
- Miller V., Mente A., Dehghan M., Rangarajan S., Zhang X., Swaminathan S., Dagenais G., Gupta R., Mohan V., Lear S. Fruit, vegetable, and legume intake, and cardiovascular disease and deaths in 18 countries (PURE): A prospective cohort study. Lancet. 2017;390:2037–2049. doi: 10.1016/S0140-6736(17)32253-5. - DOI - PubMed
Grants and funding
LinkOut - more resources
Full Text Sources
