. 2022 Jul 29;10(8):1838.
doi: 10.3390/biomedicines10081838.

miRNAs and isomiRs: Serum-Based Biomarkers for the Development of Intellectual Disability and Autism Spectrum Disorder in Tuberous Sclerosis Complex

Affiliations

miRNAs and isomiRs: Serum-Based Biomarkers for the Development of Intellectual Disability and Autism Spectrum Disorder in Tuberous Sclerosis Complex

Mirte Scheper et al. Biomedicines. .

Abstract

Tuberous sclerosis complex (TSC) is a rare multi-system genetic disorder characterized by a high incidence of epilepsy and neuropsychiatric manifestations known as tuberous-sclerosis-associated neuropsychiatric disorders (TANDs), including autism spectrum disorder (ASD) and intellectual disability (ID). MicroRNAs (miRNAs) are small regulatory non-coding RNAs that regulate the expression of more than 60% of all protein-coding genes in humans and have been reported to be dysregulated in several diseases, including TSC. In the current study, RNA sequencing analysis was performed to define the miRNA and isoform (isomiR) expression patterns in serum. A Receiver Operating Characteristic (ROC) curve analysis was used to identify circulating molecular biomarkers, miRNAs, and isomiRs, able to discriminate the development of neuropsychiatric comorbidity, either ASD, ID, or ASD + ID, in patients with TSC. Part of our bioinformatics predictions was verified with RT-qPCR performed on RNA isolated from patients' serum. Our results support the notion that circulating miRNAs and isomiRs have the potential to aid standard clinical testing in the early risk assessment of ASD and ID development in TSC patients.

Keywords: autism spectrum disorder; biomarkers; epilepsy; intellectual disability; serum; tuberous sclerosis complex.


Conflict of interest statement

The authors declare no conflict of interest.

Figures

Figure 1
Figure 1
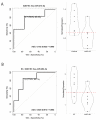
Receiver operating characteristic (ROC) curve analysis and violin plots for Intellectual Disability (ID), and Autism Spectrum Disorder (ASD), ASD + ID, as well as for discriminating between ID and ASD + ID and between ASD and ASD + ID. (A). ROC curve analysis for the miRNAs showed 100% sensitivity and 73.3% specificity for hsa-miR-409-5p in discriminating between controls (TSC without TANDs) and ID, corresponding to an AUC of 0.880. (B). Panel of four miRNAs signature discriminating between controls (TSC without TANDs) and ID. (C). For the discrimination between controls (TSC without TANDs) and ASD, hsa-let-7i-3p showed a 100% sensitivity and 80% specificity corresponding to an AUC of 0.894. (D). Panel of two miRNAs signature discriminating between controls (TSC without TANDs) and ASD. (E). For the discrimination between controls (TSC without TANDs) and ASD + ID, hsa-miR-214-5p showed 84.6% sensitivity and 73.30% specificity, corresponding to an AUC of 0.817. (F). For the comparison between ID and ASD + ID, hsa-miR-494-3p showed an 84.6% sensitivity and a 90% specificity, corresponding to an AUC of 0.908. (G). Panel of six miRNAs signature discriminating between ID and ASD + ID. (H). For the discrimination between ASD and ASD + ID, hsa-miR-103a-3p showed a 100% sensitivity and 83.3% specificity, corresponding to an AUC of 0.923. X-axis ROC curve: 100-Specificity in percentage (%); Y-axis ROC curve: Sensitivity in percentage (%); X-axis violin plot: Groups; Y-axis violin plot: Normalized expression. The red dotted line in each violin plot indicates the threshold that optimizes group separation.
Figure 1
Figure 1
Receiver operating characteristic (ROC) curve analysis and violin plots for Intellectual Disability (ID), and Autism Spectrum Disorder (ASD), ASD + ID, as well as for discriminating between ID and ASD + ID and between ASD and ASD + ID. (A). ROC curve analysis for the miRNAs showed 100% sensitivity and 73.3% specificity for hsa-miR-409-5p in discriminating between controls (TSC without TANDs) and ID, corresponding to an AUC of 0.880. (B). Panel of four miRNAs signature discriminating between controls (TSC without TANDs) and ID. (C). For the discrimination between controls (TSC without TANDs) and ASD, hsa-let-7i-3p showed a 100% sensitivity and 80% specificity corresponding to an AUC of 0.894. (D). Panel of two miRNAs signature discriminating between controls (TSC without TANDs) and ASD. (E). For the discrimination between controls (TSC without TANDs) and ASD + ID, hsa-miR-214-5p showed 84.6% sensitivity and 73.30% specificity, corresponding to an AUC of 0.817. (F). For the comparison between ID and ASD + ID, hsa-miR-494-3p showed an 84.6% sensitivity and a 90% specificity, corresponding to an AUC of 0.908. (G). Panel of six miRNAs signature discriminating between ID and ASD + ID. (H). For the discrimination between ASD and ASD + ID, hsa-miR-103a-3p showed a 100% sensitivity and 83.3% specificity, corresponding to an AUC of 0.923. X-axis ROC curve: 100-Specificity in percentage (%); Y-axis ROC curve: Sensitivity in percentage (%); X-axis violin plot: Groups; Y-axis violin plot: Normalized expression. The red dotted line in each violin plot indicates the threshold that optimizes group separation.
Figure 2
Figure 2
Receiver operating characteristic (ROC) curve analysis and violin plots for PCR validation of Autism Spectrum Disorder + Intellectual Disability (ASD + ID), as well as for discriminating between ID and ASD + ID. (A). ROC curve analysis for the miRNAs showed 83.3% sensitivity and 75.0% specificity for hsa-miR-214-5p in discriminating between controls (TSC without TANDs) and ASD + ID, corresponding to an AUC of 0.792. (B). For the discrimination between ID and ASD + ID, hsa-miR-494-3p showed an 85.7% sensitivity and 77.8% specificity, corresponding to an AUC of 0.825. X-axis ROC curve: 100-Specificity in percentage (%); Y-axis ROC curve: Sensitivity in percentage (%); X-axis violin plot: Groups; Y-axis violin plot: Normalized expression. The red dotted line in each violin plot indicates the threshold that optimizes group separation.
Figure 3
Figure 3
Receiver operating characteristic (ROC) curve analysis and violin plots for Intellectual Disability (ID), and Autism Spectrum Disorder (ASD), ASD + ID, as well as for discriminating between ID and ASD + ID and between ASD and ASD + ID. (A). ROC curve analysis for the isomiRs showed 90% sensitivity and 80% specificity for hsa-miR-409-5p for hsa-miR-409-3p_AT_3prime in discriminating between controls (TSC without TANDs) and ID corresponding to an AUC of 0.87. (B). hsa-miR-28-3p_G_3prime showed a 100% sensitivity and 80% specificity in discriminating between controls (TSC without TANDs) and ASD, corresponding to an AUC of 0.922. (C). For the discrimination between controls and ASD + ID hsa-miR-199b-5p_miRNA showed 69.2% sensitivity and 80% specificity, corresponding to an AUC of 0.787. (D). For the comparison between ID and ASD + ID, hsa-miR-410-3p_miRNA showed an 84.6% sensitivity and a 90% specificity, corresponding to an AUC of 0.931. (E). For the discrimination between ASD and ASD + ID, hsa-miR-221-3p_trim3 showed an 84.6% sensitivity and 100% specificity, corresponding to an AUC of 0.974. X-axis ROC curve: 100-Specificity in percentage (%); Y-axis ROC curve: Sensitivity in percentage (%); X-axis violin plot: Groups; Y-axis violin plot: Normalized expression. The red dotted line in each violin plot indicates the threshold that optimizes group separation.

Similar articles

Cited by

References

    1. Northrup H., Aronow M.E., Bebin E.M., Bissler J., Darling T.N., de Vries P.J., Frost M.D., Fuchs Z., Gosnell E.S., Gupta N., et al. Updated International Tuberous Sclerosis Complex Diagnostic Criteria and Surveillance and Management Recommendations. Pediatr. Neurol. 2021;123:50–66. doi: 10.1016/j.pediatrneurol.2021.07.011. - DOI - PubMed
    1. Sancak O., Nellist M., Goedbloed M., Elfferich P., Wouters C., Maat-Kievit A., Zonnenberg B., Verhoef S., Halley D., van den Ouweland A. Mutational Analysis of the TSC1 and TSC2 Genes in a Diagnostic Setting: Genotype--Phenotype Correlations and Comparison of Diagnostic DNA Techniques in Tuberous Sclerosis Complex. Eur. J. Hum. Genet. EJHG. 2005;13:731–741. doi: 10.1038/sj.ejhg.5201402. - DOI - PubMed
    1. Mühlebner A., Bongaarts A., Sarnat H.B., Scholl T., Aronica E. New Insights into a Spectrum of Developmental Malformations Related to MTOR Dysregulations: Challenges and Perspectives. J. Anat. 2019;235:521–542. doi: 10.1111/joa.12956. - DOI - PMC - PubMed
    1. Curatolo P., Moavero R., de Vries P.J. Neurological and Neuropsychiatric Aspects of Tuberous Sclerosis Complex. Lancet Neurol. 2015;14:733–745. doi: 10.1016/S1474-4422(15)00069-1. - DOI - PubMed
    1. Capal J.K., Williams M.E., Pearson D.A., Kissinger R., Horn P.S., Murray D., Currans K., Kent B., Bebin M., Northrup H., et al. Profile of Autism Spectrum Disorder in Tuberous Sclerosis Complex: Results from a Longitudinal, Prospective, Multisite Study. Ann. Neurol. 2021;90:874–886. doi: 10.1002/ana.26249. - DOI - PMC - PubMed

LinkOut - more resources