. 2022 Aug 4;10(8):1886.
doi: 10.3390/biomedicines10081886.

miRNome and Proteome Profiling of Small Extracellular Vesicles Secreted by Human Glioblastoma Cell Lines and Primary Cancer Stem Cells

Affiliations

miRNome and Proteome Profiling of Small Extracellular Vesicles Secreted by Human Glioblastoma Cell Lines and Primary Cancer Stem Cells

Ingrid Cifola et al. Biomedicines. .

Abstract

Glioblastoma (GBM) is the most common and aggressive brain tumor in adults. Despite available therapeutic interventions, it is very difficult to treat, and a cure is not yet available. The intra-tumoral GBM heterogeneity is a crucial factor contributing to poor clinical outcomes. GBM derives from a small heterogeneous population of cancer stem cells (CSCs). In cancer tissue, CSCs are concentrated within the so-called niches, where they progress from a slowly proliferating phase. CSCs, as most tumor cells, release extracellular vesicles (EVs) into the surrounding microenvironment. To explore the role of EVs in CSCs and GBM tumor cells, we investigated the miRNA and protein content of the small EVs (sEVs) secreted by two GBM-established cell lines and by GBM primary CSCs using omics analysis. Our data indicate that GBM-sEVs are selectively enriched for miRNAs that are known to display tumor suppressor activity, while their protein cargo is enriched for oncoproteins and tumor-associated proteins. Conversely, among the most up-regulated miRNAs in CSC-sEVs, we also found pro-tumor miRNAs and proteins related to stemness, cell proliferation, and apoptosis. Collectively, our findings support the hypothesis that sEVs selectively incorporate different miRNAs and proteins belonging both to fundamental processes (e.g., cell proliferation, cell death, stemness) as well as to more specialized ones (e.g., EMT, membrane docking, cell junction organization, ncRNA processing).

Keywords: cancer stem cells; extracellular vesicles; glioblastoma; miRNAs; proteome.


Conflict of interest statement

The authors declare no conflict of interest.

Figures

Figure 1
Figure 1
Characterization of sEVs released in cell culture media by U87, U373, and GBM primary CSCs. (A) Size of the released sEVs was measured via dynamic light scattering. The representative Intensity distribution curves are an average of five different measurements of the same sample. (B) sEVs purified from the different cell culture media were immunocaptured by magnetic Dynabeads conjugated with anti-CD63 tetraspanin antibodies, and bead-bound sEVs were processed for the detection of the indicated surface markers via immunofluorescence and flow cytometry. Aggregates and debris were excluded (gating) from the fluorescence analysis. In each cytogram, the reported number represents the percentage of positivity for the indicated marker. PdI, intensity distribution; SSC, side scatter; FL1, green fluorescence; FL4, far red fluorescence; PE, phycoerythrin; FITC, fluorescein isothiocyanate; ZONAB, ZO-1-associated Nucleic-Acid-Binding protein; GFAP, glial fibrillary acidic protein; POS, positive; NEG, negative.
Figure 1
Figure 1
Characterization of sEVs released in cell culture media by U87, U373, and GBM primary CSCs. (A) Size of the released sEVs was measured via dynamic light scattering. The representative Intensity distribution curves are an average of five different measurements of the same sample. (B) sEVs purified from the different cell culture media were immunocaptured by magnetic Dynabeads conjugated with anti-CD63 tetraspanin antibodies, and bead-bound sEVs were processed for the detection of the indicated surface markers via immunofluorescence and flow cytometry. Aggregates and debris were excluded (gating) from the fluorescence analysis. In each cytogram, the reported number represents the percentage of positivity for the indicated marker. PdI, intensity distribution; SSC, side scatter; FL1, green fluorescence; FL4, far red fluorescence; PE, phycoerythrin; FITC, fluorescein isothiocyanate; ZONAB, ZO-1-associated Nucleic-Acid-Binding protein; GFAP, glial fibrillary acidic protein; POS, positive; NEG, negative.
Figure 2
Figure 2
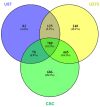
miRNA expression in GBM- and CSC-sEVs. (A) Venn diagram shows overlaps between the miRNAs expressed in sEVs secreted by U87, U373, and GBM primary CSCs. (B) The pie charts show the top 10 most abundant miRNAs in sEVs secreted by U87, U373, and GBM primary CSCs. MiRNAs common to two or more samples are underlined.
Figure 3
Figure 3
Functional enrichment analysis of miRNA target genes. Bubble plot shows a selection of biological functions of interest significantly enriched by miRNA target genes for GBM- and CSC-sEVs. Bubble size represents the number of target genes involved in each enriched function, while color gradient indicates statistical significance of the enrichment (FDR-BH, in log10 scale). Only significant enrichments are shown (FDR cutoff: 0.01).
Figure 4
Figure 4
Protein expression in GBM- and CSC-sEVs. Venn diagram shows overlaps among the proteins expressed in sEVs secreted by U87, U373, and GBM primary CSCs. A total of 2445 proteins were identified and quantified, with at least two peptides in at least two biological replicates per sample: 1066 (U87), 1606 (U373), and 1989 (CSCs) proteins were carried in the respective secreted sEVs; 788 proteins were common to all the three samples.
Figure 5
Figure 5
Proteins annotated in MISEV 2018 categories [10] assessing the quality of EV preparations. A total of 17% of our total protein dataset has been annotated in the MISEV2018 categories. The number reported next to each column is the relative percentage of the proteins annotated in that category.
Figure 6
Figure 6
(A) Hierarchical clustering analysis of proteins in GBM- and CSC-sEVs. The clustering analysis is based on the Euclidean distance and complete linkage. The heatmap was divided into nine clusters (distance threshold = 4.5). (B) Functional enrichment analysis of proteins in GBM- and CSC-sEVs. In the String network, the degree of interconnection of each protein is proportional to the node size and the confidence of the interaction to the connecting edge size. The fill color scheme considers the presence of the protein in the samples, while the border color and thickness consider the significant quantitative difference between the CSC sample and established cell line samples (bottom right). The enriched GO Biological function term details are reported in Table S7.
Figure 6
Figure 6
(A) Hierarchical clustering analysis of proteins in GBM- and CSC-sEVs. The clustering analysis is based on the Euclidean distance and complete linkage. The heatmap was divided into nine clusters (distance threshold = 4.5). (B) Functional enrichment analysis of proteins in GBM- and CSC-sEVs. In the String network, the degree of interconnection of each protein is proportional to the node size and the confidence of the interaction to the connecting edge size. The fill color scheme considers the presence of the protein in the samples, while the border color and thickness consider the significant quantitative difference between the CSC sample and established cell line samples (bottom right). The enriched GO Biological function term details are reported in Table S7.
Figure 7
Figure 7
Biological functions enriched by miRNA target genes and/or proteins for sEVs secreted by GBM cell lines and primary CSCs. For each function of interest, the number of target genes and/or proteins enriching that process is plotted in different colors for GBM cell lines and CSCs. Orange points represent the statistical significance of the enrichments (FDR, in log10 scale). Only significant enrichments are shown (FDR cutoff: 0.01).

Similar articles

Cited by

References

    1. Sung H., Ferlay J., Siegel R.L., Laversanne M., Soerjomataram I., Jemal A., Bray F. Global Cancer Statistics 2020: GLOBOCAN Estimates of Incidence and Mortality Worldwide for 36 Cancers in 185 Countries. CA Cancer J. Clin. 2021;71:209–249. doi: 10.3322/caac.21660. - DOI - PubMed
    1. Bernstock J.D., Mooney J.H., Ilyas A., Chagoya G., Estevez-Ordonez D., Ibrahim A., Nakano I. Molecular and cellular intratumoral heterogeneity in primary glioblastoma: Clinical and translational implications. J. Neurosurg. 2019;23:1–9. doi: 10.3171/2019.5.JNS19364. - DOI - PubMed
    1. Pointer K.B., Clark P.A., Zorniak M., Alrfaei B.M., Kuo J.S. Glioblastoma cancer stem cells: Biomarker and therapeutic advances. Neurochem. Int. 2014;71:1–7. doi: 10.1016/j.neuint.2014.03.005. - DOI - PMC - PubMed
    1. Lathia J.D., Mack S.C., Mulkearns-Hubert E.E., Valentim C.L.L., Rich J.N. Cancer stem cells in glioblastoma. Genes Dev. 2015;29:1203–1217. doi: 10.1101/gad.261982.115. - DOI - PMC - PubMed
    1. Cenciarelli C., Marei H.E., Zonfrillo M., Casalbore P., Felsani A., Giannetti S., Trevisi G., Althani A., Mangiola A. The interference of Notch1 target Hes1 affects cell growth, differentiation, and invasiveness of Glioblastoma stem cells through modulation of oncogenic signals. Oncotarget. 2017;8:17873–17886. doi: 10.18632/oncotarget.15013. - DOI - PMC - PubMed