. 2022 Aug 21;10(8):2038.
doi: 10.3390/biomedicines10082038.

Genomic Aberrations Generate Fusion Gene FOXK2::TP63 and Activate NFKB1 in Cutaneous T-Cell Lymphoma

Affiliations

Genomic Aberrations Generate Fusion Gene FOXK2::TP63 and Activate NFKB1 in Cutaneous T-Cell Lymphoma

Stefan Nagel et al. Biomedicines. .

Abstract

Cutaneous T-cell lymphoma (CTCL) is a severe lymphoid malignancy with a worse prognosis lacking curative treatment regimens. Several gene mutations and deregulated pathways, including NFkB signaling, have been implicated in its pathogenesis. Accordingly, CTCL cell line HUT-78 reportedly contains mutated NFKB2, which is constitutively activated via partial gene deletion, also demonstrating that genomic rearrangements cause driving mutations in this malignancy. Here, along with HUT-78, we analyzed CTCL cell line HH to identify additional aberrations underlying gene deregulation. Karyotyping and genomic profiling of HH showed several rearrangements worthy of detailed investigation. Corresponding to the established karyotype, RNA-seq data and PCR analysis confirmed the presence of t(3;17)(q28;q25), generating a novel fusion gene, FOXK2::TP63. Furthermore, chromosomal rearrangement t(1;4)(p32;q25) was connected to amplification at 4q24-26, affecting aberrant NFKB1 overexpression thereat. Transcription factor binding-site analysis and knockdown experiments demonstrated that IRF4 contributed to NFKB1 expression. Within the same amplicon, we identified amplification and overexpression of NFkB signaling activator CAMK2D (4q26) and p53-inhibitor UBE2D3 (4q24). Genomic profiling data for HUT-78 detailed a deletion at 10q25 underlying reported NFKB2 activation. Moreover, amplifications of ID1 (20q11) and IKZF2 (2q34) in this cell line drove overexpression of these NK cell differentiation factors and possibly thus formed corresponding lineage characteristics. Target gene analysis for NFKB1 via siRNA-mediated knockdown in HH revealed activation of TP63, MIR155, and NOTCH pathway component RBPJ. Finally, treatment of HH with NFkB inhibitor demonstrated a role for NFkB in supporting proliferation, while usage of inhibitor DAPT showed significant survival effects via the NOTCH pathway. Collectively, our data suggest that NFkB and/or NOTCH inhibitors may represent reasonable treatment options for subsets of CTCL patients.

Keywords: MOTN-1; T-ALL; TPL1XR1::TP63.


Conflict of interest statement

The authors declare no conflict of interest.

Figures

Figure 1
Figure 1
Karyotyping and fusion gene analysis. (A) Reverse DAPI G-banding (left images) and SKY (right) showing multiple rearrangements in HH, notably der(4)—pink arrows and semi-cryptic der(17)t(3;17)(q28;q25)—red arrows. (B) RT-PCR (left) and sequence analyses (right) of HH (above) and MOTN-1 (below) showed the presence of fusion genes FOXK2::TP63 and TBL1R1::TP63, respectively. In MOTN-1, one PCR product corresponded to an out-of-frame fusion and is labeled by an asterisk. * p < 0.05.
Figure 2
Figure 2
Amplification at 4q24–26 in cell line HH. (A) Genomic profiling data for chromosome 4 indicates an amplicon at 4q24–26 and telomeric deletion. (B) FISH analysis using a red-labeled probe (348F2), which covers the locus for NFKB1 at 4q24, demonstrating strong amplification/triplication on der(4) while normal chromosomes 4 (N4) show single copies.
Figure 3
Figure 3
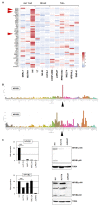
Amplification at 4q24–26 in HH activates NFKB1. (A) Heatmap showing RNA-seq-based expression levels for 49 genes amplified at 4q24–26 in HH. In comparison to CTCL cell line HH, two additional mature T-cell lines, three NK-cell lines, and six T-ALL cell lines were analyzed. Genes NFKB1, UBE2D3, and CAMK2D are indicated by red arrowheads. (B) LL-100 RNA-seq gene expression data for NFKB1 (above) and NFKB2 (below) are shown as bar plots. CTCL cell line HH is indicated by a black arrowhead. (C) RQ-PCR (left) and Western blot analysis (right) of NFKB1 (above) and NFKB2 (below) in CTCL cell lines and control T-cell line JURKAT. Artificial bands are labeled by asterisks. * p < 0.05, *** p < 0.001.
Figure 4
Figure 4
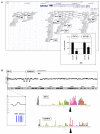
IRF4 activates NFKB1. (A) TF binding-site analysis using UCSC genome browser data indicates several potential IRF sites at NFKB1. RQ-PCR analysis of HH treated for siRNA-mediated knockdown of IRF4 demonstrated concomitant downregulation of IRF4 and NFKB1 (insert). Statistical significance was assessed by t-test and derived p-values indicated by asterisks (* p < 0.05, ** p < 0.01). (B) Genomic profiling data for chromosome 6 of CTCL cell line HH showing a genomic gain at 6p25 and three microdeletions at 6p21, targeting IRF4 and CDKN1A, respectively (above). LL-100 RNA-seq data showing expression levels of IRF4 and CDKN1A (below). The cell line HH is indicated by a black arrowhead.
Figure 5
Figure 5
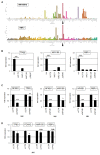
NFKB1 activates TP63, MIR155, and RBPJ in HH. (A) LL-100 RNA-seq data showing expression levels of MIR155 (above) and RBPJ (below). The cell line HH is indicated by a black arrowhead. (B) RQ-PCR analysis of TP63 (left), MIR155 (middle), and RBPJ (right) in CTCL and control cell lines showing high expression levels in HH. (C) RQ-PCR mediated target gene analysis of HH treated for siRNA-mediated knockdown of NFKB1. (D) RQ-PCR analysis of HH treated for siRNA-mediated knockdown of TP63. Statistical significance was assessed by t-test and derived p-values indicated by asterisks (* p < 0.05, ** p < 0.01, *** p < 0.001, n.s. not significant).
Figure 6
Figure 6
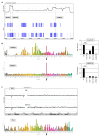
Additional copy number alterations in HH and HUT-78. (A) Genomic profiling data for HH showing the amplified region at 4q24–26, which hosts the genes NFKB1, UBE2D3 and CAMK2D. (B) LL-100 RNA-seq data (left) and RQ-PCR analysis (right) of CAMK2D and UB2D3 showing elevated expression levels in HH (indicated by an arrowhead). Statistical significance was assessed by t-test and derived p-values indicated by asterisks (** p < 0.01, *** p < 0.001). (C) Genomic profiling data for chromosome 17 of HH and HUT-78 showing microdeletions at 17p12 covering TP53 (above). LL-100 RNA-seq data of TP53 (below) showing reduced expression levels in HH (arrowhead).
Figure 7
Figure 7
Amplification of NK-cell factors in HUT-78. (A) Genomic profiling data of chromosome 20 for HH and HUT-78 showing an amplification at 20q11 in HUT-78 that contains the genes ID1 and BCL2L1 (left). Copy number analysis of ID1 in comparison to MEF2C by RQ-PCR for three cell lines. The values for HH were set to unity (insert). RQ-PCR analysis of ID1 and BCL2L1 showing elevated expression levels in HUT-78 (right). NK-cell lines served as additional controls. (B) Genomic profiling data of chromosome 2 for HH and HUT-78 showing amplification of IKZF2 at 2q34 (left). RQ-PCR analysis of IKZF2 (left) showing elevated expression levels in HUT-78 and selected NK-cell lines (right). Statistical significance was assessed by t-test and derived p-values indicated by asterisks (** p < 0.01, *** p < 0.001). (C) Dendrogram illustrating the result of a cluster analysis for expression profiling data from CTCL, T-ALL, and NK-cell cell lines. The cell lines HH and HUT-78 are segregated and indicated by black arrowheads.
Figure 8
Figure 8
Live-cell imaging analysis of CTCL cell lines HH and HUT-78. (A) Analysis of apoptosis (left) and proliferation (right) of HH (above) and HUT-78 (below) after treatment with NFkB inhibitor. (B) Analysis of apoptosis in HH (left) and HUT-78 (right) after treatment with NOTCH-inhibitor DAPT. (C) Analysis of apoptosis in HH after siRNA-mediated knockdown of NFKB1 and simultaneous treatment with NOTCH-inhibitor DAPT. Indicated p-values refer to terminal time points of treated versus control cells.
Figure 9
Figure 9
Summary of the results from this study showing upstream and downstream factors of NFKB factors in CTCL cell lines HH and HUT-78. Chromosomal aberrations are indicated above. Factors and functions are shown for NFkB signaling (indicated in blue), NOTCH signaling (red), p53 pathway (green), and NK-cell differentiation (black).

Similar articles

Cited by

  • Molecular Landscape of Endometrial Stromal Tumors.
    Brunetti M, Vitelli V, Naas AM, Zahl Eriksson AG, Haugland HK, Krakstad C, Micci F. Brunetti M, et al. JCO Precis Oncol. 2025 May;9:e2400779. doi: 10.1200/PO-24-00779. Epub 2025 May 22. JCO Precis Oncol. 2025. PMID: 40403211 Free PMC article.

References

    1. Dummer R., Vermeer M.H., Scarisbric K.J.J., Kim Y.H., Stonesifer C., Tensen C.P., Geskin L.J., Quaglino P., Ramelyte E., Cutaneous T. Cell Lymphoma. Nat. Rev. Dis. Primers. 2021;7:61. doi: 10.1038/s41572-021-00296-9. - DOI - PubMed
    1. Bastidas Torres A.N., Cats D., Mei H., Szuhai K., Willemze R., Vermeer M.H., Tensen C.P. Genomic analysis reveals recurrent deletion of JAK-STAT signaling inhibitors, HNRNPK and SOCS1 in mycosis fungoides. Genes Chromosomes Cancer. 2018;57:653–664. doi: 10.1002/gcc.22679. - DOI - PMC - PubMed
    1. Vermeer M.H., van Doorn R., Dijkman R., Mao X., Whittaker S., van Voorst Vader P.C., Gerritsen M.J.P., Geerts M.L., Gellrich S., Soderberg O., et al. Novel and highly recurrent chromosomal alterations in Sezary syndrome. Cancer Res. 2008;68:2689–2698. doi: 10.1158/0008-5472.CAN-07-6398. - DOI - PubMed
    1. Laharanne E., Oumouhou N., Bonnet F., Carlotti M., Gentil C., Chevret E., Jouary T., Longy M., Vergier B., Beylot-Barry M., et al. Genome-wide analysis of cutaneous T-cell lymphomas identifies three clinically relevant classes. J. Investig. Dermatol. 2010;130:1707–1718. doi: 10.1038/jid.2010.8. - DOI - PubMed
    1. Choi J., Goh G., Walradt T., Hong B.S., Bunick C.G., Chen K., Bjornson R.D., Maman Y., Wang T., Tordoff J., et al. Genomic landscape of cutaneous T cell lymphoma. Nat. Genet. 2015;47:1011–1019. doi: 10.1038/ng.3356. - DOI - PMC - PubMed