

Production of Reactive Oxygen Species by Epicardial Adipocytes Is Associated with an Increase in Postprandial Glycemia, Postprandial Insulin, and a Decrease in Serum Adiponectin in Patients with Severe Coronary Atherosclerosis
- PMID: 36009601
- PMCID: PMC9405686
- DOI: 10.3390/biomedicines10082054
Production of Reactive Oxygen Species by Epicardial Adipocytes Is Associated with an Increase in Postprandial Glycemia, Postprandial Insulin, and a Decrease in Serum Adiponectin in Patients with Severe Coronary Atherosclerosis
Abstract
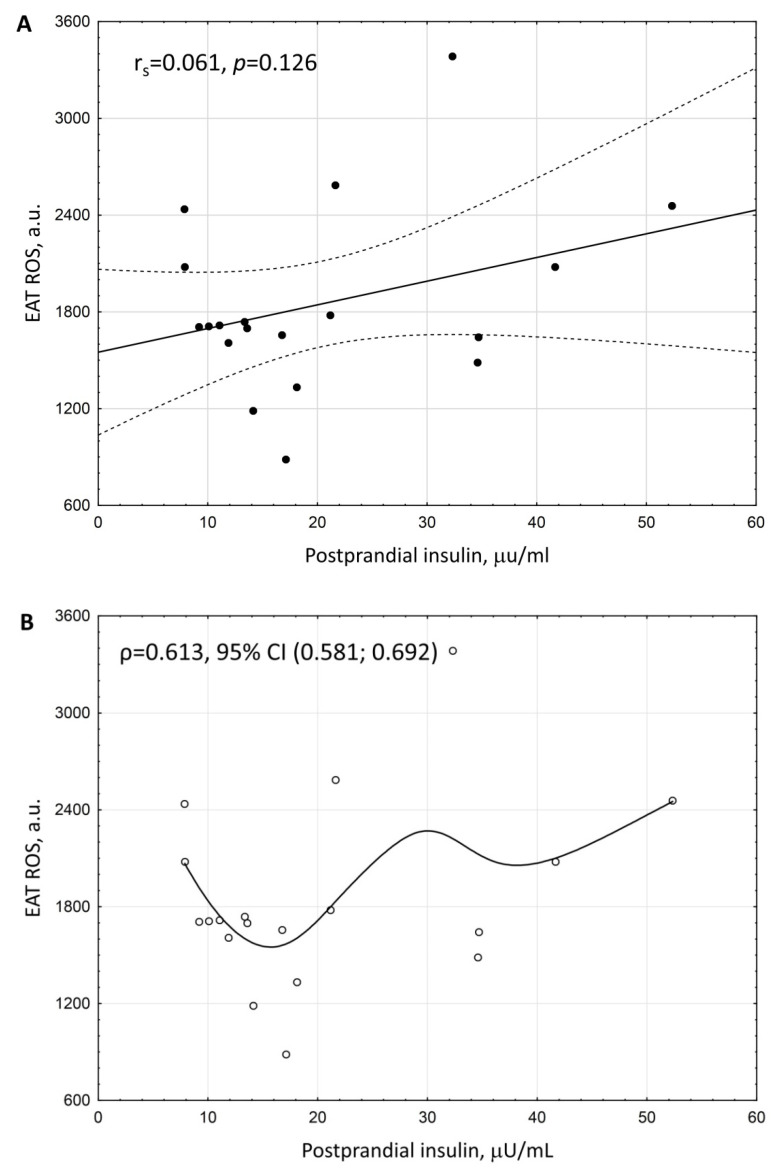
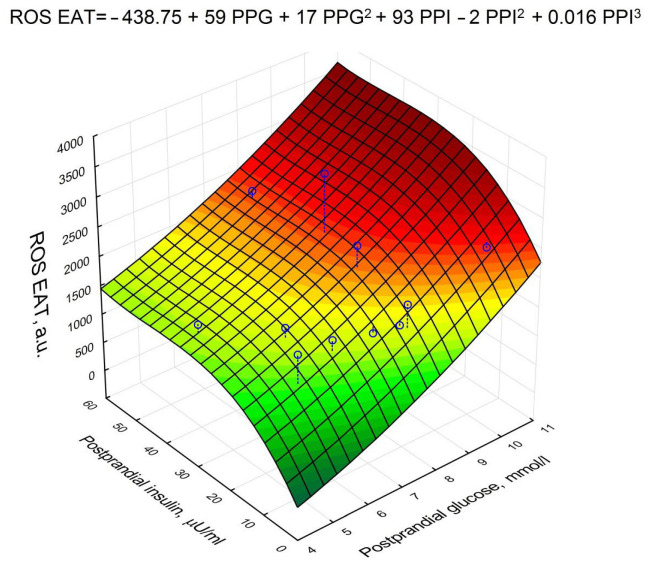
Purpose. This work investigates the relations between the production of reactive oxygen species (ROS) by epicardial adipose tissue (EAT) adipocytes and parameters of glucose/insulin metabolism, circulating adipokines levels, and severity of coronary atherosclerosis in patients with coronary artery disease (CAD); establishing significant determinants describing changes in ROS EAT in this category of patients. Material and methods. This study included 19 patients (14 men and 5 women, 53−72 y.o., 6 patients with diabetes mellitus type 2; 5 patients with prediabetes), with CAD, who underwent coronary artery bypass graft surgery. EAT adipocytes were isolated by the enzymatic method from intraoperative explants obtained during coronary artery bypass grafting. The size of EAT adipocytes and ROS level were determined. Results. The production of ROS by EAT adipocytes demonstrated a direct correlation with the level of postprandial glycemia (rs = 0.62, p < 0.05), and an inverse correlation with serum adiponectin (rs = −0.50, p = 0.026), but not with general and abdominal obesity, EAT thickness, and dyslipidemia. Regression analysis demonstrated that the increase in ROS of EAT adipocytes occurs due to the interaction of the following factors: postprandial glycemia (β = 0.95), postprandial insulin (β = 0.24), and reduced serum adiponectin (β = −0.20). EAT adipocytes in patients with diabetes and prediabetes manifested higher ROS production than in patients with normoglycemia. Although there was no correlation between the production of ROS by EAT adipocytes and Gensini score in the total group of patients, higher rates of oxidative stress were observed in EAT adipocytes from patients with a Gensini score greater than median Gensini score values (≥70.55 points, Gr.B), compared to patients with less severe coronary atherosclerosis (<70.55 points, Gr.A). Of note, the frequency of patients with diabetes and prediabetes was higher among the patients with the most severe coronary atherosclerosis (Gr.B) than in the Gr.A. Conclusions. Our data have demonstrated for the first time that systemic impairments of glucose/insulin metabolism and a decrease in serum adiponectin are significant independent determinants of oxidative stress intensity in EAT adipocytes in patients with severe coronary atherosclerosis. The possible input of the interplay between oxidative stress in EAT adipocytes and metabolic disturbances to the severity of coronary atherosclerosis requires further investigation.
Keywords: adipocytes; adiponectin; coronary atherosclerosis; epicardial adipose tissue; leptin; postprandial glycemia; postprandial insulin; reactive oxygen species.
Conflict of interest statement
The authors declare no conflict of interest.
Figures


References
-
- Krylatov A.V., Maslov L.N., Voronkov N.S., Boshchenko A.A., Popov S.V., Gomez L., Wang H., Jaggi A.S., Downey J.M. Reactive Oxygen Species as Intracellular Signaling Molecules in the Cardiovascular System. Curr. Cardiol. Rev. 2018;14:290–300. doi: 10.2174/1573403X14666180702152436. - DOI - PMC - PubMed
LinkOut - more resources
Full Text Sources
Miscellaneous
